System size and energy dependence of near-side di-hadron correlations
G. Agakishiev
Joint Institute for Nuclear Research, Dubna, 141 980, Russia
M. M. Aggarwal
Panjab University, Chandigarh 160014, India
Z. Ahammed
Variable Energy Cyclotron Centre, Kolkata 700064, India
A. V. Alakhverdyants
Joint Institute for Nuclear Research, Dubna, 141 980, Russia
I. Alekseev
Alikhanov Institute for Theoretical and Experimental Physics, Moscow, Russia
J. Alford
Kent State University, Kent, Ohio 44242, USA
B. D. Anderson
Kent State University, Kent, Ohio 44242, USA
C. D. Anson
Ohio State University, Columbus, Ohio 43210, USA
D. Arkhipkin
Brookhaven National Laboratory, Upton, New York 11973, USA
G. S. Averichev
Joint Institute for Nuclear Research, Dubna, 141 980, Russia
J. Balewski
Massachusetts Institute of Technology, Cambridge, MA 02139-4307, USA
L. S. Barnby
University of Birmingham, Birmingham, United Kingdom
D. R. Beavis
Brookhaven National Laboratory, Upton, New York 11973, USA
R. Bellwied
University of Houston, Houston, TX, 77204, USA
M. J. Betancourt
Massachusetts Institute of Technology, Cambridge, MA 02139-4307, USA
R. R. Betts
University of Illinois at Chicago, Chicago, Illinois 60607, USA
A. Bhasin
University of Jammu, Jammu 180001, India
A. K. Bhati
Panjab University, Chandigarh 160014, India
H. Bichsel
University of Washington, Seattle, Washington 98195, USA
J. Bielcik
Czech Technical University in Prague, FNSPE, Prague, 115 19, Czech Republic
J. Bielcikova
Nuclear Physics Institute AS CR, 250 68 Řež/Prague, Czech Republic
L. C. Bland
Brookhaven National Laboratory, Upton, New York 11973, USA
M. Bombara
University of Birmingham, Birmingham, United Kingdom
I. G. Bordyuzhin
Alikhanov Institute for Theoretical and Experimental Physics, Moscow, Russia
W. Borowski
SUBATECH, Nantes, France
J. Bouchet
Kent State University, Kent, Ohio 44242, USA
E. Braidot
NIKHEF and Utrecht University, Amsterdam, The Netherlands
A. V. Brandin
Moscow Engineering Physics Institute, Moscow Russia
S. G. Brovko
University of California, Davis, California 95616, USA
E. Bruna
Yale University, New Haven, Connecticut 06520, USA
S. Bueltmann
Old Dominion University, Norfolk, VA, 23529, USA
I. Bunzarov
Joint Institute for Nuclear Research, Dubna, 141 980, Russia
T. P. Burton
Brookhaven National Laboratory, Upton, New York 11973, USA
X. Z. Cai
Shanghai Institute of Applied Physics, Shanghai 201800, China
H. Caines
Yale University, New Haven, Connecticut 06520, USA
M. Calderón de la Barca Sánchez
University of California, Davis, California 95616, USA
D. Cebra
University of California, Davis, California 95616, USA
R. Cendejas
University of California, Los Angeles, California 90095, USA
M. C. Cervantes
Texas A&M University, College Station, Texas 77843, USA
P. Chaloupka
Nuclear Physics Institute AS CR, 250 68 Řež/Prague, Czech Republic
S. Chattopadhyay
Variable Energy Cyclotron Centre, Kolkata 700064, India
H. F. Chen
University of Science & Technology of China, Hefei 230026, China
J. H. Chen
Shanghai Institute of Applied Physics, Shanghai 201800, China
J. Y. Chen
Institute of Particle Physics, CCNU (HZNU), Wuhan 430079, China
L. Chen
Institute of Particle Physics, CCNU (HZNU), Wuhan 430079, China
J. Cheng
Tsinghua University, Beijing 100084, China
M. Cherney
Creighton University, Omaha, Nebraska 68178, USA
A. Chikanian
Yale University, New Haven, Connecticut 06520, USA
W. Christie
Brookhaven National Laboratory, Upton, New York 11973, USA
P. Chung
Nuclear Physics Institute AS CR, 250 68 Řež/Prague, Czech Republic
M. J. M. Codrington
Texas A&M University, College Station, Texas 77843, USA
R. Corliss
Massachusetts Institute of Technology, Cambridge, MA 02139-4307, USA
J. G. Cramer
University of Washington, Seattle, Washington 98195, USA
H. J. Crawford
University of California, Berkeley, California 94720, USA
X. Cui
University of Science & Technology of China, Hefei 230026, China
A. Davila Leyva
University of Texas, Austin, Texas 78712, USA
L. C. De Silva
University of Houston, Houston, TX, 77204, USA
R. R. Debbe
Brookhaven National Laboratory, Upton, New York 11973, USA
T. G. Dedovich
Joint Institute for Nuclear Research, Dubna, 141 980, Russia
J. Deng
Shandong University, Jinan, Shandong 250100, China
A. A. Derevschikov
Institute of High Energy Physics, Protvino, Russia
R. Derradi de Souza
Universidade Estadual de Campinas, Sao Paulo, Brazil
S. Dhamija
Indiana University, Bloomington, Indiana 47408, USA
L. Didenko
Brookhaven National Laboratory, Upton, New York 11973, USA
P. Djawotho
Texas A&M University, College Station, Texas 77843, USA
X. Dong
Lawrence Berkeley National Laboratory, Berkeley, California 94720, USA
J. L. Drachenberg
Texas A&M University, College Station, Texas 77843, USA
J. E. Draper
University of California, Davis, California 95616, USA
C. M. Du
Institute of Modern Physics, Lanzhou, China
L. E. Dunkelberger
University of California, Los Angeles, California 90095, USA
J. C. Dunlop
Brookhaven National Laboratory, Upton, New York 11973, USA
L. G. Efimov
Joint Institute for Nuclear Research, Dubna, 141 980, Russia
M. Elnimr
Wayne State University, Detroit, Michigan 48201, USA
J. Engelage
University of California, Berkeley, California 94720, USA
G. Eppley
Rice University, Houston, Texas 77251, USA
L. Eun
Lawrence Berkeley National Laboratory, Berkeley, California 94720, USA
O. Evdokimov
University of Illinois at Chicago, Chicago, Illinois 60607, USA
R. Fatemi
University of Kentucky, Lexington, Kentucky, 40506-0055, USA
J. Fedorisin
Joint Institute for Nuclear Research, Dubna, 141 980, Russia
R. G. Fersch
University of Kentucky, Lexington, Kentucky, 40506-0055, USA
P. Filip
Joint Institute for Nuclear Research, Dubna, 141 980, Russia
E. Finch
Yale University, New Haven, Connecticut 06520, USA
Y. Fisyak
Brookhaven National Laboratory, Upton, New York 11973, USA
C. A. Gagliardi
Texas A&M University, College Station, Texas 77843, USA
L. Gaillard
University of Birmingham, Birmingham, United Kingdom
D. R. Gangadharan
Ohio State University, Columbus, Ohio 43210, USA
F. Geurts
Rice University, Houston, Texas 77251, USA
P. Ghosh
Variable Energy Cyclotron Centre, Kolkata 700064, India
S. Gliske
Argonne National Laboratory, Argonne, Illinois 60439, USA
Y. N. Gorbunov
Creighton University, Omaha, Nebraska 68178, USA
O. G. Grebenyuk
Lawrence Berkeley National Laboratory, Berkeley, California 94720, USA
D. Grosnick
Valparaiso University, Valparaiso, Indiana 46383, USA
A. Gupta
University of Jammu, Jammu 180001, India
S. Gupta
University of Jammu, Jammu 180001, India
W. Guryn
Brookhaven National Laboratory, Upton, New York 11973, USA
B. Haag
University of California, Davis, California 95616, USA
O. Hajkova
Czech Technical University in Prague, FNSPE, Prague, 115 19, Czech Republic
A. Hamed
Texas A&M University, College Station, Texas 77843, USA
L-X. Han
Shanghai Institute of Applied Physics, Shanghai 201800, China
J. W. Harris
Yale University, New Haven, Connecticut 06520, USA
J. P. Hays-Wehle
Massachusetts Institute of Technology, Cambridge, MA 02139-4307, USA
S. Heppelmann
Pennsylvania State University, University Park, Pennsylvania 16802, USA
A. Hirsch
Purdue University, West Lafayette, Indiana 47907, USA
G. W. Hoffmann
University of Texas, Austin, Texas 78712, USA
D. J. Hofman
University of Illinois at Chicago, Chicago, Illinois 60607, USA
S. Horvat
Yale University, New Haven, Connecticut 06520, USA
B. Huang
University of Science & Technology of China, Hefei 230026, China
H. Z. Huang
University of California, Los Angeles, California 90095, USA
T. J. Humanic
Ohio State University, Columbus, Ohio 43210, USA
L. Huo
Texas A&M University, College Station, Texas 77843, USA
G. Igo
University of California, Los Angeles, California 90095, USA
W. W. Jacobs
Indiana University, Bloomington, Indiana 47408, USA
C. Jena
Institute of Physics, Bhubaneswar 751005, India
P. G. Jones
University of Birmingham, Birmingham, United Kingdom
J. Joseph
Kent State University, Kent, Ohio 44242, USA
E. G. Judd
University of California, Berkeley, California 94720, USA
S. Kabana
SUBATECH, Nantes, France
K. Kang
Tsinghua University, Beijing 100084, China
J. Kapitan
Nuclear Physics Institute AS CR, 250 68 Řež/Prague, Czech Republic
K. Kauder
University of Illinois at Chicago, Chicago, Illinois 60607, USA
H. W. Ke
Institute of Particle Physics, CCNU (HZNU), Wuhan 430079, China
D. Keane
Kent State University, Kent, Ohio 44242, USA
A. Kechechyan
Joint Institute for Nuclear Research, Dubna, 141 980, Russia
D. Kettler
University of Washington, Seattle, Washington 98195, USA
D. P. Kikola
Purdue University, West Lafayette, Indiana 47907, USA
J. Kiryluk
Lawrence Berkeley National Laboratory, Berkeley, California 94720, USA
A. Kisiel
Warsaw University of Technology, Warsaw, Poland
V. Kizka
Joint Institute for Nuclear Research, Dubna, 141 980, Russia
S. R. Klein
Lawrence Berkeley National Laboratory, Berkeley, California 94720, USA
D. D. Koetke
Valparaiso University, Valparaiso, Indiana 46383, USA
T. Kollegger
University of Frankfurt, Frankfurt, Germany
J. Konzer
Purdue University, West Lafayette, Indiana 47907, USA
I. Koralt
Old Dominion University, Norfolk, VA, 23529, USA
L. Koroleva
Alikhanov Institute for Theoretical and Experimental Physics, Moscow, Russia
W. Korsch
University of Kentucky, Lexington, Kentucky, 40506-0055, USA
L. Kotchenda
Moscow Engineering Physics Institute, Moscow Russia
P. Kravtsov
Moscow Engineering Physics Institute, Moscow Russia
K. Krueger
Argonne National Laboratory, Argonne, Illinois 60439, USA
L. Kumar
Kent State University, Kent, Ohio 44242, USA
M. A. C. Lamont
Brookhaven National Laboratory, Upton, New York 11973, USA
J. M. Landgraf
Brookhaven National Laboratory, Upton, New York 11973, USA
S. LaPointe
Wayne State University, Detroit, Michigan 48201, USA
J. Lauret
Brookhaven National Laboratory, Upton, New York 11973, USA
A. Lebedev
Brookhaven National Laboratory, Upton, New York 11973, USA
R. Lednicky
Joint Institute for Nuclear Research, Dubna, 141 980, Russia
J. H. Lee
Brookhaven National Laboratory, Upton, New York 11973, USA
W. Leight
Massachusetts Institute of Technology, Cambridge, MA 02139-4307, USA
M. J. LeVine
Brookhaven National Laboratory, Upton, New York 11973, USA
C. Li
University of Science & Technology of China, Hefei 230026, China
L. Li
University of Texas, Austin, Texas 78712, USA
W. Li
Shanghai Institute of Applied Physics, Shanghai 201800, China
X. Li
Purdue University, West Lafayette, Indiana 47907, USA
X. Li
Shandong University, Jinan, Shandong 250100, China
Y. Li
Tsinghua University, Beijing 100084, China
Z. M. Li
Institute of Particle Physics, CCNU (HZNU), Wuhan 430079, China
L. M. Lima
Universidade de Sao Paulo, Sao Paulo, Brazil
M. A. Lisa
Ohio State University, Columbus, Ohio 43210, USA
F. Liu
Institute of Particle Physics, CCNU (HZNU), Wuhan 430079, China
T. Ljubicic
Brookhaven National Laboratory, Upton, New York 11973, USA
W. J. Llope
Rice University, Houston, Texas 77251, USA
R. S. Longacre
Brookhaven National Laboratory, Upton, New York 11973, USA
Y. Lu
University of Science & Technology of China, Hefei 230026, China
E. V. Lukashov
Moscow Engineering Physics Institute, Moscow Russia
X. Luo
University of Science & Technology of China, Hefei 230026, China
G. L. Ma
Shanghai Institute of Applied Physics, Shanghai 201800, China
Y. G. Ma
Shanghai Institute of Applied Physics, Shanghai 201800, China
D. P. Mahapatra
Institute of Physics, Bhubaneswar 751005, India
R. Majka
Yale University, New Haven, Connecticut 06520, USA
O. I. Mall
University of California, Davis, California 95616, USA
S. Margetis
Kent State University, Kent, Ohio 44242, USA
C. Markert
University of Texas, Austin, Texas 78712, USA
H. Masui
Lawrence Berkeley National Laboratory, Berkeley, California 94720, USA
H. S. Matis
Lawrence Berkeley National Laboratory, Berkeley, California 94720, USA
D. McDonald
Rice University, Houston, Texas 77251, USA
T. S. McShane
Creighton University, Omaha, Nebraska 68178, USA
N. G. Minaev
Institute of High Energy Physics, Protvino, Russia
S. Mioduszewski
Texas A&M University, College Station, Texas 77843, USA
M. K. Mitrovski
Brookhaven National Laboratory, Upton, New York 11973, USA
Y. Mohammed
Texas A&M University, College Station, Texas 77843, USA
B. Mohanty
Variable Energy Cyclotron Centre, Kolkata 700064, India
M. M. Mondal
Variable Energy Cyclotron Centre, Kolkata 700064, India
B. Morozov
Alikhanov Institute for Theoretical and Experimental Physics, Moscow, Russia
D. A. Morozov
Institute of High Energy Physics, Protvino, Russia
M. G. Munhoz
Universidade de Sao Paulo, Sao Paulo, Brazil
M. K. Mustafa
Purdue University, West Lafayette, Indiana 47907, USA
M. Naglis
Lawrence Berkeley National Laboratory, Berkeley, California 94720, USA
B. K. Nandi
Indian Institute of Technology, Mumbai, India
C. Nattrass
Yale University, New Haven, Connecticut 06520, USA
Md. Nasim
Variable Energy Cyclotron Centre, Kolkata 700064, India
T. K. Nayak
Variable Energy Cyclotron Centre, Kolkata 700064, India
L. V. Nogach
Institute of High Energy Physics, Protvino, Russia
S. B. Nurushev
Institute of High Energy Physics, Protvino, Russia
G. Odyniec
Lawrence Berkeley National Laboratory, Berkeley, California 94720, USA
A. Ogawa
Brookhaven National Laboratory, Upton, New York 11973, USA
K. Oh
Pusan National University, Pusan, Republic of Korea
A. Ohlson
Yale University, New Haven, Connecticut 06520, USA
V. Okorokov
Moscow Engineering Physics Institute, Moscow Russia
E. W. Oldag
University of Texas, Austin, Texas 78712, USA
R. A. N. Oliveira
Universidade de Sao Paulo, Sao Paulo, Brazil
D. Olson
Lawrence Berkeley National Laboratory, Berkeley, California 94720, USA
M. Pachr
Czech Technical University in Prague, FNSPE, Prague, 115 19, Czech Republic
B. S. Page
Indiana University, Bloomington, Indiana 47408, USA
S. K. Pal
Variable Energy Cyclotron Centre, Kolkata 700064, India
Pan
University of California, Los Angeles, California 90095, USA
Y. Pandit
Kent State University, Kent, Ohio 44242, USA
Y. Panebratsev
Joint Institute for Nuclear Research, Dubna, 141 980, Russia
T. Pawlak
Warsaw University of Technology, Warsaw, Poland
H. Pei
University of Illinois at Chicago, Chicago, Illinois 60607, USA
C. Perkins
University of California, Berkeley, California 94720, USA
W. Peryt
Warsaw University of Technology, Warsaw, Poland
P. Pile
Brookhaven National Laboratory, Upton, New York 11973, USA
M. Planinic
University of Zagreb, Zagreb, HR-10002, Croatia
J. Pluta
Warsaw University of Technology, Warsaw, Poland
D. Plyku
Old Dominion University, Norfolk, VA, 23529, USA
N. Poljak
University of Zagreb, Zagreb, HR-10002, Croatia
J. Porter
Lawrence Berkeley National Laboratory, Berkeley, California 94720, USA
A. M. Poskanzer
Lawrence Berkeley National Laboratory, Berkeley, California 94720, USA
C. B. Powell
Lawrence Berkeley National Laboratory, Berkeley, California 94720, USA
D. Prindle
University of Washington, Seattle, Washington 98195, USA
C. Pruneau
Wayne State University, Detroit, Michigan 48201, USA
N. K. Pruthi
Panjab University, Chandigarh 160014, India
P. R. Pujahari
Indian Institute of Technology, Mumbai, India
J. Putschke
Wayne State University, Detroit, Michigan 48201, USA
H. Qiu
Institute of Modern Physics, Lanzhou, China
R. Raniwala
University of Rajasthan, Jaipur 302004, India
S. Raniwala
University of Rajasthan, Jaipur 302004, India
R. L. Ray
University of Texas, Austin, Texas 78712, USA
R. Redwine
Massachusetts Institute of Technology, Cambridge, MA 02139-4307, USA
R. Reed
University of California, Davis, California 95616, USA
C. K. Riley
Yale University, New Haven, Connecticut 06520, USA
H. G. Ritter
Lawrence Berkeley National Laboratory, Berkeley, California 94720, USA
J. B. Roberts
Rice University, Houston, Texas 77251, USA
O. V. Rogachevskiy
Joint Institute for Nuclear Research, Dubna, 141 980, Russia
J. L. Romero
University of California, Davis, California 95616, USA
L. Ruan
Brookhaven National Laboratory, Upton, New York 11973, USA
J. Rusnak
Nuclear Physics Institute AS CR, 250 68 Řež/Prague, Czech Republic
N. R. Sahoo
Variable Energy Cyclotron Centre, Kolkata 700064, India
I. Sakrejda
Lawrence Berkeley National Laboratory, Berkeley, California 94720, USA
S. Salur
Lawrence Berkeley National Laboratory, Berkeley, California 94720, USA
J. Sandweiss
Yale University, New Haven, Connecticut 06520, USA
E. Sangaline
University of California, Davis, California 95616, USA
A. Sarkar
Indian Institute of Technology, Mumbai, India
J. Schambach
University of Texas, Austin, Texas 78712, USA
R. P. Scharenberg
Purdue University, West Lafayette, Indiana 47907, USA
A. M. Schmah
Lawrence Berkeley National Laboratory, Berkeley, California 94720, USA
N. Schmitz
Max-Planck-Institut für Physik, Munich, Germany
T. R. Schuster
University of Frankfurt, Frankfurt, Germany
J. Seele
Massachusetts Institute of Technology, Cambridge, MA 02139-4307, USA
J. Seger
Creighton University, Omaha, Nebraska 68178, USA
P. Seyboth
Max-Planck-Institut für Physik, Munich, Germany
N. Shah
University of California, Los Angeles, California 90095, USA
E. Shahaliev
Joint Institute for Nuclear Research, Dubna, 141 980, Russia
M. Shao
University of Science & Technology of China, Hefei 230026, China
B. Sharma
Panjab University, Chandigarh 160014, India
M. Sharma
Wayne State University, Detroit, Michigan 48201, USA
S. S. Shi
Institute of Particle Physics, CCNU (HZNU), Wuhan 430079, China
Q. Y. Shou
Shanghai Institute of Applied Physics, Shanghai 201800, China
E. P. Sichtermann
Lawrence Berkeley National Laboratory, Berkeley, California 94720, USA
R. N. Singaraju
Variable Energy Cyclotron Centre, Kolkata 700064, India
M. J. Skoby
Purdue University, West Lafayette, Indiana 47907, USA
N. Smirnov
Yale University, New Haven, Connecticut 06520, USA
D. Solanki
University of Rajasthan, Jaipur 302004, India
P. Sorensen
Brookhaven National Laboratory, Upton, New York 11973, USA
U. G. deSouza
Universidade de Sao Paulo, Sao Paulo, Brazil
H. M. Spinka
Argonne National Laboratory, Argonne, Illinois 60439, USA
B. Srivastava
Purdue University, West Lafayette, Indiana 47907, USA
T. D. S. Stanislaus
Valparaiso University, Valparaiso, Indiana 46383, USA
S. G. Steadman
Massachusetts Institute of Technology, Cambridge, MA 02139-4307, USA
J. R. Stevens
Indiana University, Bloomington, Indiana 47408, USA
R. Stock
University of Frankfurt, Frankfurt, Germany
M. Strikhanov
Moscow Engineering Physics Institute, Moscow Russia
B. Stringfellow
Purdue University, West Lafayette, Indiana 47907, USA
A. A. P. Suaide
Universidade de Sao Paulo, Sao Paulo, Brazil
M. C. Suarez
University of Illinois at Chicago, Chicago, Illinois 60607, USA
M. Sumbera
Nuclear Physics Institute AS CR, 250 68 Řež/Prague, Czech Republic
X. M. Sun
Lawrence Berkeley National Laboratory, Berkeley, California 94720, USA
Y. Sun
University of Science & Technology of China, Hefei 230026, China
Z. Sun
Institute of Modern Physics, Lanzhou, China
B. Surrow
Massachusetts Institute of Technology, Cambridge, MA 02139-4307, USA
D. N. Svirida
Alikhanov Institute for Theoretical and Experimental Physics, Moscow, Russia
T. J. M. Symons
Lawrence Berkeley National Laboratory, Berkeley, California 94720, USA
A. Szanto de Toledo
Universidade de Sao Paulo, Sao Paulo, Brazil
J. Takahashi
Universidade Estadual de Campinas, Sao Paulo, Brazil
A. H. Tang
Brookhaven National Laboratory, Upton, New York 11973, USA
Z. Tang
University of Science & Technology of China, Hefei 230026, China
L. H. Tarini
Wayne State University, Detroit, Michigan 48201, USA
T. Tarnowsky
Michigan State University, East Lansing, Michigan 48824, USA
D. Thein
University of Texas, Austin, Texas 78712, USA
J. H. Thomas
Lawrence Berkeley National Laboratory, Berkeley, California 94720, USA
J. Tian
Shanghai Institute of Applied Physics, Shanghai 201800, China
A. R. Timmins
University of Houston, Houston, TX, 77204, USA
D. Tlusty
Nuclear Physics Institute AS CR, 250 68 Řež/Prague, Czech Republic
M. Tokarev
Joint Institute for Nuclear Research, Dubna, 141 980, Russia
S. Trentalange
University of California, Los Angeles, California 90095, USA
R. E. Tribble
Texas A&M University, College Station, Texas 77843, USA
P. Tribedy
Variable Energy Cyclotron Centre, Kolkata 700064, India
B. A. Trzeciak
Warsaw University of Technology, Warsaw, Poland
O. D. Tsai
University of California, Los Angeles, California 90095, USA
T. Ullrich
Brookhaven National Laboratory, Upton, New York 11973, USA
D. G. Underwood
Argonne National Laboratory, Argonne, Illinois 60439, USA
G. Van Buren
Brookhaven National Laboratory, Upton, New York 11973, USA
G. van Nieuwenhuizen
Massachusetts Institute of Technology, Cambridge, MA 02139-4307, USA
J. A. Vanfossen, Jr
Kent State University, Kent, Ohio 44242, USA
R. Varma
Indian Institute of Technology, Mumbai, India
G. M. S. Vasconcelos
Universidade Estadual de Campinas, Sao Paulo, Brazil
A. N. Vasiliev
Institute of High Energy Physics, Protvino, Russia
F. Videbæk
Brookhaven National Laboratory, Upton, New York 11973, USA
Y. P. Viyogi
Variable Energy Cyclotron Centre, Kolkata 700064, India
S. Vokal
Joint Institute for Nuclear Research, Dubna, 141 980, Russia
S. A. Voloshin
Wayne State University, Detroit, Michigan 48201, USA
A. Vossen
Indiana University, Bloomington, Indiana 47408, USA
M. Wada
University of Texas, Austin, Texas 78712, USA
G. Wang
University of California, Los Angeles, California 90095, USA
H. Wang
Michigan State University, East Lansing, Michigan 48824, USA
J. S. Wang
Institute of Modern Physics, Lanzhou, China
Q. Wang
Purdue University, West Lafayette, Indiana 47907, USA
X. L. Wang
University of Science & Technology of China, Hefei 230026, China
Y. Wang
Tsinghua University, Beijing 100084, China
G. Webb
University of Kentucky, Lexington, Kentucky, 40506-0055, USA
J. C. Webb
Brookhaven National Laboratory, Upton, New York 11973, USA
G. D. Westfall
Michigan State University, East Lansing, Michigan 48824, USA
C. Whitten Jr
University of California, Los Angeles, California 90095, USA
H. Wieman
Lawrence Berkeley National Laboratory, Berkeley, California 94720, USA
S. W. Wissink
Indiana University, Bloomington, Indiana 47408, USA
R. Witt
United States Naval Academy, Annapolis, MD 21402, USA
W. Witzke
University of Kentucky, Lexington, Kentucky, 40506-0055, USA
Y. F. Wu
Institute of Particle Physics, CCNU (HZNU), Wuhan 430079, China
Z. Xiao
Tsinghua University, Beijing 100084, China
W. Xie
Purdue University, West Lafayette, Indiana 47907, USA
H. Xu
Institute of Modern Physics, Lanzhou, China
N. Xu
Lawrence Berkeley National Laboratory, Berkeley, California 94720, USA
Q. H. Xu
Shandong University, Jinan, Shandong 250100, China
W. Xu
University of California, Los Angeles, California 90095, USA
Y. Xu
University of Science & Technology of China, Hefei 230026, China
Z. Xu
Brookhaven National Laboratory, Upton, New York 11973, USA
L. Xue
Shanghai Institute of Applied Physics, Shanghai 201800, China
Y. Yang
Institute of Modern Physics, Lanzhou, China
Y. Yang
Institute of Particle Physics, CCNU (HZNU), Wuhan 430079, China
P. Yepes
Rice University, Houston, Texas 77251, USA
Y. Yi
Purdue University, West Lafayette, Indiana 47907, USA
K. Yip
Brookhaven National Laboratory, Upton, New York 11973, USA
I-K. Yoo
Pusan National University, Pusan, Republic of Korea
M. Zawisza
Warsaw University of Technology, Warsaw, Poland
H. Zbroszczyk
Warsaw University of Technology, Warsaw, Poland
W. Zhan
Institute of Modern Physics, Lanzhou, China
J. B. Zhang
Institute of Particle Physics, CCNU (HZNU), Wuhan 430079, China
S. Zhang
Shanghai Institute of Applied Physics, Shanghai 201800, China
W. M. Zhang
Kent State University, Kent, Ohio 44242, USA
X. P. Zhang
Tsinghua University, Beijing 100084, China
Y. Zhang
University of Science & Technology of China, Hefei 230026, China
Z. P. Zhang
University of Science & Technology of China, Hefei 230026, China
F. Zhao
University of California, Los Angeles, California 90095, USA
J. Zhao
Shanghai Institute of Applied Physics, Shanghai 201800, China
C. Zhong
Shanghai Institute of Applied Physics, Shanghai 201800, China
X. Zhu
Tsinghua University, Beijing 100084, China
Y. H. Zhu
Shanghai Institute of Applied Physics, Shanghai 201800, China
Y. Zoulkarneeva
Joint Institute for Nuclear Research, Dubna, 141 980, Russia
Abstract
Two-particle azimuthal () and pseudorapidity () correlations using a trigger particle with large transverse momentum () in +Au, Cu+Cu and Au+Au collisions at = 62.4 GeV and 200 GeV from the STAR experiment at RHIC are presented. The near-side correlation is separated into a jet-like component, narrow in both and , and the ridge, narrow in but broad in . Both components are studied as a function of collision centrality, and the jet-like correlation is studied as a function of the trigger and associated . The behavior of the jet-like component is remarkably consistent for different collision systems, suggesting it is produced by fragmentation. The width of the jet-like correlation is found to increase with the system size. The ridge, previously observed in Au+Au collisions at = 200 GeV, is also found in Cu+Cu collisions and in collisions at = 62.4 GeV, but is found to be substantially smaller at = 62.4 GeV than at = 200 GeV for the same average number of participants ().
Measurements of the ridge are compared to models.
pacs:
25.75.-q,21.65.Qr,24.85.+p,25.75.Bh
I Introduction
Jets are a useful probe of the hot, dense medium created in heavy-ion collisions at the Relativistic Heavy Ion Collider (RHIC) at Brookhaven National Laboratory (BNL).
Jet quenching Wang and Gyulassy (1992) was first observed as the suppression of inclusive hadron spectra at large transverse momenta () in central Au+Au collisions with respect to + data scaled by number of binary nucleon-nucleon collisions Adler et al. (2002); Adcox et al. (2002, 2003); Adler et al. (2003a); Back et al. (2004); Adams et al. (2003a). Properties of jets at RHIC have been studied extensively using di-hadron correlations relative to a trigger particle with large transverse momentum Adams et al. (2005a); Abelev
et al. (2009a); Adler
et al. (2003b); Adams et al. (2006a); Abelev et al. (2009b, 2010a); Agakishiev et al. (2010).
Systematic studies of associated particle distributions on the opposite side of the trigger particle revealed their significant modification in Au+Au relative to + and +Au collisions at the top RHIC energy of = 200 GeV. For low , the amplitude of the away-side peak is greater and the shape is modified in Au+Au collisions Adams et al. (2005a); Abelev
et al. (2009a). At intermediate (4 6 GeV/, 2 GeV/ ), the away-side correlation peak is strongly suppressed Adler
et al. (2003b). At higher , the away-side peak reappears without shape modification, but the away-side per trigger yield is smaller in Au+Au collisions than in + and +Au Adams et al. (2006a).
The associated particle distribution on the near side of the trigger particle, the subject of this paper, is also significantly modified in central Au+Au collisions. In + and +Au collisions, there is a peak narrow in azimuth () and pseudorapidity () around the trigger particle, which we refer to as the jet-like correlation. This peak is also present in Au+Au collisons, but an additional structure which is narrow in azimuth but broad in pseudorapidity has been observed in central Au+Au collisions at = 200 GeV Adams et al. (2005a); Abelev et al. (2009b, 2010a); Agakishiev et al. (2010). This structure, called the ridge, is independent of within the STAR acceptance, 2.0, within errors, and persists to high ( 6 GeV/, 3 GeV/).
While the spectrum of particles in the jet-like correlation becomes flatter with increasing , the slope of the spectrum of particles in the ridge is independent of and closer to the inclusive spectrum than to that of the jet-like correlation.
Recent studies of di-hadron correlations at lower transverse momenta ( 2.5 GeV/c, 20 MeV/c) by the PHOBOS experiment show that the ridge is roughly independent of and extends over four units in Alver et al. (2010a). A similar broad correlation in pseudorapidity is also evident in complementary studies of minijets using untriggered di-hadron correlations Adams et al. (2006b); Agakishiev et al. (2011).
Several mechanisms for the production of the ridge have been proposed since the first observation of this new phenomenon. In one model Armesto et al. (2004) the ridge is proposed to be formed from gluon radiation emitted by a high- parton propagating in the medium with strong longitudinal flow.
The momentum-kick model proposes that the ridge forms as a fast parton traveling through the medium loses energy through collisions with partons in the medium, causing those partons to be correlated in space with the fast parton Wong (2008); Cheuk-Yin (2008); Wong (2007). Parton recombination has been also proposed as a mechanism for the production of the ridge Hwa and Yang (2009); Chiu et al. (2008); Chiu and Hwa (2009). Another model Voloshin (2006); Pruneau et al. (2008) suggests that the ridge is not actually caused by a hard parton but is the product of radial flow and the surface biased emission of the trigger particle, causing an apparent correlation between particles from the bulk and high- trigger particles.
Another class of models is based on the conversion of correlations in the initial state into momentum space through various flow effects. The model in Majumder et al. (2007) explains the ridge as arising from the spontaneous formation of extended color fields in a longitudinally expanding medium due to the presence of plasma instabilities. Long-range pseudorapidity correlations formed in an initial state glasma combined with radial flow have been also discussed as a mechanism for the ridge Dumitru et al. (2008); Gelis et al. (2009); Gavin et al. (2009).
Recently, it has been suggested that triangular anisotropy in the initial collision geometry caused by event-by-event fluctuations can give rise to triangular flow, which leads to the ridge and contributes to the double peaked away-side observed in heavy-ion collisions at RHIC Mishra et al. (2008); Sorensen (2010); Takahashi et al. (2009); Alver and Roland (2010a); Alver and
Roland (2010b); Alver et al. (2010b); Holopainen et al. (2011).
In this paper we present measurements of the system size and collision energy dependence of near-side di-hadron correlations using data from Cu+Cu and Au+Au collisions at = 62.4 GeV and = 200 GeV measured by the STAR experiment at RHIC.
In particular, we investigate the centrality dependence of the jet-like correlations and the ridge and the transverse momentum dependence of the jet-like correlations. The properties of jet-like correlations in heavy-ion collisions are compared to those from +Au collisions and PYTHIA simulations to look for possible medium modifications and broadening of the near-side jet-like correlation, for example, due to gluon bremsstrahlung Armesto et al. (2004).
The new results on the system size and energy dependence of the ridge yield presented in this article extend our knowledge of this phenomenon and, in combination with other measurements at RHIC, provide important quantitative input and constraints to model calculations.
II Experimental setup and data sample
The results presented in this paper are based on data measured by the STAR experiment from +Au collisions at = 200 GeV in 2003, Au+Au collisions at = 62.4 GeV and 200 GeV in 2004, and Cu+Cu collisions at = 62.4 GeV and 200 GeV in 2005. The +Au events were selected using a minimally biased (MB) trigger requiring at least one beam-rapidity neutron in the Zero Degree Calorimeter (ZDC), located at 18 m from the nominal interaction point in the Au beam direction, accepting 953% of the Au+Au hadronic cross section Adams et al. (2003b). For Cu+Cu collisions, the MB trigger was based on the combined signals from the Beam-Beam Counters (BBC) at forward rapidity (3.3 5.0) and a coincidence between the ZDCs. The MB trigger for Au+Au collisions at = 62.4 GeV and 200 GeV was obtained using a ZDC coincidence, a signal in both BBCs and a minimum charged particle multiplicity in an array of scintillator slats arranged in a barrel, the Central Trigger Barrel (CTB), to reject non-hadronic interactions.
Table 1: Number of events after cuts (see text) in the data samples analyzed.
System
Centrality
[GeV]
No. of events [106]
Cu+Cu
0-60%
62.4
24
Au+Au
0-80%
62.4
8
+Au
0-95%
200
3
Cu+Cu
0-60%
200
38
Au+Au
0-80%
200
28
Au+Au
0-12%
200
17
For Au+Au collisions at = 200 GeV, an additional online trigger for central collisions was used.
This trigger was based on the energy deposited in the ZDCs in combination with the multiplicity in the CTB.
The central trigger sampled the most central 12% of the total hadronic cross section.
In order to achieve a more uniform detector acceptance, only those events with the primary vertex position along the longitudinal beam direction () within 30 cm
of the center of the STAR detector were used for the analysis. For the +Au collisions this was expanded to 50 cm.
The number of events after the vertex cut in individual data samples is summarized in Table 1.
The STAR Time Projection Chamber (TPC) Ackermann et al. (2003) was used for tracking of charged particles. The collision centrality was determined from the uncorrected number of charged tracks at mid-rapidity ( 0.5) in the TPC. The charged tracks used for the centrality determination had a three dimensional distance of closest approach (DCA) to the primary vertex of less than 3 cm and at least 10 fit points from the TPC. Each data sample was then divided into several centrality bins, and the fraction of the geometric cross section, the average number of participating nucleons () and the average number of binary collisions () were calculated using Glauber Monte-Carlo model calculations Miller et al. (2007).
III Data Analysis
III.1 Correlation technique
Tracks used in this analysis were required to have at least 15 fit points in the TPC,
a DCA to the primary vertex of less than 1 cm, and a pseudorapidity 1.0. As in previous di-hadron correlation studies in the STAR experiment Abelev et al. (2009b, 2010b); Aggarwal et al. (2010), a high- trigger particle was selected and the raw distribution of associated tracks relative to that trigger in pseudorapidity () and azimuth () is studied. This distribution, , is normalized by the number of trigger particles, , and corrected for the efficiency and acceptance of associated tracks :
(1)
The efficiency correction is a correction for the TPC single charged track reconstruction efficiency and is a correction for track merging and finite TPC track-pair acceptance in and as described in detail below. The data presented in this paper are averaged between positive and negative and regions and are reflected about =0 and =0 in the plots.
III.2 Single charged track efficiency correction
The single charged track reconstruction efficiency in the TPC is determined by simulating the detector response to a charged particle and embedding these signals into a real event.
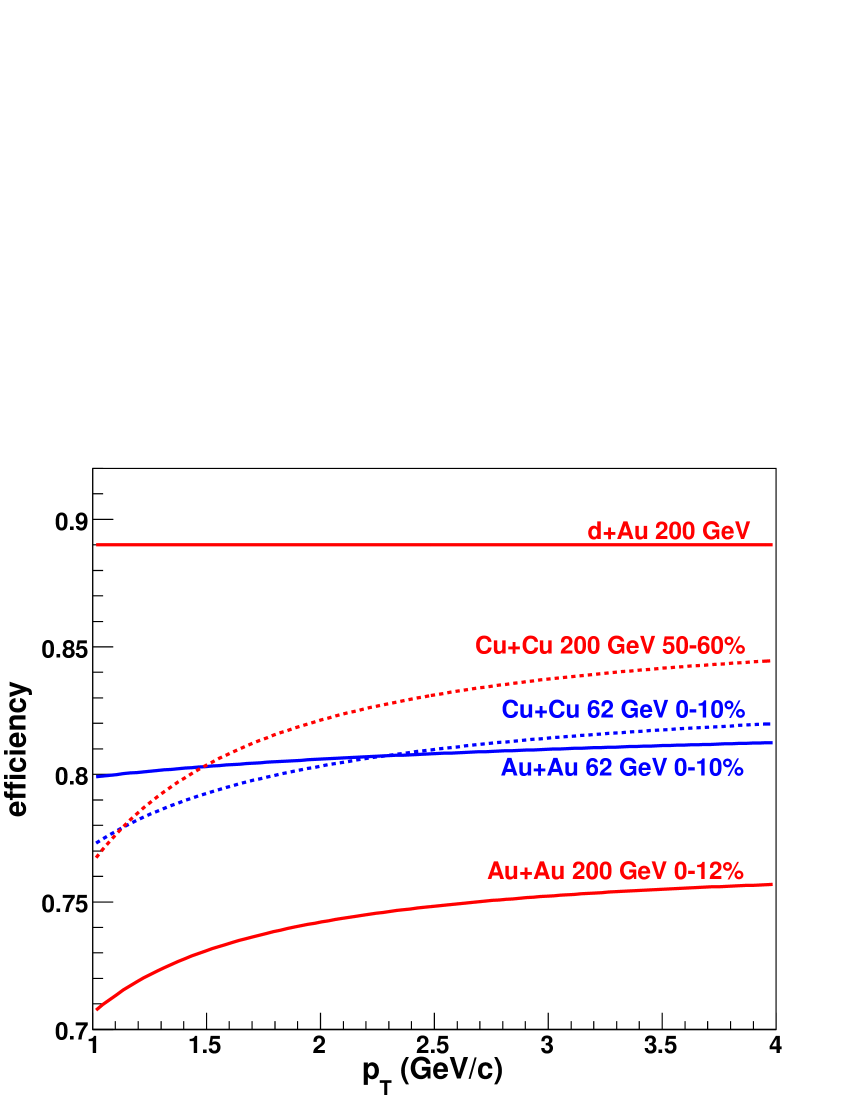
This hybrid event is analyzed using the same software as for the real events. The efficiency for detecting a single track as a function of , , and centrality is determined from the number of simulated particles which were successfully reconstructed. The single track efficiency is approximately constant for 2 GeV/ and ranges from around 75% for central Au+Au events to around 85% for peripheral Cu+Cu events as shown in Figure 1. The efficiency for reconstructing a track in +Au is 89%. The systematic uncertainty on the efficiency correction, 5%, is strongly correlated across centralities and bins for each data set but not between data sets. In the correlations, each track pair is corrected for the efficiency for reconstructing the associated particle. Since the correlations are normalized by the number of trigger particles, no correction for the efficiency of the trigger particle is necessary.
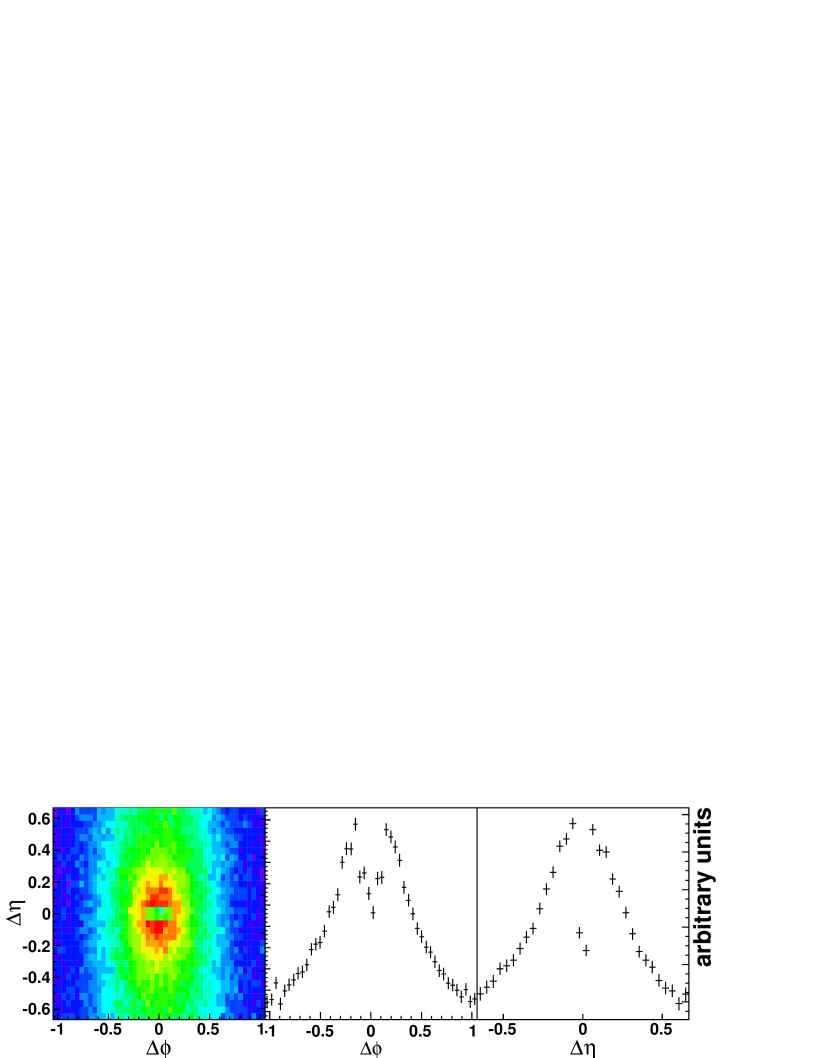
Figure 1: (Color online) Parameterizations of the transverse momentum dependence of the reconstruction efficiency of charged particles in the TPC in various collision systems, energies and centrality bins for the track selection cuts used in this analysis. Note the zero suppression of the axes.Figure 2: (Color online) Two-particle di-hadron correlation function in (, ) for GeV/ and GeV/ in 0-12% central Au+Au collisions at = 200 GeV, not corrected for track merging (left). The projection of the correlation function in for 0.042 is shown in the middle and the projection in for 0.17 on the right.
III.3 Corrections for track merging and track crossing effects in the TPC
The reconstruction of charged tracks from TPC hits is performed iteratively, with hits removed from the event once they are assigned to a track. If two tracks have small angular separation in both pseudorapidity and azimuth, they are more difficult to reconstruct because distinct hits from each particle may not be resolved by the TPC.
If two particles are close in momenta or have sufficiently high that their tracks are nearly straight, they may not be distinguished.
This effect, called track merging, reduces the number of pairs observed at small opening angles and results in an artificial dip in the raw correlations centered at () = (0,0).
Figure 2 shows an example of a (, ) two-particle di-hadron correlation function in central Au+Au collisions at = 200 GeV, along with the corresponding and projections for GeV/ and GeV/ . For small angular separations, a clear dip in the raw correlations is visible and must be corrected for in order to extract the yield of associated particles on the near side.
Another similar effect is evident in the active TPC volume from high- tracks which cross. While few hits are lost in this case, one track may lose hits near the crossing point and therefore be split into two shorter tracks. Shorter tracks are less likely to meet the track selection criteria. Track merging and track crossing cause four dips near () = (0,0) but slightly displaced in . The location and width of these dips in is dependent on the relative helicities, , and the intervals of the trigger and associated particles. The helicity is given by
(2)
where is the charge of the particle and is the magnetic field. The dips for tracks of the same helicity are dominantly due to track merging and the dips for tracks of opposite helicities are dominantly due to track crossing.
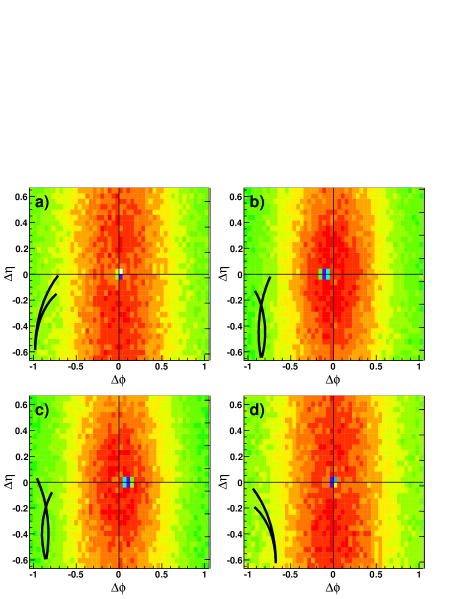
Figure 3 displays the correlation function from Figure 2 in four different helicity combinations of trigger and associated particles showing the finer substructure of the dip on the near side.
When the helicities of the trigger and associated particles are the same, the percentage
of overlapping hits is greater.
Because higher tracks have a smaller curvature, it is more likely for two high tracks close in azimuth and pseudorapidity to be merged than lower particles.
However, track pairs are lost whether the pair is part of the combinatorial background or part of the signal. This effect means that the magnitude of the dip is greater in central collisions where the background is greater and decreases with increasing because of the decreasing background.
Figure 3: (Color online) The dip region in (, ) uncorrected di-hadron correlations in 0-12% central Au+Au collisions at = 200 GeV for GeV/ and GeV/ in the four helicity combinations of trigger and associated particles: (a) () = (1,1),
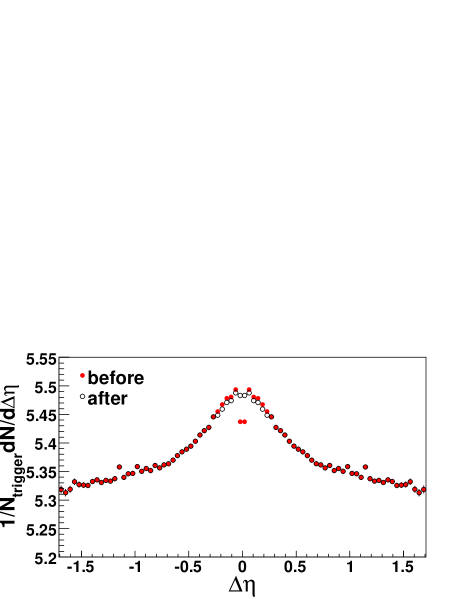
(b) () = (1,-1), (c) () = (-1,1), and (d) () = (-1,-1). Cartoons indicate which dips are from track merging and which are from track crossing.Figure 4: (Color online) The raw correlation in for di-hadron correlations for GeV/ and GeV/ for 0-12% central Au+Au collisions for 0.78 before and after the track merging correction is applied. The data have been reflected about =0.
One way to correct for the track merging effect is to remove pairs from mixed events that would have merged in real data.
The environment in mixed events must be similar to real data in order for pair rejection to be accurately
reproduced. The reference multiplicities of both events were required to be within 10 of each other to assure similar track density. In addition, mixed events were required to have vertices within 2 cm of each other along
the beam axis in order to ensure similar geometric acceptance to avoid a different dip shape in . In order to calculate accurately the percentage of merged hits, the origin of the associated track was shifted to the vertex of the event which the trigger particle originated from.
Previous analyses of low momentum tracks have shown that eliminating pairs from both data and mixed
events with a fraction of merged hits greater than 10% was sufficient to correct
for merging Adams et al. (2005b).
By discarding pairs with more than 10% shared hits we insure that the percentage of merged track pairs is the same in the data and the mixed events.
The correlation function for a given helicity combination of trigger and associated particles was corrected by mixed events. After this correction, a small residual dip
remains, mostly due to track crossing. While the mixed events correct for the dip due to true track merging well, they do not correct for track crossing as well. The remaining dip is then corrected for using the symmetry of the correlations. Since the data should be symmetric
about = 0, the data on the same side as the dip are discarded and replaced by
the data on the side without the dip. Then the data are reflected about = 0 and
added to the unreflected data to minimize statistical fluctuations.
This method is only applied to 1.05 and 0.67, the region shown in Figure 2, because it is computationally intensive and track merging and track crossing only affect small angular separations. For large and , the method described in the next section is applied. The track merging correction is done for each di-hadron correlation function separately with the appropriate cuts on , and collision centrality. An example of the di-hadron correlation function before and after the track merging correction is shown in Figure 4. The slight decrease in the correlation function for some data points is an artifact of the correction procedure and reflects the uncertainty in the correction.
III.4 Pair acceptance correction
With the restriction that each track falls within , there is a limited acceptance for track pairs. For , the geometric acceptance of the TPC for track pairs is 100%, however, near the acceptance is close to 0%. In azimuth the acceptance is limited by the 12 TPC sector boundaries, leading to dips in the acceptance of track pairs in azimuth. To correct for the geometric acceptance, the distribution of tracks as a function of and was recorded for both trigger and associated particles. A random and was chosen from each of these distributions to reconstruct a random and for each selection of , , and centrality. This was done for at least four times as many track pairs as in the data and was used to calculate the geometrical acceptance correction for pairs.
III.5 Subtraction of anisotropic elliptic flow background
Correlations of particles with the event plane due to anisotropic flow () in heavy-ion collisions are indirectly reflected in di-hadron correlations and have to be subtracted for studies of the ridge. This background in over the interval is approximated by
(3)
where is chosen to be 0.78 so that the majority of the signal is contained Abelev et al. (2009b, 2010b).
The level of the background is determined using the Zero Yield At Minimum (ZYAM) method Adams et al. (2005a). The level of the background is taken as the value of the minimum bin. The systematic errors due to the choice of the minimum bin rather than either of the two neighboring bins are negligible compared to the systematic errors due to the magnitude of , discussed below.
The ZYAM method is commonly used for di-hadron correlations at RHIC, for example Adams et al. (2006a, 2005a); Adare et al. (2008), and is justified if the near- and away-side peaks are separated by a ’signal-free’ region. At lower transverse momenta ( 2 GeV/c) and in central Au+Au collisions at = 200 GeV the broadening of the away-side correlation peak may cause overlap of the near- and away-side peaks and consequently makes the ZYAM normalization procedure biased. Alternatively, a decomposition of the correlation function using a fit function containing the anisotropic flow modulation of the combinatorial background and components describing the shape of the correlation peaks could be used as well Adams et al. (2007); Trainor (2010). In this paper we use the ZYAM prescription to remain consistent with our earlier measurements of the near-side ridge Abelev et al. (2009b). ZYAM used with conservative bounds on will, if anything, underestimate the ridge yield.
For all collision systems and energies studied, the uncertainty bounds on were determined by comparing different methods for the measurement. We assume that the error on the of the trigger and associated particles is 100% correlated. Event plane measurements of flow and two-particle measurements such as the two-particle cumulant method are sensitive to non-flow from sources such as jets. These methods may overestimate . Methods such as the four-particle cumulant method are less sensitive to contributions from jets, however, these methods may over-subtract contributions from event-by-event fluctuations in . Therefore these methods underestimate the that should be used for the background subtraction in di-hadron correlations Voloshin et al. (2010). For each system at least one measurement which may overestimate and at least one measurement which may underestimate is included. and systematic errors on for Au+Au collisions at = 62.4 GeV are from comparisons of the event plane method using the forward TPCs for the event plane determination and the four particle cumulant method Abelev et al. (2007a). The and systematic errors on for Au+Au collisions at = 200 GeV are as described in Abelev et al. (2009b). The upper bound on is from the event plane method using the forward TPCs for the determination of the event plane, the lower bound comes from the four particle cumulant method, and the average of the two is the nominal value. for Cu+Cu collisions at = 62.4 GeV and 200 GeV is from Abelev et al. (2010c). The nominal value is given by from the event plane method using the forward TPCs for the determination of the event plane and the upper bound is from the statistical error for both = 62.4 GeV and 200 GeV. For Cu+Cu collisions measurements using the four particle cumulant method were not possible due to limited statistics. Instead, for Cu+Cu collisions at = 200 GeV the lower bound is determined by
the magnitude of the cos() term extracted from fits to + data,
scaling it by , and subtracting it from determined using the event plane method to estimate the maximum contribution from nonflow in Cu+Cu collisions. For Cu+Cu collisions at = 62.4 GeV the systematic error is assumed to be the same in Cu+Cu collisions at both energies.
With both methods for subtracting the ridge contribution to the jet-like yield described below, the systematic errors due to cancel out in the jet-like yield, assuming that is independent of in the TPC acceptance. This assumption is based on the measurements of as a function of Back et al. (2005a, b).
III.6 Yield extraction
To quantify the strength of the near-side correlation it is assumed that it can be decomposed into a jet-like component, narrow in both azimuth and pseudorapidity, and a ridge component which is independent of . This approach is consistent with the method in Abelev et al. (2009b). For the kinematic cuts applied to and , the jet-like correlation is contained within the cuts used in this analysis, and .
To study the jet-like correlation and the ridge quantitatively we adopt the notation from Abelev et al. (2009b), and introduce the projection of the di-hadron correlation function from Eq. (1) onto the axis:
(4)
and similarly on the axis:
(5)
To determine the jet-like yield of associated charged particles two methods are used. The first method is based on projections. Under the assumption that the jet-like yield is confined within 0.78, subtracting the projections:
(6)
removes both the elliptic flow and ridge contributions. Since the second projection is calculated in a larger window, it has to be scaled by a factor 0.78/1.0, the ratio of the width in the region containing the jet-like correlation, the ridge, and the background to the width of the region containing only the ridge and the background. This subtracts both the ridge and simultaneously since within errors both are independent of Back et al. (2005a, b); Abelev et al. (2009b); Alver et al. (2010a).
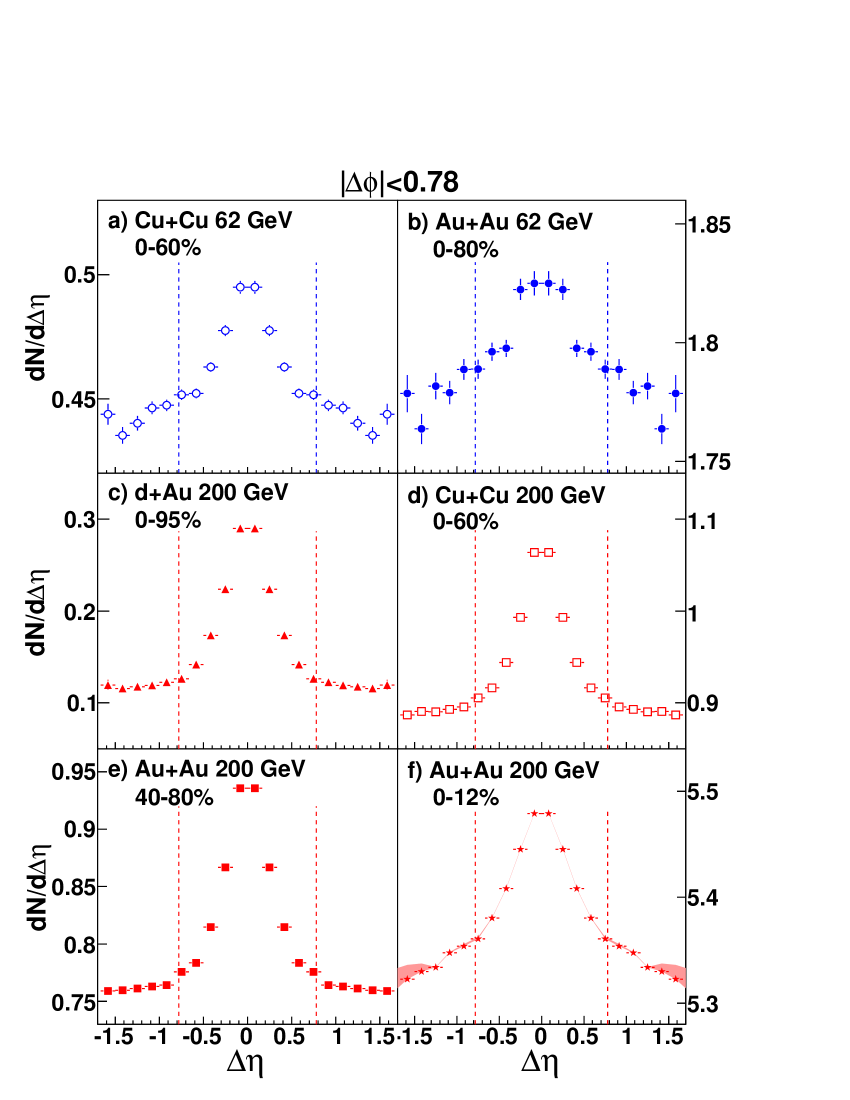
Figure 5: Color online) Sample correlations in ( 0.78) for GeV/ and GeV/ for (a) 0-60% Cu+Cu at = 62.4 GeV (b) 0-80% Au+Au at = 62.4 GeV, (c) 0-95% +Au at = 200 GeV, (d) 0-60% Cu+Cu at = 200 GeV, (e) 40-80% Au+Au at = 200 GeV, and (f) 0-12% central Au+Au at = 200 GeV. Lines show the range where the jet-like yield is determined. The data are averaged between positive and negative and reflected in the plot. Shaded lines in (f) show the systematic errors discussed in III.6.
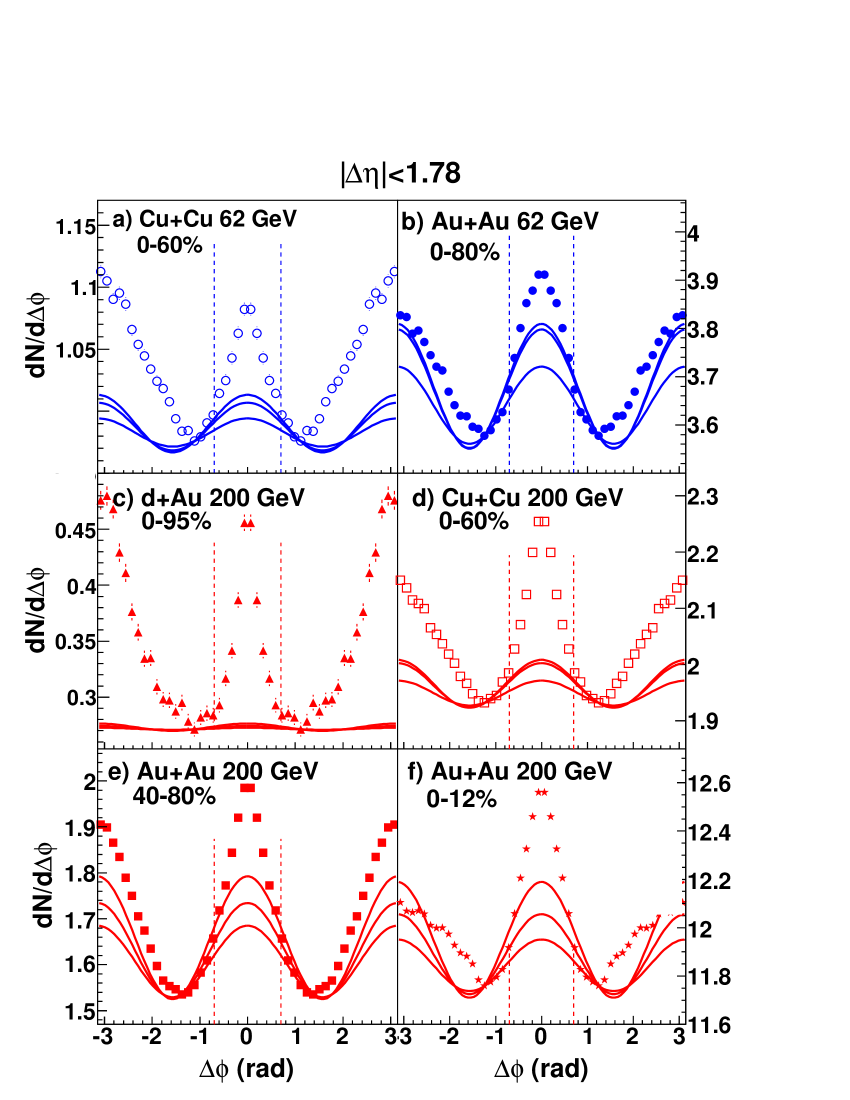
Figure 6: (Color online) Sample correlations in ( 1.78) for GeV/ and GeV/ for (a) 0-60% Cu+Cu at = 62.4 GeV (b) 0-80% Au+Au at = 62.4 GeV, (c) 0-95% +Au at = 200 GeV, (d) 0-60% Cu+Cu at = 200 GeV, (e) 40-80% Au+Au at = 200 GeV, and (f) 0-12% central Au+Au at = 200 GeV. Solid lines show the estimated background using the ZYAM method with the range of used for the determination of the systematic errors. The data are averaged between positive and negative and reflected in the plot. Vertical dashed lines show the range where the jet-like correlation is determined.
The jet-like yield is then obtained by integrating Eq.(6)
(7)
The second method for jet-like yield determination is based on the projection at the near-side:
(8)
as is independent of pseudo-rapidity within the STAR acceptance and therefore only leads to a constant offset included in . The background level is determined by fitting a constant background plus a Gaussian to .
The yield determined from fit is discarded to avoid any assumptions about the shape of the peak and instead we integrate
Eq. (8) over using bin counting to determine the jet-like yield :
(9)
The ridge yield is determined by first evaluating Eq. (5) over the entire region to get then subtracting the modulated elliptic flow background and the jet-like contribution :
(10)
We determined the systematic error on the due to uncertainty in the acceptance correction by comparing the mixed event method described in III.4 to the standard event mixing method and to a sample with a restricted vertex position. The largest difference was seen in the central Au+Au data at = 200 GeV. To be conservative this difference is used as the systematic error for all the data sets. The resulting systematic errors are listed in Table 2.
This error is also present for the ridge, since the ridge is determined by subtracting .
Additionally, the systematic error on due to the track merging correction does not exceed 1%, the maximum size of the correction in the kinematic region studied in this paper. This correction does not impact .
Table 2: Systematic uncertainties in the acceptance correction.
sys.error
sys. error
(GeV/)
(GeV/)
yield
Gaussian width
2.0-2.5
1.5
27%
10%
2.5-3.0
1.5
18%
6%
3.0-6.0
1.0
16%
6%
3.0-6.0
1.5
9%
6%
III.7 2D Fits
In addition to the standard ZYAM procedure, we also analyzed the distribution of particles in Eq. (1) using two-dimensional fits of the form:
(11)
with first four coefficients , , and of a Fourier expansion and a term accounting for the jet-like correlation on the near-side. This approach is motivated by the class of models for ridge production through a triangular initial condition. If non-flow contributions are negligible, corresponds to the average of the product of the trigger particle and the associated particle and corresponds to the average of the product of the trigger particle and the associated particle . We use Eq. (11) to fit the data and extract for all collision energies and systems. We allow to be negative. A narrow roughly Gaussian away-side peak at , which could arise from correlations from the production of an away-side jet, would have a negative contribution to and a negative could indicate that flow is not the dominant production mechanism for these correlations.
Furthermore, is not constrained to the experimental values measured for through other means.There is no systematic error on due to the efficiency because any uncertainty in the efficiency would change the magnitude of the modulations, given by A in Eq. (11), but not the relative size of those modulations, and . The uncertainty due to the fit and uncertainty in the acceptance correction is determined by fixing the parameters within the range given in Table 2. This gives an uncertainty of 4% on .
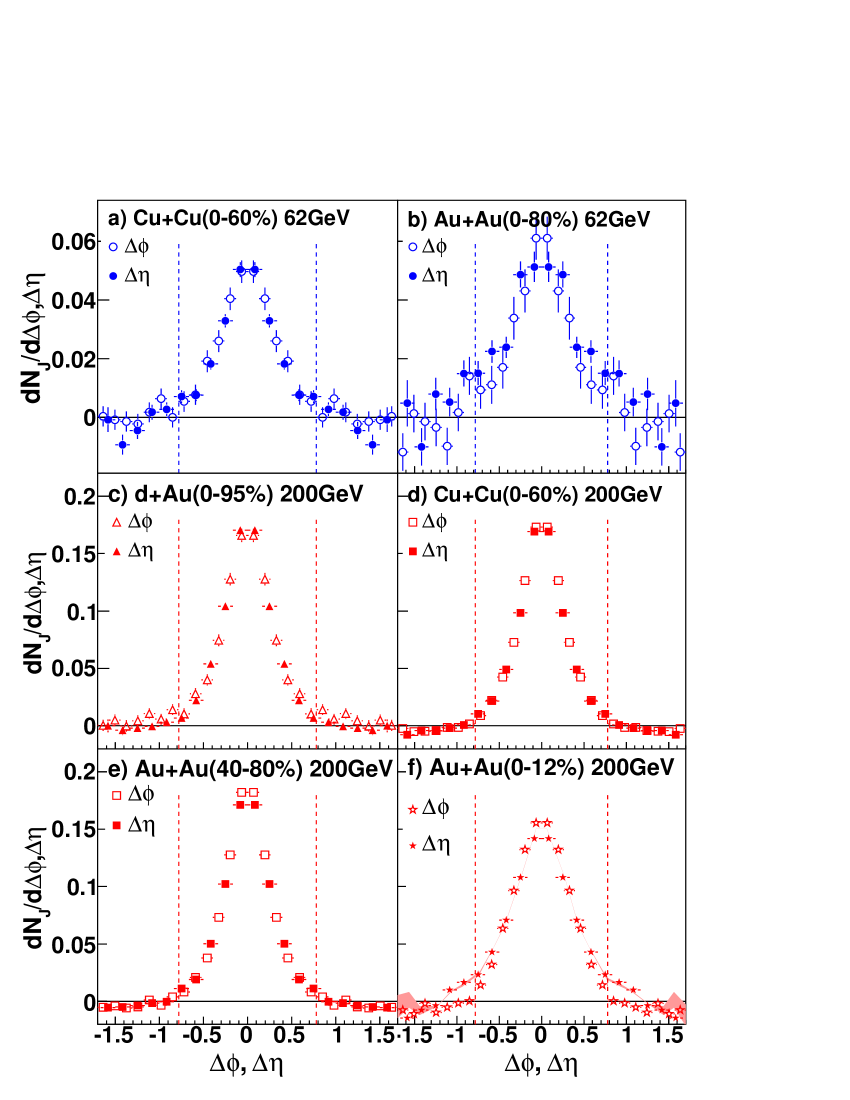
Figure 7: (Color online) Background subtracted sample correlations for GeV/ and GeV/ on the near-side for (a) 0-60% Cu+Cu at = 62.4 GeV, (b) 0-80% Au+Au at = 62.4 GeV, (c) 0-95% +Au collisions at = 200 GeV, (d) 0-60% Cu+Cu at = 200 GeV, (e) 40-80% Au+Au at = 200 GeV and (f) 0-12% central Au+Au at = 200 GeV. The dependence of the jet-like correlation is shown as a function of ( 1.78) in open symbols and of ( 0.78) in closed symbols. Lines show the and ranges where the jet-like yield is determined. The data are averaged between positive and negative () and reflected in the plot. Lines in (f) show the systematic errors on discussed in III.6.
IV Results
IV.1 Sample Correlations
Figure 5 shows fully corrected projections of sample correlations on the near side ( 0.78) before background subtraction for +Au, Cu+Cu and Au+Au collisions at energy = 62.4 GeV and = 200 GeV. The trigger particles were selected with transverse momentum GeV/ and the associated particles with GeV/ . The data show a clear jet-like peak sitting on top of the background and the ridge. The level of the background is increasing with energy and system size as expected, as more bulk particles are produced in the collision.
Examples of the complementary projections in before background subtraction for ( 1.78) are shown in Figure 6. The elliptic flow modulated background is shown as solid curves. The middle curve corresponds to background calculated with the nominal value of . The upper (lower) curve corresponds to the background if the upper (lower) bound on is used instead. Since we have conservatively assumed that the error on the of the trigger and associated particles is 100% correlated, the background occasionally goes above the signal in Figure 6(f) on the away-side. However, since we are focusing the near-side we prefer this conservative estimate. Note that the uncertainty in the size of the elliptic flow modulated background affects only the ridge yield but not the jet-like yield, since the elliptic flow contribution to the jet-like yield in cancels out in Eq.(6) and in is included in in Eq.(8).
Sample background subtracted correlation functions from Eq.(8) and from Eq.(6) on the near side for GeV/ and GeV/ from Figure 5 and Figure 6 are shown in Figure 7.
For the given kinematic selection, the extracted jet-like correlation peaks in both and projections look very similar in all studied systems and collision energies. The jet-like yields discussed through the rest of the paper are obtained from the projection method; the method is only used for determining the width of the jet-like correlation in . Below, the dependence of the near side jet-like yield and Gaussian width of the jet-like correlation peak on collision centrality and the transverse momentum of the trigger and associated particles are studied in detail.
Figure 8: (Color online) Dependence of jet-like yield on for GeV/ and GeV/ for Cu+Cu and Au+Au at = 62.4 GeV and +Au, Cu+Cu and Au+Au at = 200 GeV. Comparisons to PYTHIA, =2, are shown as lines. The 5% systematic error due to the uncertainty on the associated particle’s efficiency is not shown and systematic errors due to the acceptance correction are given in Table 2. The background level and values used for the extraction of these yields are given in Table 4.
Figure 9: (Color online) Dependence of jet-like yield on for 0-95% +Au, 0-60% Cu+Cu at = 62.4 GeV and = 200 GeV, 0-80% Au+Au at = 62.4 GeV, and 0-12% and 40-80% Au+Au at = 200 GeV. Comparisons to PYTHIA are shown as lines. The 5% systematic error due to the uncertainty on the associated particle’s efficiency is not shown and systematic errors due to the acceptance correction are given in Table 2.
IV.2 The near-side jet-like component
The centrality dependence of the jet-like yield for GeV/ and GeV/ is plotted in Figure 8. The jet-like yield at = 62.4 GeV is lower than that at = 200 GeV by about a factor of three, which can be understood as the result of a steeply falling jet spectrum folded with the fragmentation function.
The measured yields are compared to PYTHIA simulations shown as a line in Figure 8. For these studies PYTHIA version 6.4.10 Sjostrand et al. (2006) CDF tune A Field (2001), which matches the data from the Tevatron at =1.8 TeV and also describes the pion and proton inclusive spectra well at RHIC energies Adams et al. (2006c, d, 2005c), is used. The PYTHIA prediction is somewhat above the data, even for +Au collisions. However, considering the fact that the data are from heavy-ion collisions and the PYTHIA simulations are for + collisions, good agreement is unanticipated. For a given number of participating nucleons, , and collision energy, , there is no significant difference between the +Au, Cu+Cu and Au+Au collisions observed, as expected if the jet-like correlation were dominantly produced by vacuum fragmentation.
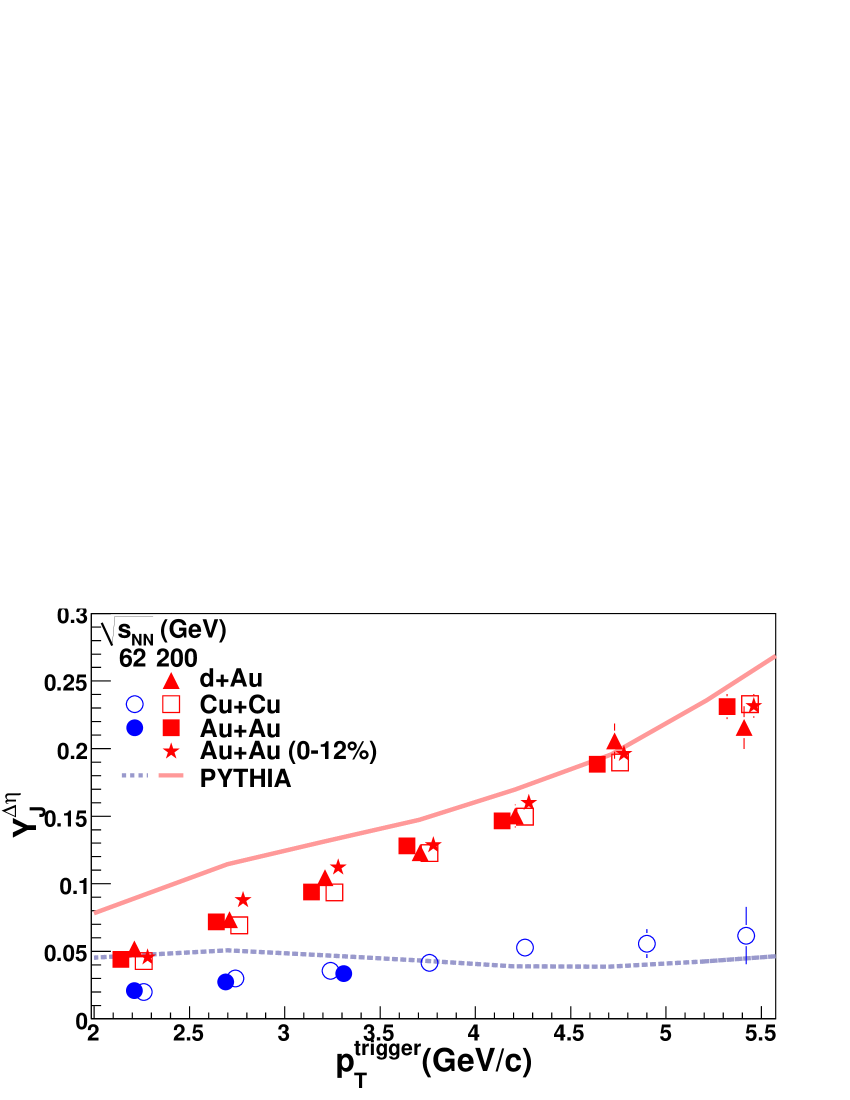
The dependence of the jet-like yield on for GeV/ is plotted in Figure 9 for all studied collision systems and energies. Data from Au+Au collisions at = 200 GeV are shown separately for peripheral (40-80%) and central (0-12%) Au+Au collisions. The jet-like yield increases constantly with for both Cu+Cu and Au+Au and for = 62.4 GeV and = 200 GeV. The effect of a steeper jet spectrum at = 62.4 GeV relative to 200 GeV discussed above is now reflected in the difference between the jet-like yields at the two energies. This difference in the jet-like yield between the two studied collision energies increases with from about a factor of two at = 2.5 GeV/ to a factor of four at = 5.5 GeV/. Comparisons to PYTHIA simulations are shown as lines in Figure 9. It is surprising how well PYTHIA is able to describe the dependence of the jet-like yield in + collisions. In general, the agreement is better at larger ( 4 GeV/), while at lower values PYTHIA predicts a larger jet-like yield than observed in the data. No significant differences between +Au, Cu+Cu and Au+Au collisions at = 200 GeV are observed. This finding is consistent with the jet-like correlation arising from fragmentation.
Figure 10: (Color online) Dependence of jet-like yield on for GeV/ for (a) 0-60% Cu+Cu and 0-80% Au+Au collisions at = 62.4 GeV and (b) 0-95% +Au, 0-60% Cu+Cu, 0-12% Au+Au and 40-80% Au+Au collisions at = 200 GeV. Solid lines through the data points are fits to the data. Comparisons to PYTHIA are shown as dashed lines. The 5% systematic error due to the uncertainty on the associated particle’s efficiency is not shown and systematic errors due to the acceptance correction are given in Table 2.
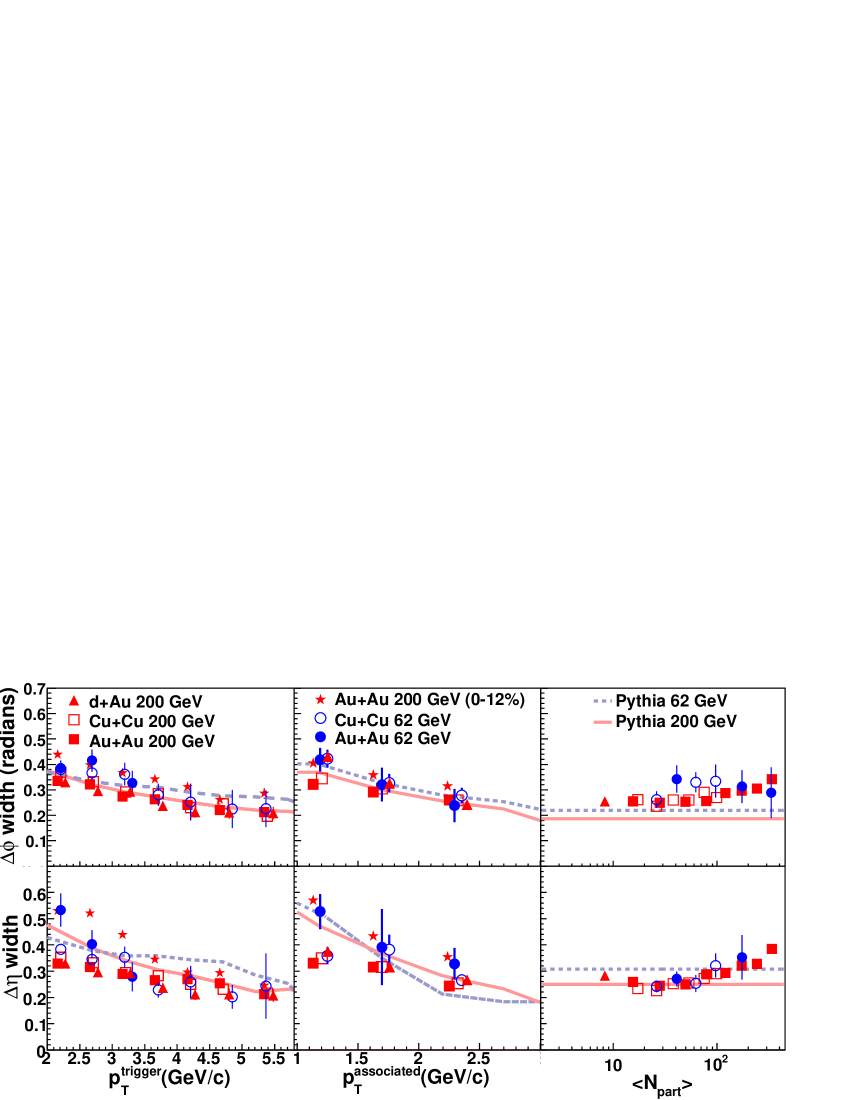
Figure 11: (Color online) Dependence of the widths in and on for GeV/ , for GeV/, and for GeV/ and GeV/ for 0-95% +Au, 0-60% Cu+Cu at = 62.4 GeV and = 200 GeV, 0-80% Au+Au at = 62.4 GeV, and 0-12% and 40-80% Au+Au at = 200 GeV. Comparisons to PYTHIA are shown as lines. The 5% systematic error due to the uncertainty on the acceptance correction is not shown and systematic errors due to the acceptance correction are given in Table 2.
Table 3: Inverse slope parameters in MeV/ of spectra from fits of data in Figure 10. The inverse slope parameter from a fit to inclusive spectra in Au+Au collisions Abelev et al. (2007b, 2006) above 1.0 GeV/ is 280.9 0.4 MeV/ for 0-10% = 62.4 GeV and 330.9 0.3 MeV/ for 0-12% = 200 GeV. Statistical errors only.
= 62.4 GeV
= 200 GeV
Au+Au
332 13
457 4 (40-80%)
399 4 (0-12%)
Cu+Cu
370 9
443 3
+Au
438 9
PYTHIA
417 9
491 3
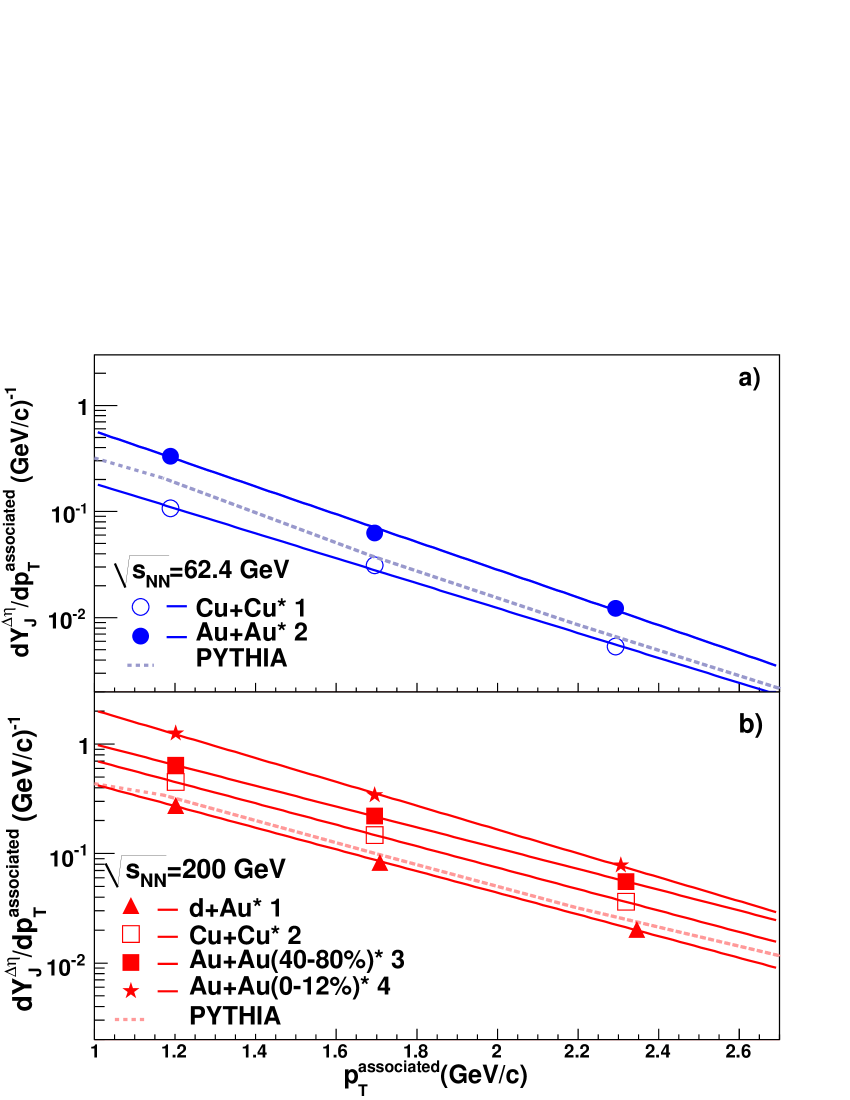
The spectra of particles associated with the jet-like correlation and their comparison to PYTHIA simulations for GeV/ are shown in Figure 10.
For the same selection, the mean transverse momentum fraction carried by the leading hadron is larger at = 62.4 GeV than at 200 GeV due to the steeper jet spectrum. This is reflected in softer spectra at = 62.4 GeV. The inverse slope parameters from an exponential fit to these data are shown in Table 3. There is no difference seen between Cu+Cu and peripheral Au+Au in either the data points or the extracted inverse slope parameter. The inverse slope parameter of the central Au+Au data at = 200 GeV is somewhat lower than the other data at = 200 GeV, largely because of the larger yield at the lowest . This also indicates that there is some modification of the jet-like correlation at low .
While the agreement with PYTHIA is remarkable for a comparison to + collisions, the discrepancies between PYTHIA and the data are larger at lower momenta and lower energy.
This is expected since PYTHIA is tuned better at higher and higher energy.
System
[%]
[%]
[%]
[%2]
[%2]
+Au
MB
8.30.4
7.50.4
0.1580.006
0.0
0.0
69 1
-285 14
200 GeV
Cu+Cu
0-10
963
16214
0.885 0.010
84 5
54 5
62.4 GeV
10-30
641
87.9-7.9
0.515 0.006
228 5
5 5
30-60
25.70.6
27.61.6
0.201 0.005
471 10
-77 10
Au+Au
0-10
3205
800 74
3.5820.019
63 3
42 2
62.4 GeV
10-40
1699
345 44
1.8460.010
258 2
57 2
40-80
428
51 16
0.4460.009
456 8
-33 8
Cu+Cu
0-10
991
18915
1.759 0.007
128 2
65 1
200 GeV
10-20
751
123.69.4
1.206 0.006
212 2
62 2
20-30
541
77.65.4
0.815 0.006
296 3
47 3
30-40
381
47.72.8
0.540 0.006
380 4
9 4
40-50
26.20.5
29.21.6
0.337 0.005
506 6
-37 6
50-60
17.20.4
16.80.9
0.209 0.005
657 10
-162 10
Au+Au
0-12
3166
90071
13.2550.003
81 1
49.9 0.2
200 GeV
10-20
2295
51134
4.6830.007
225 1
67.1 0.6
20-30
1645
32523
3.2220.006
344 1
71.2 0.8
30-40
1145
19916
2.0940.006
430 1
68 1
40-50
765
11512
1.2670.006
461 2
57 2
50-60
485
618
0.7380.006
478 3
18 3
60-70
284
305
0.3860.006
549 6
-25 6
70-80
152
143
0.1830.006
754 12
-195 12
Table 4:
The background terms (see Equation III.5), elliptic flow values of trigger () and associated particles (), and Fourier coefficients and from 2D fits for different collision energies, systems and centrality bins defined by the fraction of geometric cross section (), average number of participants () and binary collisions () for the data in Figure 8.
Figure 11 shows the Gaussian widths of the and projections of the near-side jet-like peak as a function of , , and along with PYTHIA simulations. In the most central bin in Au+Au collisions at = 62.4 GeV it was not possible to extract the width in because of limited statistics combined with a residual track merging effect. There are no significant differences between the widths as a function of and for different collision systems except for central Au+Au collisions at = 200 GeV. While no dependence on collision system is observed, there is a clear increase in the width with increasing in Au+Au collisions at = 200 GeV. This indicates that the shape of the jet-like correlation is modified in central Au+Au collisions at = 200 GeV.
PYTHIA predicts a greater width in at the lowest than seen in +Au or Cu+Cu.
Overall it can be concluded that the agreement between the different collision systems and energies shows remarkably little dependence of the jet-like per trigger yield on the system size. In contrast to the peripheral Au+Au data, the central Au+Au data show indications that the jet-like correlation is modified. The model in Armesto et al. (2005), a hypothesis for the formation of the ridge through gluon bremsstrahlung, does not produce a ridge broad enough to agree with the data, however, it is possible that a similar mechanism could explain the broadening of the jet-like correlation. Similarly models for ridge production by turbulent color fields Romatschke (2007); Majumder et al. (2007) predict a broadening of the jet-like peak in which is not wide enough to describe the ridge but may explain the data in Figure 11.
IV.3 The near-side ridge
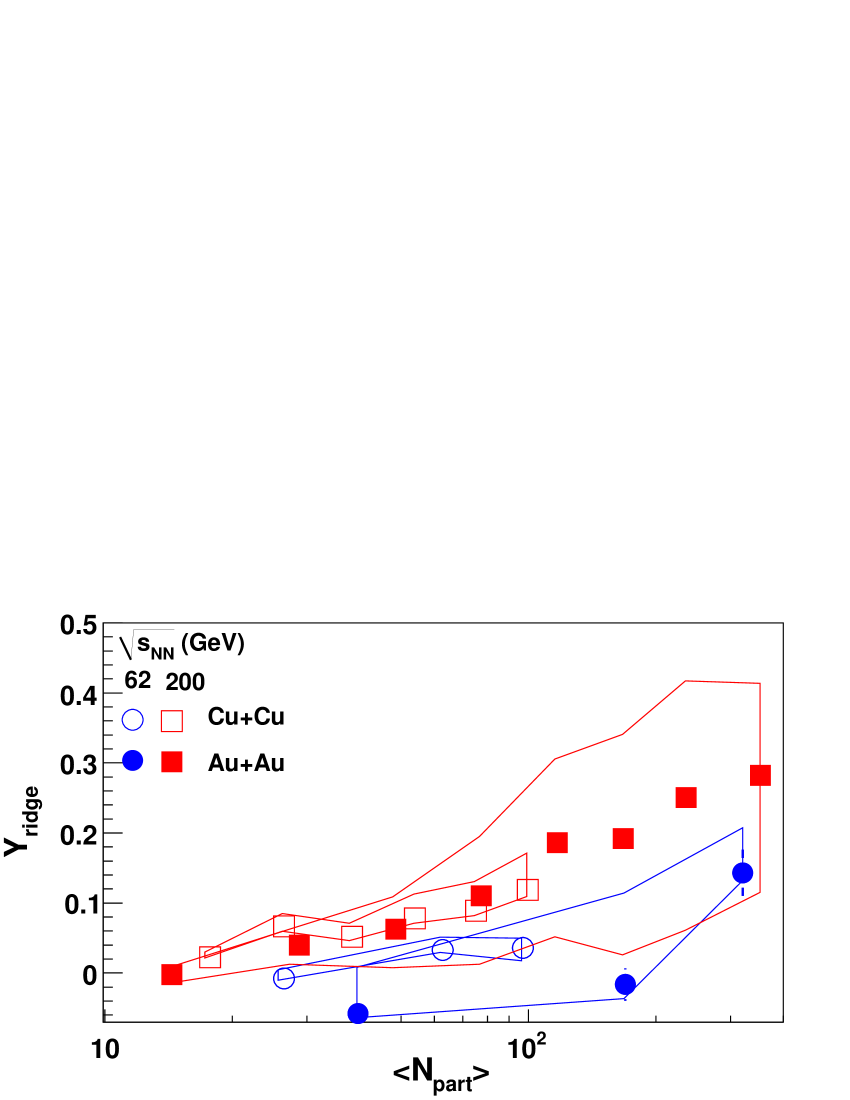
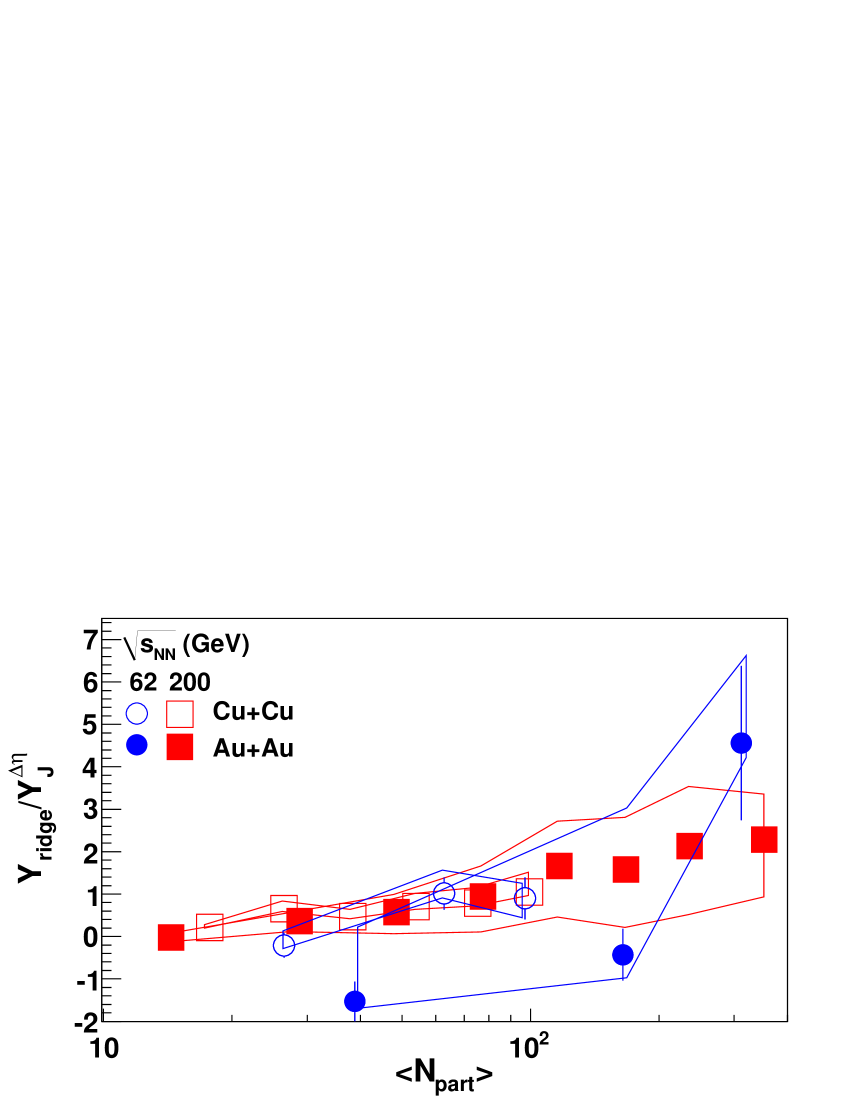
In Abelev et al. (2009b), we reported detailed studies of the ridge in Au+Au collisions at = 200 GeV as a function of and . Here we investigate the ridge centrality, energy and system size dependence. The dependence of the ridge yield on for Cu+Cu and Au+Au collisions is shown in Figure 12 for both energies studied. Table 4 shows values and of trigger and associated particles for all collision systems and energies studied in Figure 12. The centrality bins are characterized by the fraction of geometric cross section , average number of participants and number of binary collisions . Contrary to the jet-like yield, which shows little dependence on centrality, the ridge yield increases steeply with . Within errors, there is no difference in ridge yield between Cu+Cu and Au+Au collisions at the same at a given energy, demonstrating the system independence of the ridge yield.
Figure 12: (Color online) Dependence of the ridge yield on for GeV/ and GeV/ for Cu+Cu, and Au+Au at = 62.4 GeV and Cu+Cu and Au+Au at = 200 GeV. Systematic errors due to are shown as solid lines. The 5% systematic error due to the uncertainty on the associated particle’s efficiency is not shown and systematic errors due to the acceptance correction are given in Table 2.
The energy dependence of the ridge yield is potentially a sensitive test of ridge models. Comparing the two collision energies studied, the ridge yield is observed to be smaller at = 62.4 GeV than at = 200 GeV. Similar behavior was also observed for the jet-like yield. Therefore a closer investigation of the centrality dependence of the ratio is reported in Figure 13. The ratio of the yields is independent of collision energy within errors. For the same kinematic selections, the data at = 62.4 GeV correspond to a lower jet energy which may imply the decrease of the ridge yield with the parton energy, as observed for the jet-like yield.
A recent STAR study of the ridge using two-particle azimuthal correlations with respect to the event plane Agakishiev et al. (2010) in Au+Au collisions at = 200 GeV shows that the ridge yield is dependent on the angle of the trigger particle relative to the event plane. Another STAR study of three-particle correlations in pseudorapidity Abelev et al. (2010a) in Au+Au collisions at = 200 GeV shows that within current experimental precision particles in the ridge are uncorrelated in with both the trigger particle and each other.
These observations along with the PHOBOS measurement of the ridge out to =4 Alver et al. (2010a) provide substantial experimental constraints on theories for the production of the ridge. In addition, the CMS experiment recently observed the ridge in high multiplicity + collisions at =7 TeV Khachatryan et al. (2010). We consider these results in addition to the results presented in this paper in order to evaluate our current theoretical understanding of the ridge.
The momentum kick model Wong (2008) with the same kinematic selection criteria applied to charged particles describes the increase of the ridge yield with centrality quantitatively in Au+Au collisions at = 200 GeV. For a given collision energy the ridge yield for Cu+Cu collisions is predicted to approximately follow that for Au+Au collisions for the same number of participants, however the prediction for Cu+Cu collisions is systematically above that for Au+Au collisions at both energies. This difference between the two systems is not corroborated by the data. For the same nucleus-nucleus collisions at different energies, the ridge yield in the momentum kick model is predicted to scale approximately with the number of medium partons produced per participant which increases with increasing collision energy as Busza (2004). According to this prediction, should increase by a factor of 1.6 in = 200 GeV relative to 62 GeV. This is in agreement with our measurement.
We note that the momentum kick model is likely to have difficulty describing the observed dependence of the ridge yield on the event plane, since it would likely predict larger ridge out-of-plane. It would also likely have difficulty explaining the absence of correlations between particles in the ridge and the jet-like correlation.
The model where the ridge arises from the coupling of induced gluon radiation to the longitudinal flow Armesto et al. (2004) is in qualitative agreement with the observed increase of as a function of since the size of the ridge should depend roughly on the average path length traveled by a hard parton. However, it is not obvious that this model can describe the collision system and energy dependence of ridge yield reported in this paper. Moreover, the large extent of the ridge in and absence of correlation among ridge particles clearly disfavors this physics mechanism for ridge formation.
Figure 13: (Color online) Ratio of the ridge and jet-like yields as a function of for GeV/ and GeV/ . Systematic errors due to are shown as solid lines and systematic errors due to the acceptance correction are given in Table 2.
The radial flow plus trigger bias model Pruneau et al. (2008); Shuryak (2007); Voloshin (2006) would predict an increasing ridge yield with increasing . This model would predict a larger ridge in-plane because of the larger surface area in-plane, in agreement with the data. Since the ridge in this model arises from medium partons, particles in the ridge are not expected to be correlated with each other, again in agreement with the 3-particle correlation data.
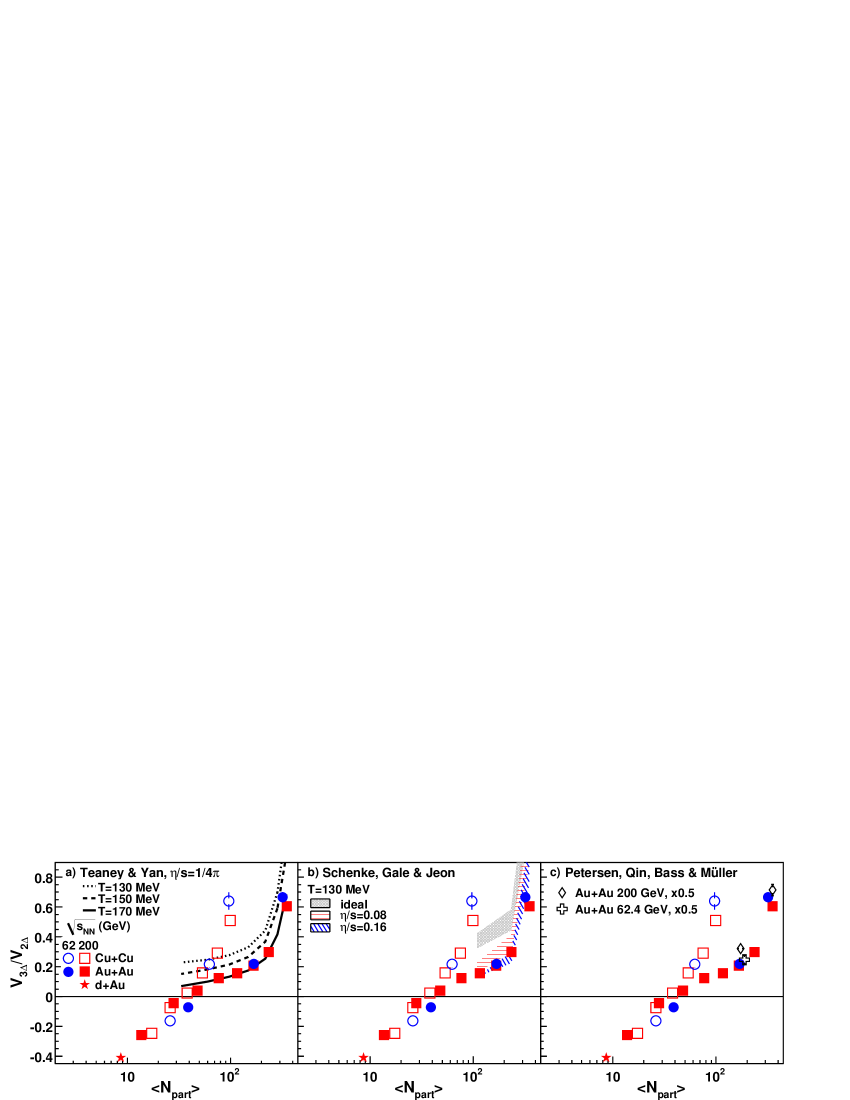
Figure 14: (Color online) ratio as a function of for GeV/ and GeV/ . Statistical errors only. The systematic error of 4% not shown. The data are compared to hydrodynamical calculations using (a) lattice equation of state with three different freeze-out temperatures in Au+Au collisions at = 200 GeV from Teaney and Yan (2011a); Teaney and
Yan (2011b) (b) using a 3+1D viscous hydrodynamical model with three different viscosity to entropy ratios, Schenke et al. (2011); Schenke (2011), and (c) a 3+1D model incorporating both hydrodynamics and transport model Petersen et al. (2010); Petersen (2011). (a) and (c) use the same kinematic cuts as the data while (b) uses 1.5 4.0 GeV/ for both and .
The mechanisms for the production of the ridge through glasma initial state effects Dumitru et al. (2008); Gelis et al. (2009); Gavin et al. (2009) are able to explain the observed large extent of the ridge. However, it is not obvious what this class of models would predict for the collision system and energy dependence discussed in this paper as well as for other ridge properties including its and dependence, the event plane dependence, and the absence of correlated structures in three-particle correlations. While there are calculations of untriggered di-hadron correlations for the glasma model, there are no calculations to compare to high- triggered correlations. It should be noted that these calculations not only include the glasma initial state but also hydrodynamical flow so some of the ridge in these models is created by flow.
If the ridge is produced by the same mechanism in + and + collisions, models where the ridge is produced by initial state effects such as the glasma model may be the only models able to explain both the + and + data simultaneously since hydrodynamical flow in + collisions is expected to be small if not negligible. Therefore quantitative calculations of the ridge in this class of models and the identified particle spectra measurements in high multiplicity + collisions are essential for understanding the production mechanism of the ridge.
Models describing the ridge in terms of quadrupole, triangular and higher order components, , from initial eccentricity fluctuations predict a ridge yield that increases with Sorensen (2010); Alver and Roland (2010a); Alver and
Roland (2010b); Sorensen (2011) in qualitative agreement with data.
Motivated by these models, we applied two dimensional fits to our data with a two dimensional Gaussian to describe the jet-like component and independent terms given by Eq. (11). Figure 14 shows as a function of from these fits. The values of the Fourier coefficients and are given in Table 4. We allow to be negative and is negative for +Au collisions and peripheral + collisions. An approximately Gaussian peak from an away-side jet-like correlation would give a negative and indicate that is dominantly from non-flow. The ratio evolves from negative values in +Au and peripheral + collisions to positive values at larger .
Positive values for are consistent with expectations from triangular initial conditions. Contributions to a jet-like peak on the away-side, such as that observed in +Au, would lead to because would be an underestimate of and would be an overestimate of . For both Au+Au and Cu+Cu collisions, the ratio is independent of collision energy within errors and is largest in the most central collisions with significant deviation between the two colliding systems at the same .
It is not clear at this point whether the representation of the data in Figure 12, where the has been subtracted, or in Figure 14, where the is explicitly included, gives the most insight into the production mechanism of the ridge.
We compare the data to three hydrodynamical models in Figure 14, noting that these data are in a momentum range approaching the limit where hydrodynamical models are expected to be valid. By comparing different models to the data we are able to see whether the data can constrain the initial state.
In Figure 14a we compare the data to 2+1D hydrodynamical model calculations for Au+Au collisions at = 200 GeV for various hadron resonance gas freezeout temperatures and using a modified Glauber initial state Teaney and Yan (2011a). These calculations use a lattice equation of state and a viscosity to entropy ratio /s = 1/4 Teaney and
Yan (2011b). We note that this model does not include resonance decays. These predictions agree with the data for all but the three most peripheral centrality bins for a hadron gas freezeout temperature of 170 MeV.
In Figure 14b we compare the data to 3+1D hydrodynamical model calculations for several values of /s and a kinetic freezeout temperature of 130 MeV Schenke et al. (2011); Schenke (2011). This model uses a Glauber initial state modified to generate structures like those expected from flux tubes and differs from Teaney and Yan (2011a) because it includes nontrivial longitudinal dynamics and the effect of varying the /s at a given freeze-out temperature. The calculations in Schenke et al. (2011); Schenke (2011) were limited in momentum so it was only possible to compare to calculations with momenta of 1.5 4.0 GeV/ for both and . Qualitatively this model reproduces the trends observed in the data and it tends to support a higher value of /s.
Figure 14c shows a comparison of the data to a 3+1D event-by-event transport + hydrodynamical model calculation Petersen et al. (2010); Petersen (2011). In this model, the initial conditions such as long range rapidity correlations and fluctuations in the transverse energy density profile are provided by the UrQMD model Bass et al. (1998); Bleicher et al. (1999). The hydrodynamic evolution starts at 0.5 fm. A transition from hydrodynamic evolution to the transport approach is followed by final state rescatterings and resonance decays. The predictions shown in the figure are scaled by a factor 0.5. Requiring a high trigger particle skews the calculation towards events with a hot spot in the initial density profile, which may lead to a preference for events with a high value. This model qualitatively describes the dependence of for Au+Au collisions at both = 62.4 GeV and 200 GeV.
Despite differences in initial conditions, transport parameters and freeze-out requirements, all three models shown are able to reproduce the qualitative trends of versus for large . Since is expected to be largely independent of centrality Qiu and Heinz (2011); Alver and Roland (2010a) this likely reflects the model’s accuracy in predicting centrality dependence of . The models in Teaney and
Yan (2011b); Schenke et al. (2011) reproduce the data fairly well quantitatively, but Teaney and
Yan (2011b) achieves the best fit by varying the temperature while Schenke et al. (2011) varies the viscosity. Since they also have different initial conditions, we infer that agreement with the data is possible even with different assumptions and parameters during the hydrodynamical evolution. It will be interesting to see if such similarity persists at lower transverse momenta where the hydrodynamic calculations are more reliable. These studies imply that while fluctuations of the initial state are needed to induce odd higher order terms, the observable is rather insensitive to the exact details of the model. This measurement does however enforce added restrictions to model implementations and should therefore be added to the suite of results, such as identified particle spectra, yields and dependence of , currently used to validate theories. Future theoretical and experimental studies will be needed to determine whether these models are sufficient to describe the complete ridge, and/or whether there are substantial non-flow contributions to the Fourier coefficient in central + collisions.
V Conclusions
The energy and system size dependence of near-side di-hadron correlations enables studies of the jet-like correlation and the ridge at fixed densities with different geometry.
The reasonable agreement of the jet-like correlation with PYTHIA is surprising, especially considering that PYTHIA is a + event generator. There is remarkably little dependence on the collision system at both = 62.4 GeV and 200 GeV except for central Au+Au collisions at = 200 GeV. In central Au+Au collisions at = 200 GeV the jet-like correlation is substantially broader and the spectrum softer than in peripheral collisions and than those in collisions of other systems in this kinematic regime. This may indicate that fragmentation is modified in these collisions so that the parton fragments softer, perhaps due to a mechanism such as gluon bremsstrahlung. This indicates that the near-side jet-like correlation is dominantly produced by vacuum fragmentation.
The ridge is observed not only in Au+Au collisions at = 200 GeV as we reported earlier, but also in Cu+Cu collisions and in both studied collision systems at lower energy of = 62.4 GeV. This demonstrates that the ridge is not a feature unique to Au+Au collisions at the top RHIC energy.
We observe two trends which set significant limits to models.
First, when the ridge is measured using the standard ZYAM model, the ridge is comparable in Cu+Cu and Au+Au collisions and the energy dependence of the ridge is the same as the energy dependence of the jet-like correlation.
Second, when we subtract the jet-like correlation and calculate the third component of the Fourier decomposition , which is in the absence of non-flow, we see different trends for Cu+Cu and Au+Au but no difference between the two energies.
The combination of these data with future measurements at lower RHIC energies ( = 7-39 GeV) as well as studies at the LHC will therefore be a powerful tool for the distinction between various theoretical models for the production of the ridge.
Acknowledgements.
We thank Hannah Petersen, Bjoern Schenke, Derek Teaney and Li Yan for useful discussions, the RHIC Operations Group and RCF at BNL, the NERSC Center at
LBNL and the
Open Science Grid consortium for providing resources and support. This work was supported in part by the Offices of NP and HEP within the U.S. DOE Office of Science, the U.S. NSF, the Sloan Foundation, the DFG cluster of excellence ‘Origin and Structure of the Universe’of Germany, CNRS/IN2P3, FAPESP CNPq of Brazil, Ministry of Ed. and Sci. of the Russian Federation, NNSFC, CAS, MoST, and MoE of China, GA and MSMT of the Czech Republic, FOM and NWO of the Netherlands, DAE, DST, and CSIR of India, Polish Ministry of Sci. and Higher Ed., Korea Research Foundation, Ministry of Sci., Ed. and Sports of the Rep. Of Croatia, and RosAtom of Russia.
References
Wang and Gyulassy (1992)
X.-N. Wang and
M. Gyulassy,
Phys. Rev. Lett. 68,
1480 (1992).
Adler et al. (2002)
C. Adler et al.
(STAR), Phys. Rev. Lett.
89, 202301
(2002).
Adcox et al. (2002)
K. Adcox et al.
(PHENIX), Phys. Rev. Lett.
88, 022301
(2002).
Adcox et al. (2003)
K. Adcox et al.
(PHENIX), Phys. Lett. B
561, 82 (2003).
Adler et al. (2003a)
S. S. Adler et al.
(PHENIX), Phys. Rev. Lett.
91, 072301
(2003a).
Back et al. (2004)
B. B. Back et al.
(PHOBOS), Phys. Lett. B
578, 297 (2004).
Adams et al. (2003a)
J. Adams et al.
(STAR), Phys. Rev. Lett.
91, 172302
(2003a).
Adams et al. (2005a)
J. Adams et al.
(STAR), Phys. Rev. Lett.
95, 152301
(2005a).
Abelev
et al. (2009a)
B. I. Abelev
et al. (STAR), Phys.
Rev. Lett. 102, 052302
(2009a).
Adler
et al. (2003b)
C. Adler et al.
(STAR), Phys. Rev. Lett.
90, 082302
(2003b), eprint nucl-ex/0210033.
Adams et al. (2006a)
J. Adams et al.
(STAR), Phys. Rev. Lett.
97, 162301
(2006a).
Abelev et al. (2009b)
B. I. Abelev
et al. (STAR), Phys.
Rev. C 80, 064912
(2009b).
Abelev et al. (2010a)
B. I. Abelev
et al. (STAR), Phys.
Rev. Lett. 105, 022301
(2010a).
Agakishiev et al. (2010)
H. Agakishiev
et al. (STAR) (2010),
eprint nucl-ex/1010.0690.
Alver et al. (2010a)
B. Alver et al.
(PHOBOS), Phys. Rev. Lett.
104, 062301
(2010a).
Adams et al. (2006b)
J. Adams et al.
(STAR), Phys. Rev. C
73, 064907
(2006b).
Agakishiev et al. (2011)
G. Agakishiev
et al. (STAR) (2011),
* Temporary entry *, eprint 1109.4380.
Armesto et al. (2004)
N. Armesto,
C. A. Salgado,
and U. A.
Wiedemann, Phys. Rev. Lett.
93, 242301
(2004).
Wong (2008)
C.-Y. Wong,
Phys. Rev. C 78,
064905 (2008).
Cheuk-Yin (2008)
W. Cheuk-Yin,
Chinese Physics Letters 25,
3936 (2008).
Wong (2007)
C.-Y. Wong,
Phys. Rev. C 76,
054908 (2007).
Hwa and Yang (2009)
R. C. Hwa and
C. B. Yang,
Phys. Rev. C 79,
044908 (2009).
Chiu et al. (2008)
C. B. Chiu,
R. C. Hwa, and
C. B. Yang,
Phys. Rev. C 78,
044903 (2008).
Chiu and Hwa (2009)
C. B. Chiu and
R. C. Hwa,
Phys. Rev. C 79,
034901 (2009).
Voloshin (2006)
S. A. Voloshin,
Phys. Lett. B 632,
490 (2006).
Pruneau et al. (2008)
C. A. Pruneau,
S. Gavin, and
S. A. Voloshin,
Nucl. Phys. A 802,
107 (2008).
Majumder et al. (2007)
A. Majumder,
B. Muller, and
S. A. Bass,
Phys. Rev. Lett. 99,
042301 (2007).
Dumitru et al. (2008)
A. Dumitru,
F. Gelis,
L. McLerran, and
R. Venugopalan,
Nucl. Phys. A 810,
91 (2008).
Gelis et al. (2009)
F. Gelis,
T. Lappi, and
R. Venugopalan,
Phys. Rev. D 79,
094017 (2009).
Gavin et al. (2009)
S. Gavin,
L. McLerran, and
G. Moschelli,
Phys. Rev. C 79,
051902(R) (2009).
Mishra et al. (2008)
A. P. Mishra,
R. K. Mohapatra,
P. S. Saumia,
and A. M.
Srivastava, Phys. Rev. C
77, 064902
(2008).
Sorensen (2010)
P. Sorensen,
J. Phys. G 37,
094011 (2010).
Takahashi et al. (2009)
J. Takahashi
et al., Phys. Rev. Lett.
103, 242301
(2009).
Alver and Roland (2010a)
B. Alver and
G. Roland,
Phys. Rev. C 81,
054905 (2010a).
Alver and
Roland (2010b)
B. Alver and
G. Roland,
Phys. Rev. C 82,
039903(E) (2010b).
Alver et al. (2010b)
B. H. Alver,
C. Gombeaud,
M. Luzum, and
J.-Y. Ollitrault,
Phys. Rev. C 82,
034913 (2010b).
Holopainen et al. (2011)
H. Holopainen,
H. Niemi, and
K. J. Eskola,
Phys. Rev. C 83,
034901 (2011).
Adams et al. (2003b)
J. Adams et al.
(STAR), Phys. Rev. Lett.
91, 072304
(2003b).
Ackermann et al. (2003)
K. H. Ackermann
et al., Nucl. Instrum. Meth. A
499, 624 (2003).
Miller et al. (2007)
M. L. Miller,
K. Reygers,
S. J. Sanders,
and
P. Steinberg,
Ann. Rev. Nucl. Part. Sci. 57,
205 (2007).
Abelev et al. (2010b)
B. I. Abelev
et al., Phys. Lett. B
683, 123
(2010b).
Aggarwal et al. (2010)
M. M. Aggarwal
et al. (STAR), Phys.
Rev. C 82, 024912
(2010).
Adams et al. (2005b)
J. Adams et al.
(STAR), Phys. Rev. C
71, 044906
(2005b).
Adare et al. (2008)
A. Adare et al.
(PHENIX), Phys. Rev. C
78, 014901
(2008).
Adams et al. (2007)
J. Adams et al.
(STAR), Phys. Rev. C
75, 034901
(2007).
Trainor (2010)
T. A. Trainor,
Phys. Rev. C 81,
014905 (2010).
Voloshin et al. (2010)
S. A. Voloshin,
A. M. Poskanzer,
and
R. Snellings,
SpringerMaterials - The Landolt-Bornstein Database
23 (2010).
Abelev et al. (2007a)
B. I. Abelev
et al. (STAR), Phys.
Rev. C 75, 054906
(2007a).
Abelev et al. (2010c)
B. I. Abelev
et al. (STAR), Phys.
Rev. C 81, 044902
(2010c).
Back et al. (2005a)
B. B. Back et al.
(PHOBOS), Phys. Rev. C
72, 051901(R)
(2005a).
Back et al. (2005b)
B. B. Back et al.
(PHOBOS), Phys. Rev. Lett.
94, 122303
(2005b).
Sjostrand et al. (2006)
T. Sjostrand,
S. Mrenna, and
P. Skands,
JHEP 05, 026
(2006).
Field (2001)
R. D. Field,
eConf C010630 P 501
(2001).
Adams et al. (2006c)
J. Adams et al.
(STAR), Phys. Rev. D
74, 032006
(2006c).
Adams et al. (2006d)
J. Adams et al.
(STAR), Phys. Lett. B
637, 161
(2006d).
Adams et al. (2005c)
J. Adams et al.
(STAR), Phys. Lett. B
616, 8
(2005c).
Abelev et al. (2007b)
B. I. Abelev
et al. (STAR), Phys.
Lett. B 655, 104
(2007b).
Abelev et al. (2006)
B. I. Abelev
et al. (STAR), Phys.
Rev. Lett. 97, 152301
(2006).
Armesto et al. (2005)
N. Armesto,
C. A. Salgado,
and U. A.
Wiedemann, Phys. Rev. C
72, 064910
(2005).
Romatschke (2007)
P. Romatschke,
Phys. Rev. C 75,
014901 (2007).
Khachatryan et al. (2010)
V. Khachatryan
et al. (CMS Collaboration),
JHEP 1009, 091
(2010), eprint 1009.4122.
Busza (2004)
W. Busza, Acta
Phys. Polon. B35, 2873
(2004).
Shuryak (2007)
E. V. Shuryak,
Phys. Rev. C 76,
047901 (2007).
Teaney and Yan (2011a)
D. Teaney and
L. Yan,
Phys. Rev. C 83,
064904 (2011a).
Teaney and
Yan (2011b)
D. Teaney and
L. Yan
(2011b), private communication.
Schenke et al. (2011)
B. Schenke,
S. Jeon, and
C. Gale,
Phys. Rev. Lett. 106,
042301 (2011).
Schenke (2011)
B. Schenke
(2011), private communication.
Petersen et al. (2010)
H. Petersen,
G.-Y. Qin,
S. A. Bass, and
B. Muller,
Phys. Rev. C 82,
041901(R) (2010).
Petersen (2011)
H. Petersen
(2011), private communication.
Sorensen (2011)
P. Sorensen,
Nucl. Phys. A 855,
229 (2011).
Bass et al. (1998)
S. Bass,
M. Belkacem,
M. Bleicher,
M. Brandstetter,
L. Bravina,
et al., Prog.Part.Nucl.Phys.
41, 255 (1998),
eprint nucl-th/9803035.
Bleicher et al. (1999)
M. Bleicher,
E. Zabrodin,
C. Spieles,
S. Bass,
C. Ernst,
et al., J.Phys.G
G25, 1859 (1999),
eprint hep-ph/9909407.
Qiu and Heinz (2011)
Z. Qiu and
U. W. Heinz,
Phys.Rev. C84,
024911 (2011), eprint 1104.0650.