A Herschel Search For Cold Dust in Brown Dwarf Disks: First Results
Abstract
We report initial results from a Herschel program to search for far-infrared emission from cold dust around a statistically significant sample of young brown dwarfs. The first three objects in our survey are all detected at 70µm, and we report the first detection of a brown dwarf at 160µm. The flux densities are consistent with the presence of substantial amounts of cold dust in the outer disks around these objects. We modeled the SED’s with two different radiative transfer codes. We find that a broad range of model parameters provides a reasonable fit to the SED’s, but that the addition of our 70µm, and especially the 160µm detection enables strong lower limits to be placed on the disk masses since most of the mass is in the outer disk. We find likely disk masses in the range of a few to M⊙. Our models provide a good fit to the SED’s and do not require dust settling.
1 Introduction
Young brown dwarfs exhibit circum-“stellar” disk phenomena much like their more massive counterparts, e.g. Klein et al. (2003), Apai et al. (2004) and Luhman et al. (2010). Although there are quantitative differences in physical parameters for disks around sub-stellar objects such as the gas chemistry and degree of dust processing (Pascucci et al., 2009), the distribution of properties is relatively continuous across the sub-stellar boundary, e.g. Scholz et al. (2009). Brown dwarfs (BD’s) provide a qualitatively and quantitatively different physical environment in which to study disk structure and evolution, particularly in conditions more favorable to lower mass planet formation and with lower stellar heating and ionizing fluxes. Observational selection effects, however, make the study of BD disks more difficult than for T Tauri stars because of the low luminosities. The quantity of cold, T 150K, dust in the disks is difficult to determine without sensitive measurements at 30µm. There are two reported Spitzer detections of BD’s at 70µm (Guieu et al., 2007; Riaz & Gizis, 2008), and several have been detected at 1 mm (Klein et al., 2003; Scholz, Jayawardhana & Wood, 2006) with modest S/N. But the detected number is painfully small for any statistical investigation of the cold dust mass, disk flaring, dust emissivity, grain growth, and other properties.
We describe our earliest results from a Herschel (Pilbratt et al., 2010) GT1 (Guaranteed Time, Phase 1) program with the PACS photometer (Poglitsch et al., 2010) that will eventually provide sensitive photometry at 70 and 160µm of 50 young BD’s in several star-forming regions spanning a range of ages and spectral types. Our earliest sample is a strong function of Herschel scheduling and comprises three objects, two in the relatively older (8–10 Myr) TW Hya association (TWA), and one in the younger ( 2 Myr) Chamaeleon I region.
2 Observations and Data Reduction
All the observations used the PACS “mini-scan-map” mode with similar integration times. This mode simultaneously images at 70 and 160µm with two scan maps at the recommended relative angle for good 1/f noise reduction and high sensitivity over an area 60″90″. Table 1 lists the relevant parameters and Table 2 lists the AOR’s.
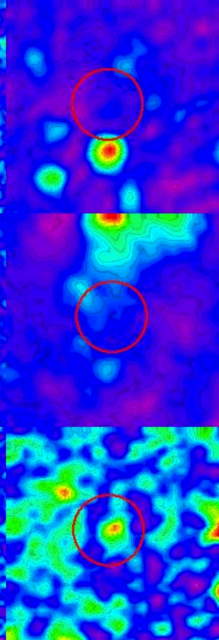
The data were first processed with the Herschel Interactive Processing Environment version 7.0, with standard high-pass filtering for point-source observations to produce fits files of the image, coverage, and uncertainty. The uncertainty images are not yet reliable, so we estimated uncertainties as described below. Figure 1 shows the final mosaicked images. We also processed each AOR separately to test that the individual observations were consistent with the combined set for each object, i.e. the expected reduction in S/N.
The final processing utilized the psf-fitting photometry tool, c2dphot, from the c2d Spitzer Legacy Team (Harvey et al., 2006; Evans et al., 2007), and based on the earlier DOPHOT tool (Schechter, Mateo, & Saha, 1993). This tool can be used in various modes, including finding peaks above the background and fitting a psf to the local maxima, or fitting a psf to a fixed position, a mode useful for estimating noise and determining upper limits. Our quoted noise was determined this way by fitting a half-dozen arbitrarily chosen, nominally empty parts of the image within the high-coverage area. Upper limits for the two objects undetected at 160µm were also determined this way, and also by inserting artificial sources in the images at various flux levels. This tool produces aperture fluxes for comparison with the psf-fitted values, and those values agree well. In addition, aperture-flux “curves-of-growth” show good agreement with the psf-fit photometry.
3 Observational Results
Figure 1 shows all three objects clearly detected at 70µm and SSSPM1102 also at 160µm. The level of structured background at 160µm is higher for the other two BD’s; the upper limits at 160µm for those two were set by this structure rather than by the instrumental sensitivity and DC sky background. There is some weak, diffuse emission at 160µm close to the position of 2M1207, but the offset from both the nominal source position and the 70µm centroid is probably too large to be consistent with emission from the object. In addition to our confidence in these detections based on inspection of the images, we note that c2dphot reliably extracted the sources as bona fide point sources with no confusion in its most general “source-finding” mode. The small offset from the nominal position for SSSPM1102, 2″, is essentially identical in both wavelength channels and well within the typical Herschel pointing uncertainty.
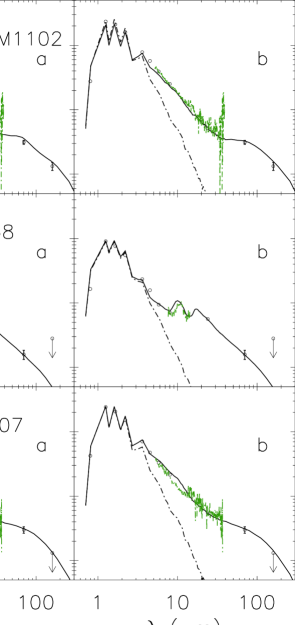
The derived flux densities and upper limits are listed in Table 2. All three objects have also been observed by Spitzer with IRAC and MIPS (Riaz, Gizis & Hmiel, 2006; Riaz & Gizis, 2008; Luhman et al., 2010). Two were observed with the IRS instrument over its whole spectral range (Riaz & Gizis, 2007, 2008; Morrow et al., 2008), and one (ISO138) over the 10µm silicate feature (Pascucci et al., 2009). All are detected in the 2MASS catalog and have reasonably well-determined spectral types as described below. We have collected these and available shorter wavelength data into the SED’s in Figure 2.
Figure 2 shows that the SED’s of the two BD’s in the TW Hya association are much more similar to each other than to ISO138 in Cham I. In particular, the [8]–[24] color and to a lesser extent the [8]–[70] color of ISO138 is substantially redder than for the other two. The two TWA BD’s also show strong excess emission to wavelengths as short as the IRAC 3.6µm band. Most importantly, all clearly show emission in the far-infrared indicative of substantial amounts of cold dust.
4 Modeling
We have modeled the SED’s of these three BD’s with two different codes, MC3D described by Wolf, Henning & Stecklum (1999); Wolf (2003) and MCFOST described by Pinte et al. (2006, 2009). Both codes are three-dimensional, radiative transfer codes using the Monte-Carlo method and NextGen stellar atmosphere parameters. The only significant differences in the modeling with each code were the range of parameters examined and a few of the initial assumptions described below. The goal of this modeling was to understand what disk parameters we are most likely to be able to constrain in the future, and what assumptions are most critical to define, perhaps by future observations. For example, we did not attempt to fit the exact shape of the silicate feature, hence the exact silicate mineralogy of the dust in the disk atmosphere. The integrated flux in the model feature is close to the data, and the thermal budget of the disk is therefore also correct and sufficiently accurate for this study. More detailed modeling will follow when our full BD sample is available.
Both modeling codes parametrize the disk structure geometrically in similar ways. Typical parameters that were fixed in our initial modeling include: the slope of the grain size distribution, , minimum grain size, and the dust grain properties, typically astronomical silicates as described by Draine & Lee (1984) with varying amounts of amorphous carbon. In the MC3D models the surface density power law was set to with , while with MCFOST a range for the exponent from 0.1 to 1.5 was explored, depending on the object. The stellar parameters were fixed based on previous studies referenced below, but models with some variation in parameters were tested because of uncertainties in spectral types, luminosities, and stellar radii. Typical parameters that differed between models included: maximum grain size, total gasdust disk mass (with an assumed gas-to-dust mass ratio of 100), inclination angle, inner radius, and the disk scale height parameters, and , . The outer radius was typically fixed at 50–200 AU, but the SED’s are quite insensitive to this choice, as illustrated below.
For each object Figure 2 shows two example good-fit models whose parameters are listed in Table 3. We found that many of the model parameters are quite unconstrained or strongly dependent on other parameters or on our choice of such basic values as the exact stellar properties and dust properties. For example, there are the expected degeneracies between stellar luminosity versus extinction, inner disk radius versus minimum grain size, and between disk mass and grain optical and size properties.
4.1 SSSPM1102
SSSPM1102-3431 was identified as an M8.5 brown dwarf in the TW Hya association by Scholz et al. (2005). Photometry and spectroscopy with Spitzer were reported by Riaz & Gizis (2008); Morrow et al. (2008) and Luhman et al. (2010), and these results are shown in Figure 2. The object has a well-determined parallax distance of 55.2 pc (Teixeira et al., 2008) and no reported companions.
The two models in Figure 2 illustrate the effect of adding 10% amorphous carbon to a nominal silicate grain composition, providing a better fit to the lack of a strong silicate feature in the Spitzer IRS data. Although most of the disk parameters are not well constrained, we find a fairly robust lower limit to the disk mass of a few M⊙ which is driven by the strong far-ir emission detected. The probability distribution is quite flat above M⊙. The disk inclination is also likely greater than 60∘.
4.2 ISO138
ISO138 was identified by Gómez & Persi (2002) as an M5.5 brown dwarf in the Chamaeleon I association, though subsequent spectroscopy by Luhman (2004) found a spectral type of M6.5. Spitzer photometry of ISO138 reported by Luhman et al. (2008a) and IRS spectroscopy over the 10µm silicate feature by Pascucci et al. (2009) are shown in Figure 2. Based on its presumed membership in Cha I, we assume a distance of 160 pc (Luhman et al., 2008b), and ISO138 also has no reported companions.
Unlike the other two objects, ISO138 exhibits a weak silicate emission feature (Pascucci et al., 2009). The two model fits shown in Figure 2 illustrate the effect of silicate composition on the shape of the emission feature. The fitted inclination angle and were strongly dependent on the assumed stellar parameters. The only fitted parameter for which we have a reasonable constraint is the mass for which a broadly-peaked probability distribution was found around M few M⊙. The far-ir flux implies a lower disk mass limit of a few M⊙. The inner disk radius is also constrained to the likely range 0.03–0.15 AU.
4.3 2M1207
Gizis (2002) identified 2MASS 1207334-393254 as a likely M8 brown dwarf in TWA as was subsequently confirmed by Chauvin et al. (2004). A trigonometric parallax distance of 52.4 pc has been derived by Ducourant et al. (2008). Spitzer photometry and spectroscopy are described by Riaz & Gizis (2008); Morrow et al. (2008) and are also shown in Figure 2. Riaz & Gizis (2008) plot a 70µm MIPS measurement in their Figure 6, but no flux value is described in the text other than an uncertainty of 0.4 mag, suggesting a 2 detection. Unlike the other BD’s, 2M1207 has a clearly identified companion at a projected separation of 770 mas (55 AU)(Chauvin et al., 2004, 2005). The mass and model-fit to the companion’s SED are a subject of some controversy in the literature, e.g. Mohanty et al. (2007); Mamajek & Meyer (2007); Skemer et al. (2011), but for the purposes of our modeling we assume the primary has a substantially higher mass and luminosity than the secondary, and provides most of the dust heating.
The two models shown in Figure 2 illustrate the negligible effect on the SED of truncating the outer radius of the disk due to possible effects of the known companion which would be expected to limit the outer disk radius to the component separation. Like SSSPM1102, most disk parameters are quite unconstrained by our models, but the mass and flaring index do exhibit peaked probability distributions. Our modeling suggests a likely disk mass M⊙ with a lower limit of a few M⊙, though masses up to M⊙ can also produce reasonable fits. The flaring index is fairly well constrained to the range .
5 Discussion
The strongest conclusion from our modeling is that the addition of the new Herschel data can provide important lower limits to the disk masses. Strong upper limits depend on as yet unavailable photometry at longer wavelengths and resolved imaging. With respect to most of the disk parameters, quite simple assumptions about the disk properties provide good fits to the observed SED’s, but changes to different parameters produce corresponding changes in other fitted parameters that still leave a model with a good fit. Our derived disk masses, for example, suggest that the SSSPM1102 disk is the most massive, but as for all modeling, this conclusion depends on assumed grain properties. With such assumptions, the range from the least to the most massive is likely to lie between a few M⊙ up to perhaps as much as M⊙ (gasdust), though with the most conservative uncertainty estimates, this range could be 3 times larger or smaller. The disk scale heights, at 100 AU, likely lie in the range of 5–20 AU with modest flaring indices, , both values that are typical in disk models for more massive objects. Interestingly the nominally more evolved objects may have less flared disks, based on their differences from ISO138, but more observations of additional BD’s are needed to determine if this is a general effect. Estimating sub-stellar masses is notoriously uncertain, especially for very young objects, e.g. Baraffe, Chabrier & Gallardo (2009). But using the spectral types mentioned above and ages of 1-2 Myr for Cham I and 8 Myr for TWA and common evolutionary BD models, these three objects probably have masses of a few 0.01 M⊙ (Burrows et al., 1997; Baraffe et al., 2003). This would imply a ratio of disk-to-stellar mass in the range up to a few for these three BD’s. An additional conclusion from our modeling is that it is more difficult to fit the observed SED’s with a grain size distribution appropriate for the interstellar medium than one in which there has been substantial growth in the maximum grain size, but even this conclusion depends somewhat on other assumptions about likely parameter values. Our modeling shows that the lack of a silicate emission feature in the SED’s of 2M1207 and SSSPM1102 can be produced by a modest admixture of amorphous carbon to the grain composition, though this could also be due to a lack of small silicate grains.
The two of our objects with complete Spitzer IRS observations have been modeled by Riaz & Gizis (2007, 2008) and Morrow et al. (2008). A number of small differences in model details make a direct comparison difficult. For example, Riaz & Gizis (2008) used different grain size distributions in the midplane and atmosphere of the disk to simulate dust settling. Morrow et al. (2008) included an expanded “wall” at the disk inner edge and characterized their disks with accretion parameters as well as using two grain populations. Like our models, though, they both assumed a grain size distribution, and were both unable to constrain the outer disk radius. Morrow et al. (2008) do not quote a total disk mass; Riaz & Gizis (2008) find a larger mass for the 2M1207 disk than that for SSSPM1102, but they did not have available the longer wavelength 160µm Herschel data. Like our results, both other studies find evidence for substantial grain growth and for inclinations of 60∘. Most importantly, none of our models required either dust settling nor an expanded inner wall to fit the observed SED’s with reduced 1.4. In general we find that it is difficult to constrain any of the disk parameters to the degree suggested by previous modeling without making assumptions that are themselves rather uncertain.
To further constrain these models the next obvious step is to extend the SED’s to 1 mm and obtain spatially resolved images with ALMA. The brighter members of our BD sample are likely to be resolvable with the full ALMA array. The available model parameter space may also be better constrained with the highest S/N spectroscopy to best define the sub-stellar photospheres, in particular for ISO138 which has discrepant spectral types in the literature.
One other BD has been observed over an even greater span of the electromagnetic spectrum, 2M04442713+2512 (Bouy et al., 2008) from the visible to 3.5mm. They inferred a fairly massive disk, M⊙, though even with their complete and high S/N observations, many disk parameters were still poorly constrained. Disk masses for BD’s have also been derived for objects with millimeter wavelength photometry by Klein et al. (2003) and Scholz, Jayawardhana & Wood (2006). They estimated masses in the range of – M⊙ with differing assumptions, but clearly in the same range as studies based on more complete SED’s. It is also interesting to compare these four BD’s, i.e. our three plus 2M04442713, to T Tauri stars. Andrews & Williams (2005, 2007) have surveyed T Tau stars at millimeter wavelengths where the dust is optically thin and the most accurate masses can be determined. They find dust masses in the range of up to perhaps as high as M⊙, depending on assumed grain sizes and properties, implying total disk masses of – M⊙ with our canonical gas-to-dust ratio. So the low end of the T Tau disk mass distribution overlaps with the high end, 2M04442713, of the BD distribution with the very small sample available so far for BD’s. Recently Lee, Williams & Cieza (2011) have found substantially lower disk masses around T Tauri stars in the 2 Myr old IC 348 association than in the very youngest, nearby star-forming clouds, Taurus and Ophiuchus. Since TWA and probably Cham I are both older than Taurus and Ophiuchus, it may be best to compare our BD disks to T Tauri disks in older star-forming clouds. With the completion of our data set within the coming year, we should have enough statistics to discern any such trends with better significance.
6 Summary
We have detected all three of our first program objects at 70µm and one at 160µm. These observations represent by far the most sensitive far-infrared photometry of brown dwarfs. Our modeling shows that the SED’s can be fit with simple geometric disks that do not require an inner wall nor dust settling. The addition of our Herschel measurements provides much stronger lower limits to the masses of the circumstellar disks because most of the disk mass is at large radii and relatively cool. The implied disk masses are probably well below those surrounding many of their more massive counterparts, the T Tau stars. These disks are likely to be optically thin in the far-ir perpendicular to the disk plane outside 1 AU, though optical depths through the midplane are still high, . Interestingly the least massive disk is found around the nominally youngest BD, ISO138 in Cham I, while the disks around the BD’s in TWA, presumed to have an age of order 8 Myr, are probably more massive. Future ALMA observations will enable more accurate masses and disk sizes to be determined for many of the objects in our sample that are bright enough to be resolved. For example, the most massive disk in this small sub-sample, that around SSSPM1102, would likely have a flux of slighly over 1 mJy at 850µm, and these three objects are some of the fainter members of our total sample.
7 Acknowledgments
Support for this work, as part of the NASA Herschel Science Center data analysis funding program, was provided by NASA through a contract issued by the Jet Propulsion Laboratory, California Institute of Technology to the University of Texas. LAC was supported by NASA through the Sagan Fellowship Program. FM and CP acknowledge support from ANR (contract ANR-07-BLAN-0221 and ANR-2010-JCJC-0504-01), European Commission’s 7(th) Framework Program (contract PERG06-GA-2009-256513), and Programme National de Physique Stellaire (PNPS) of CNRS/INSU, France. SW acknowledges support by the German Research Foundation (contract FOR 759). YL acknowledges support by the German Academic Exchange Service.
| Parameter | Value | Comments |
|---|---|---|
| AOR Type | PACS Mini-Scan-Map | Two Crossed AOR’s |
| Wavelengths | 70µm, 160µm | |
| Number of Scan Legs | 8 | |
| Scan Length | 3′ | |
| Cross Scan Step | 4″ | |
| Scan Angles | 70∘, 110∘ | Relative to Detector |
| Repetitions | 7 | Per AOR |
| Peak Intg Time Per Pixel | 504 sec | Per AOR |
| Object | RA/Dec Center (2000) | AOR’s | Obs. Date | 70µm (mJy) | 160µm (mJy) |
|---|---|---|---|---|---|
| SSSPM1102 | 11 02 09.8 -34 30 36 | 1342221849/50 | 29 May 2011 | 7.3 1.0 | 7.1 1.5 |
| ISO138 | 11 08 19.0 -77 30 41 | 1342218699/700 | 16 Apr 2011 | 3.7 0.6 | 15 |
| 2M1207 | 12 07 33.4 -39 32 54 | 1342202557/58 | 10 Aug 2010 | 7.0 0.8 | 7 |
| ISO138 | 2M1207 | SSPM1102 | |
|---|---|---|---|
| Parameter | 11Where two values are given, the first is for the “a” model and the second for the “b” model. Otherwise parameters were the same for both models.Value (Range) | 11Where two values are given, the first is for the “a” model and the second for the “b” model. Otherwise parameters were the same for both models.Value (Range) | 11Where two values are given, the first is for the “a” model and the second for the “b” model. Otherwise parameters were the same for both models.Value (Range) |
| Stellar | |||
| (K) | 2900 | 2600 | 2600 |
| (R⊙) | 0.35 (0.2–0.5) | 0.24 (0.2–0.3) | aafootnotemark: 0.35, bbfootnotemark: 0.27 (0.2–0.4) |
| Luminosity (L⊙) | 0.0168 | 0.0046 | 0.0059 |
| 0.5 | 0.0 | aafootnotemark: 0.0, bbfootnotemark: 1.5 | |
| Dist. (pc) | 160 | 53 | 56 |
| Disk | |||
| Incl. (deg) | 60 (0–90) | aafootnotemark: 70, bbfootnotemark: 78 (0–90) | aafootnotemark: 80, bbfootnotemark: 66 (0–90) |
| (AU) | 0.08 (0.08–40) | 0.015 (.005–.03) | aafootnotemark: 0.015, bbfootnotemark: 0.006 (.0035–.015) |
| (AU) | 100 | aafootnotemark: 75, bbfootnotemark: 20 | 75 |
| (AU)@100AU | 20 (5–30) | 9 (5–15) | 5 (5–15) |
| 1.25 (1.0–1.25) | 1.125 (1.00–1.125) | aafootnotemark: 1.05, bbfootnotemark: 1.07 (1.0-1.125) | |
| -p | 0.8 (0.5–1.5) | 1.0 (0.5–1.5) | aafootnotemark: 0.5, bbfootnotemark: 0.1 (0.1–1.5) |
| Dust | |||
| 22Assuming gas-to-dust mass ratio of 100.Log( (M⊙) | -5.2 (-6.7– -3.7) | aafootnotemark: -5.0 bbfootnotemark: -5.2 (-6.5– -3.5) | -4.0 (-6.5– -3.5) |
| (µm) | 0.05 | 0.1 | 0.05 |
| (µm) | 1000 (10–1000) | 1000 (10–1000) | 10 (10–1000) |
| Power law | -3.5 | -3.5 | -3.5 |
| Silicate | aafootnotemark: 0.95 DL, bbfootnotemark: 0.95 Olivine | 0.95 DL | aafootnotemark: 0.90 DL, bbfootnotemark: 1.00 DL |
| Amorphous Carbon | 0.05 | 0.05 | aafootnotemark: 0.10, bbfootnotemark: 0.00 |
References
- Andrews & Williams (2005) Andrews, S. M. & Williams, J. P. 2005, ApJ, 631, 1134
- Andrews & Williams (2007) Andrews, S. M. & Williams, J. P. 2007, ApJ, 671, 1800
- Apai et al. (2004) Apai, D. et al. 2004, A&A, 426, L53
- Baraffe et al. (2003) Baraffe, I., Chabrier, G., Allard, F. & Hauschildt, P. 2003, IAU Symp. 211, 41
- Baraffe, Chabrier & Gallardo (2009) Baraffe, I., Chabrier, G. & Gallardo 2009, ApJ, 702, L27
- Burrows et al. (1997) Burrows, A. et al 1997, ApJ, 491, 856
- Bouy et al. (2008) Bouy, H. et al. 2008, A&A, 486, 877
- Chauvin et al. (2004) Chauvin, G. et al. 2004, A&A, 425, L29
- Chauvin et al. (2005) Chauvin, G. et al. 2005, A&A, 438, L25
- Draine & Lee (1984) Draine, B. T. & Lee, H. M. 1984, ApJ, 285, 89
- Ducourant et al. (2008) Ducourant, C. et al. 2008, A&A, 477, L1
- Evans et al. (2007) Evans, N. J., II et al. 2007, Final Delivery of Data From the c2d Legacy Project: IRAC and MIPS, http://data.spitzer.caltech.edu/popular/c2d/20071101_enhanced_v1/ Documents/c2d_del_document.pdf
- Gizis (2002) Gizis, J. E. 2002, ApJ, 575, 484
- Gómez & Persi (2002) Gómez, M. & Persi, P. 2002, A&A, 389, 494
- Guieu et al. (2007) Guieu, S. et al. 2007, A&A, 465,855
- Harvey et al. (2006) Harvey, P. M. et al. 2006, ApJ, 644, 307
- Klein et al. (2003) Klein, R.; Apai, D.; Pascucci, I.; Henning, Th.; Waters, L. B. F. M. 2003, ApJ, 593L, 57
- Lee, Williams & Cieza (2011) Lee, N., Williams, J. P. & Cieza, L. A. 2011, ApJ, 736, 135
- Luhman (2004) Luhman, K. L. 2004, ApJ, 602, 816
- Luhman et al. (2008a) Luhman, K.L. et al. 2008, ApJ, 675, 1375
- Luhman et al. (2008b) Luhman, K.L. et al. 2008, Handbook SFR II, 169
- Luhman et al. (2010) Luhman, K.L., Allen, P.R., Espaillat, C., Hartmann, L. & Calvet, N. 2010, ApJS, 186, 111
- Mamajek & Meyer (2007) Mamajek, E. E. & Meyer, M. R. 2007, ApJ, 668, L175
- Mohanty et al. (2007) Mohanty, S. et al. 2007, ApJ, 657, 1064
- Morrow et al. (2008) Morrow, A. L. et al. 2008, ApJ, 676, L143
- Pascucci et al. (2009) Pascucci, I. et al. 2009, ApJ, 696, 143
- Pilbratt et al. (2010) Pilbratt, G. et al. 2010, A&A, 518, L1
- Pinte et al. (2006) Pinte, C., Ménard, F., Duchêne & Bastien, P. , A&A, 459, 797
- Pinte et al. (2009) Pinte, C., et al. 2009, A&A, 498, 967
- Poglitsch et al. (2010) Poglitsch, A. et al. 2010, A&A, 518, L9
- Riaz, Gizis & Hmiel (2006) Riaz, B., Gizis, J. E. & Hmiel, A. 2006, ApJ, 639, L79
- Riaz & Gizis (2007) Riaz, B. & Gizis, J. E. 2007, ApJ, 661, 354
- Riaz & Gizis (2008) Riaz, B. & Gizis, J. E. 2008, ApJ, 681, 1584
- Schechter, Mateo, & Saha (1993) Schechter, P. L., Mateo, M., & Saha, A. 1993, PASP, 105, 1342
- Scholz et al. (2005) Scholz, R.-D., McCaughrean, M. J., Zinnecker, H. & Lodieu, N. 2005, A&A, 430, L49
- Scholz, Jayawardhana & Wood (2006) Scholz, A., Jayawardhana, R. & Wood, K. 2006, ApJ, 645, 1498
- Scholz et al. (2009) Scholz, A., Geers, V., Jayawardhana, R., Fissel, L., Lee, E., LaFreniere, D. & Tamura, M. 2009, ApJ, 702, 805
- Skemer et al. (2011) Skemer, A. J. et al. 2011, ApJ, 732, 107
- Teixeira et al. (2008) Teixeira, R. et al. 2008, A&A, 489, 825
- Wolf, Henning & Stecklum (1999) Wolf, S., Henning, Th. & Stecklum, B. 1999, A&A, 349, 839
- Wolf (2003) Wolf, S. 2003, ApJ, 582, 859