1-4
Herschel observations of PNe
in the
MESS key program
Abstract
In this paper we give a progress report on the Herschel observations of planetary nebulae that are carried out as part of the MESS guaranteed time key program.
keywords:
planetary nebulae: individual (NGC 6720, NGC 650, NGC 6853, NGC 7027) — dust, extinction — molecules — infrared: ISM1 Introduction
As part of the MESS (Mass loss of Evolved StarS) Herschel guaranteed time key program (PI Martin Groenewegen) we are observing a sample of planetary nebulae (PNe) in photometric and/or spectroscopic mode with the PACS ([bla, Poglitsch et al. 2010]) and SPIRE ([bla, Griffin et al. 2010]) instruments on board the Herschel satellite ([bla, Pilbratt et al. 2010]). The aims of the MESS program are threefold. 1) Study the time dependence of the mass loss process via a search for shells and multiple shells. 2) Study the dust and gas chemistry as a function of progenitor mass. 3) Study the properties and asymmetries of a representative sample of evolved objects. The program covers many phases of stellar evolution: AGB & post-AGB stars, PNe, massive stars, and supernovae. It is described in [bla, Groenewegen et al. (2011)]. In Table 1 we present an overview of the Herschel observations that have been taken or are planned for the PNe in our sample.
All targets have been imaged in scan map (SM) mode, except NGC 7293 which was observed in parallel mode (PM). With PACS we have obtained images in the 70 and 160 m bands (beam size: 5.2′′ and 12′′, respectively), with SPIRE we have obtained all 3 bands: 250, 350, and 500 m (beam size: 18.1′′, 25.2′′, and 36.6′′, respectively). For all spectroscopic targets we obtain full spectral scans, covering the wavelength range 51–98 + 103–192 m for PACS and 196–667 m for SPIRE.
2 Results
Below we will discuss preliminary results of selected objects of our sample.
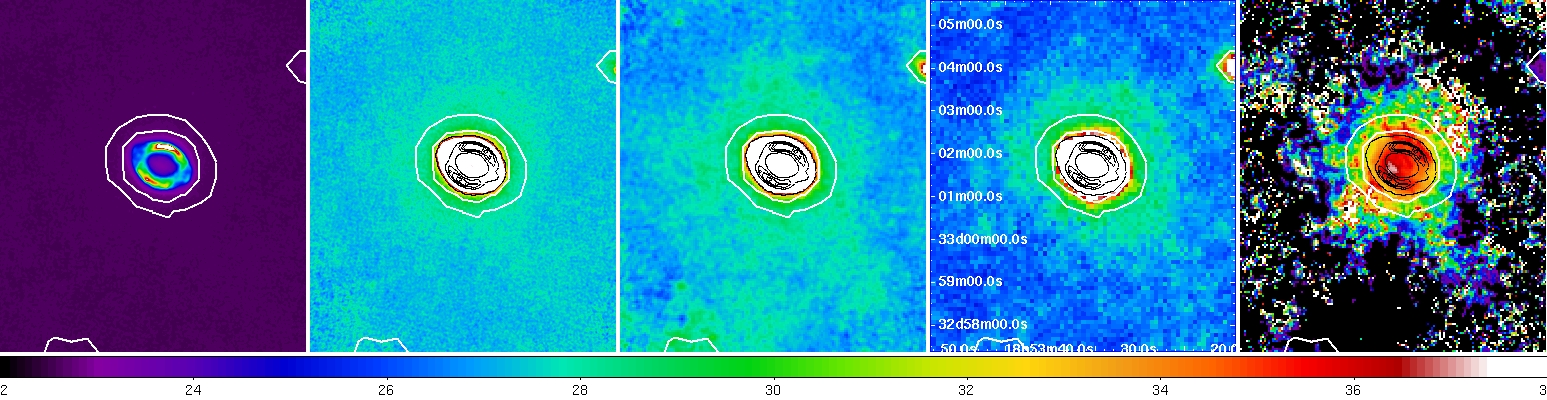
NGC 6720 (the Ring nebula). This PN (shown in Fig. 1) is very similar to NGC 7293 (the Helix nebula). It seems they follow the same evolutionary path. The Helix nebula has very strong H2 emission [st87, (Storey et al. 1987)]. A static photoionization model cannot explain this emission, but a hydrodynamic model can ([Heney07, Henney et al. 2007]). This model indicates that the erosion of the knots by the radiation field of the central star is substantial: between 10-10 and 10-9 M⊙ yr-1 despite the low luminosity of the central star (120 L⊙). Considering the fact that the central star luminosity was much higher in the past and the knots must have been closer to the central star, survival of the knots from the AGB phase (as was e.g. proposed by [bla, Matsuura et al. 2009]) to the current time seems problematic. However, more detailed modeling is warranted.
We have developed a photoionization model of the Ring nebula with Cloudy, last described by [bla, Ferland et al. (1998)], which we used to investigate possible formation scenarios for H2. We conclude that the most plausible scenario is that the H2 resides in high density knots which were formed after the recombination of the gas started when the central star luminosity dropped steeply around 1000-2000 years ago. The models show that H2 formation in the knots is expected to be substantial since then, and may well still be ongoing at this moment. For a more detailed discussion see [bla, van Hoof et al. (2010)].
| target | observation type (date) |
|---|---|
| NGC 650 | PACS SM (2010-02-23), SPIRE SM (2010-08-24) |
| NGC 3587 | PACS SM (2010-06-21), SPIRE SM (2010-05-08) |
| NGC 6302 | PACS RS (tbd), SPIRE RS (2010-02-26) |
| NGC 6537 | PACS RS (tbd), SPIRE RS (tbd) |
| NGC 6543 | PACS SM (2011-05-07), SPIRE SM (2009-12-26), PACS RS (2009-06-23) |
| NGC 6720 | PACS SM (2009-10-10), SPIRE SM (2009-10-06) |
| NGC 6853 | PACS SM (2010-04-04), SPIRE SM (2010-10-11) |
| NGC 7027 | PACS SM (2010-05-05), PACS RS (2009-11-12), SPIRE RS (2010-01-09) |
| NGC 7293 | PACS+SPIRE PM (2010-04-28) |
| IRAS 22036+5306 | PACS SM (2010-06-22) |
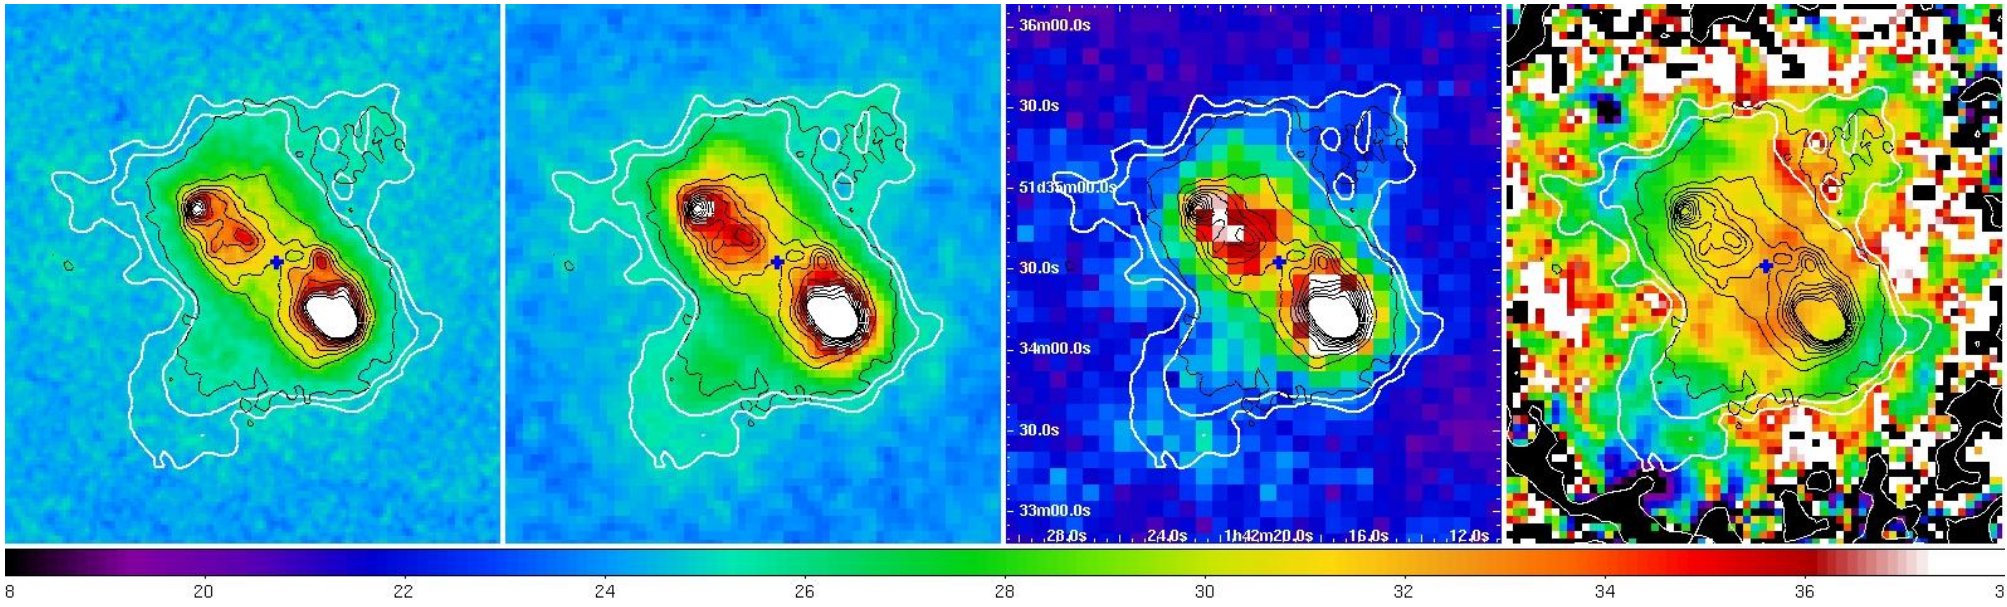
NGC 650 (the Little Dumbbell nebula). This is a bipolar nebula. We can clearly see the edge-on equatorial density enhancement. The blobs towards the SE and NW are detected, though faint. The bipolar lobes themselves are not detected. In Fig. 2 we show the PACS 70 and 160 m and SPIRE 250 m images, as well as the temperature map of the dust created from the PACS 70 / 160 m ratio image, after convolution to the same point spread function (PSF). The black contours are taken from the PACS 70 m image to indicate the position of the torus. The shadowing effect of the torus is clearly visible: the regions at the outer edge of the torus and beyond are clearly cooler than the dust in other directions. The dust grains are primarily heated by UV photons, either emitted by the central star, or diffuse emission from the gas (e.g., Ly photons). Hence there must be substantial extinction of UV photons inside the torus, despite the rather low density of these regions (140–400 cm-3, [bla, Minkowski & Osterbrock 1960]).
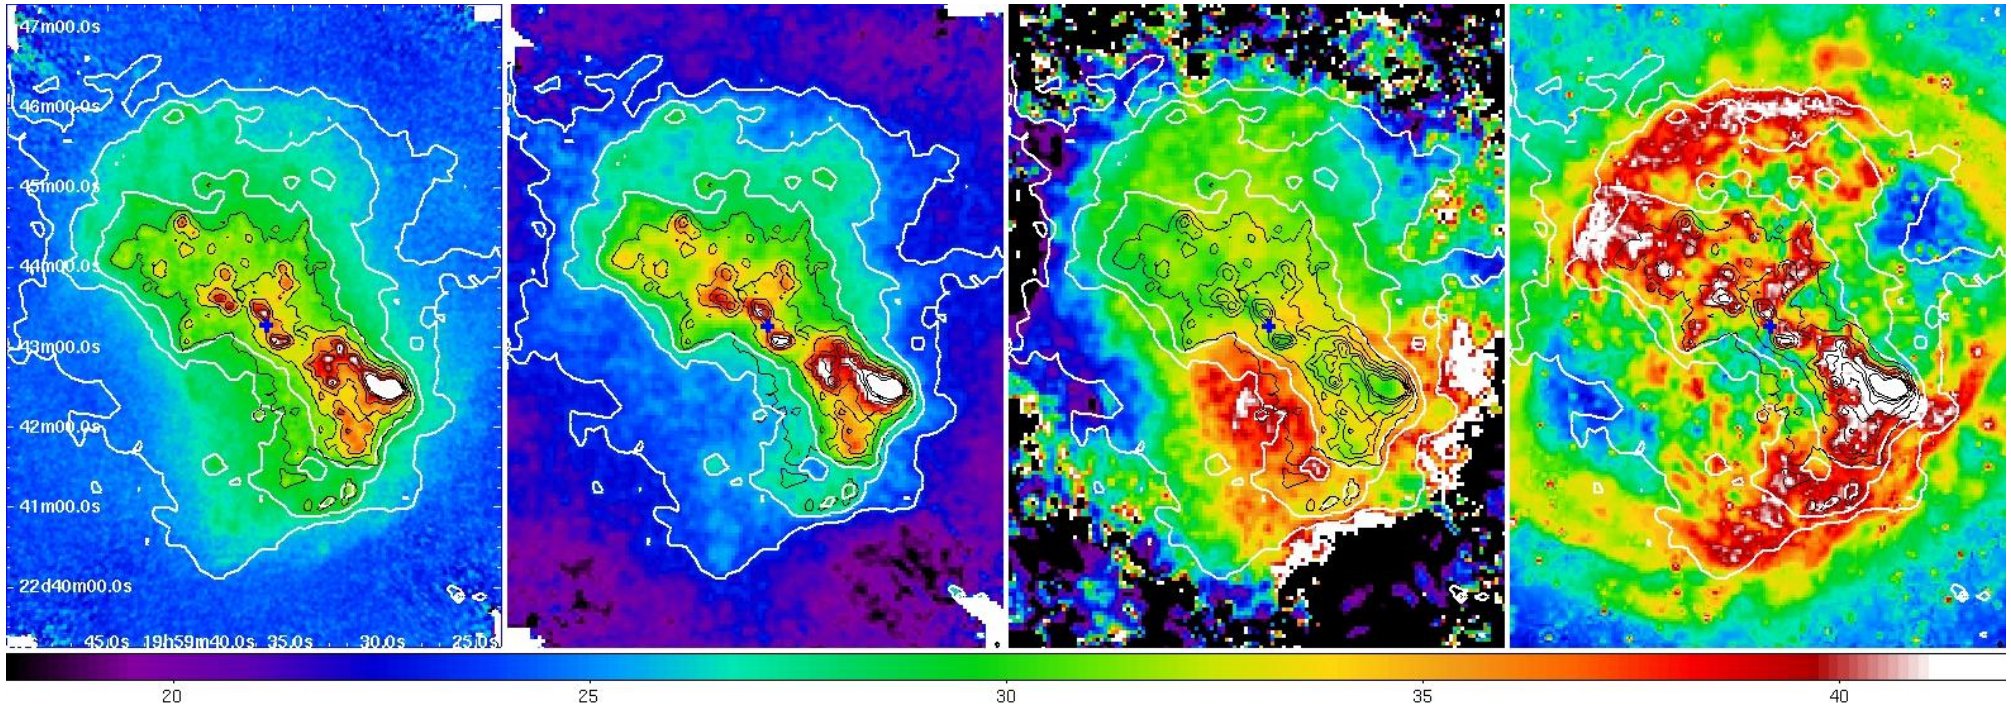
NGC 6853 (the Dumbbell nebula). Also in this PN we see a detailed match between the dust emission in the PACS image and the H2 emission from ground based imaging, showing the close association of the dust and the H2. In Fig. 3 we show the PACS images of this source, as well as the temperature map derived from the PACS 70 / 160 m ratio image after convolution to the same PSF. The black contours are taken from the PACS 70 m image to indicate the position of the high density regions. It is clear that there is a strong correlation between the high-density regions and the colder dust. The hot patch towards the south appears to be real and has no counterpart in the north. Presumably this is material that is directly irradiated by the central star.
NGC 7027. In the PACS and SPIRE spectra of this PN we see atomic lines from H i, [C i], [C ii], [N ii], [N iii], [O i], [O iii] and molecular lines from 12CO, 13CO, OH, H2O, CH, CH+, C2H, HCN, HCO+, and possibly CN and OH+. Oxygen-rich molecules can be formed because the harsh radiation field keeps CO partially dissociated throughout the photo-dissociation region (PDR).
Using the photoionization code Cloudy we have created a preliminary model of the ionized region and the PDR of NGC 7027. Using either a constant density or a constant pressure density law, we could not produce a satisfactory fit to both the ionized region and the PDR. If on the other hand we use a piecewise constant density law with different densities in the ionized region and the PDR, we get a much better fit. This model indicates that the density in the PDR is much higher than in the ionized region (7.9105 and 3.3104 cm-3, respectively). This density contrast is the result of the heating by the photoionization process, causing the gas to expand. From our modeling efforts it becomes clear that the gas cannot be in pressure equilibrium.


3 Summary
For most PNe we see a detailed match between the FIR dust emission and the H2 emission, showing that the dust and H2 are closely associated. In the case of NGC 6720 this close association provides the first observational evidence for H2 formation on oxygen-rich dust grains in an astrophysical environment. Using Cloudy models we conclude that the most likely scenario is that in NGC 6720 H2 formed (and may still be forming now) inside dense knots that started to form after recombination of the nebula started 1000-2000 years ago. We produced temperature maps from the PACS 70 / 160 m ratio images which show a rich structure. They indicate that internal extinction in the UV is important, despite the highly evolved status of the nebulae. Many molecules were detected in the spectra of NGC 7027 and NGC 6302. A preliminary Cloudy photoionization / PDR model of NGC 7027 indicates that the PDR has higher density than the ionized region and the nebula is not in pressure equilibrium.
Acknowledgements.
PvH acknowledges support from Belspo through the ESA PRODEX Programme.References
- [bla] Ferland, G.J., Korista, K.T., Verner, D.A. et al., 1998, PASP, 110, 761
- [bla] Griffin, M.J., Abergel, A., Abreu, A. et al., 2010, A&A, 518, L3
- [bla] Groenewegen, M.A.T., Waelkens, C., Barlow, M.J. et al. 2011, A&A, 526, A162
- [bla] Henney, W.J., Williams, R.J.R., Ferland, G.J., Shaw, G. & O’Dell, C.R., 2007, ApJ, 671, L137
- [bla] Matsuura, M., Speck, A.K., McHunu, B.M. et al., 2009, ApJ, 700, 1067
- [bla] Minkowski, R. & Osterbrock, D., 1960, ApJ, 131, 537
- [bla] Pilbratt, G.L., Riedinger, J.R., Passvogel, T. et al., 2010, A&A, 518, L1
- [bla] Poglitsch, A., Waelkens, C., Geis, N. et al., 2010 A&A, 518, L2
- [bla] Storey, J.W.V., Webster, B.L., Payne, P. & Dopita, M.A., 1987, IAU Symp. 120, p. 339
- [bla] van Hoof, P.A.M., Van de Steene, G.C., Barlow, M.J. et al., 2010, A&A, 518, L137