Robustness of Social Networks:
Comparative Results
Based on Distance Distributions
Abstract
Given a social network, which of its nodes have a stronger impact in determining its structure? More formally: which node-removal order has the greatest impact on the network structure? We approach this well-known problem for the first time in a setting that combines both web graphs and social networks, using datasets that are orders of magnitude larger than those appearing in the previous literature, thanks to some recently developed algorithms and software tools that make it possible to approximate accurately the number of reachable pairs and the distribution of distances in a graph. Our experiments highlight deep differences in the structure of social networks and web graphs, show significant limitations of previous experimental results, and at the same time reveal clustering by label propagation as a new and very effective way of locating nodes that are important from a structural viewpoint.
1 Introduction
In the last years, there has been an ever-increasing research activity in the study of real-world complex networks [WF94] (the world-wide web, the Internet autonomous-systems graph, coauthorship graphs, phone call graphs, email graphs and biological networks, to cite a few). These networks, typically generated directly or indirectly by human activity and interaction, appear in a large variety of contexts and often exhibit a surprisingly similar structure. One of the most important notions that researchers have been trying to capture is “node centrality”: ideally, every node (often representing an individual) has some degree of influence or importance within the social domain under consideration, and one expects such importance to be reflected in the structure of the social network; centrality is a quantitative measure that aims at revealing the importance of a node.
Among the types of centrality that have been considered in the literature (see [Bor05] for a good survey), many have to do with shortest paths between nodes; for example, the betweenness centrality of a node is the sum, over all pairs of nodes and , of the fraction of shortest paths from to passing through . The role played by shortest paths is justified by one of the most well known features of complex networks, the so-called small-world phenomenon.
A small-world network [CH10] is a graph where the average distance between nodes is logarithmic in the size of the network, whereas the clustering coefficient is large (that is, neighbourhoods tend to be denser) than in a random Erdős-Rényi graph with the same size and average distance.111The reader might find this definition a bit vague, and some variants are often spotted in the literature: this is a general problem, also highlighted recently in [LADW05]. Here, and in the following, by “distance” we mean the length of the shortest path between two nodes. The fact that social networks (either electronically mediated or not) exhibit the small-world property is known at least since Milgram’s famous experiment [Mil67] and is arguably the most popular of all features of complex networks.
Based on the above observation that the small-world property is by far the most crucial of all the features that social networks exhibit, it is quite natural to consider centrality measures that are based on node distance, like betweenness. On the other hand, albeit interesting and profound, such measures are often computationally too expensive to be actually computed on real-world graphs; for example, the best known algorithm to compute betweenness centrality [Bra01] takes time and requires space for integers (where is the number of nodes and is the number of arcs): both bounds are infeasible for large networks, where typically and . For this reason, in most cases other strictly local measures of centrality are usually preferred (e.g., degree centrality).
One of the ideas that have emerged in the literature is that node centrality can be evaluated based on how much the removal of the node “disrupts” the graph structure [AJB00]. This idea provides also a notion of robustness of the network: if removing few nodes has no noticeable impact, then the network structure is clearly robust in a very strong sense. On the other hand, a node-removal strategy that quickly affects the distribution of distances probably reflects an importance order of the nodes.
Previous literature has used mainly the diameter or some analogous measure to establish whether the network structure changed. Recently, though, there have been some successful attempts to produce reliable estimates of the neighbourhood function of very large graphs [PGF02, BRV11a]; an immediate application of these approximate algorithms is the computation of the number of reachable pairs of the graph (the number of pairs such there is a directed path from to ) and its distance distribution (the distance distribution of a graph is a discrete distribution that gives, for every , the fraction of pairs of nodes that are at distance ). From this data, a number of existing measures can be computed quickly and accurately, and new one can be conceived.
We thus consider a certain ordering of the nodes of a graph (that is supposed to represent their “importance” or “centrality”). We remove nodes (and of course their incident arcs) following this order, until a certain percentage of the arcs have been deleted222Observe that we delete nodes but count the percentage of arcs removed, and not of nodes: this choice is justified by the fact that otherwise node orderings that put large-degree nodes first would certainly be considered (unfairly) more disruptive.; finally, we compare the number of reachable pairs and distance distribution of the new graph with the original one. The chosen ordering is considered to be a reliable measure of centrality if the measured difference increases rapidly with (i.e., it is sufficient to delete a small fraction of important nodes to change the structure of the graph).
In this work, we applied the described approach to a number of complex networks, considering different orderings, and obtained the following results:
-
•
In all complex networks we considered, the removal of a limited fraction of randomly chosen nodes does not change the distance distribution significantly, confirming previous results.
-
•
We test strategies based on PageRank and on clustering (see Section 4.1 for more information about this), and show that they (in particular, the latter) disrupt quickly the structure of a web graph.
-
•
Maybe surprisingly, none of the above strategies seem to have an impact when applied to social networks other than web graphs. This is yet another example of a profound structural difference between web graphs and social networks,333We remark that several proposals have been made to find features that highlight such structural differences in a computationwise-feasible way (e.g., assortative mixing [NP03]), but all instances we are aware of have been questioned by the subsequent literature, so no clear-cut results are known as yet. on the same line as those discussed in [BRV11a] and [CKL+09]. This observation, in particular, suggests that social networks tend to be much more robust and cohesive than web graphs, at least as far as distances are concerned, and that “scale-free” models, which are currently proposed for both type of networks, do not to capture this important difference.
2 Related work
The idea of grasping information about the structure of a network by repeatedly removing nodes out of it is not new: Albert, Jeong and Barabási [AJB00] study experimentally the variation of the diameter on two different models of undirected random graphs when nodes are removed either randomly or in “connectedness order” and report different behaviours. They also perform tests on some small real data set, and we will compare their results with ours in Section 6.
More recently, node-centrality measures that look at how some graph invariant changes when some vertices or edges are deleted (sometimes called “vitality” [BE05] or “induced” measures) have been studied for example in [Bor06] (identifying nodes that maximally disconnect the network) or in [BCK06] (related to the uncertainty of data).
Donato, Leonard, Millozzi and Tsaparas [DLMT08] study how the size of the giant component changes when nodes of high indegree or outdegree are removed from the graph. While this is an interesting measure, it does not provide information about what happens outside the component. They develop a library for semi-external visits that make it possible to compute in an exact way the strongly connected components on large graphs.
Finally, Fogaras [Fog03] considers how the harmonic diameter444Actually, the notion had been introduced before by Marchiori and Latora and named connectivity length [ML00], but we find the name “harmonic diameter” much more insightful. (the harmonic mean of the distances) changes as nodes are deleted from a small (less than one million node) snapshot of the .ie domain, reporting a large increase (100%) when as little as 1000 nodes with high PageRank are removed. The harmonic diameter is estimated by a small number of visits, however, which gives no statistical guarantee on the accuracy of the results.
Our study is very different. First of all, we use graphs that are two orders of magnitude larger than those considered in [AJB00] or [Fog03]; moreover, we study the impact of node removal on the whole spectrum of distances. Second, we apply removal procedures to large social networks (previous literature used only web or Internet graphs), and the striking difference in behaviour shows that “scale-free” models fail to capture essential differences between these kind of networks and web graphs. Third, we document in a reproducible way all our experiments, which have provable statistical accuracy.
3 Computing the distance distribution
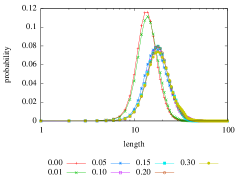
Given a directed graph , its neighbourhood function returns for each the number of pairs of nodes such that is reachable from in no more than steps. From the neighbourhood function, several interesting features of a graph can be estimated, and in this paper we are especially interested in the distance distribution of the graph , represented by the cumulative distribution function , which returns the fraction of reachable pairs at distance at most , that is, . The corresponding probability density function will be denoted by .
Recently, HyperANF [BRV11a] emerged as an evolution of the ANF tool [PGF02]. HyperANF can compute for the first time in a few hours the neighbourhood function of graphs with billions of nodes with a small error and good confidence using a standard workstation. The free availability of HyperANF opens new and interesting ways to study large graphs, of which this paper is an example.
4 Removal strategies and their analysis
In the previous section, we discussed how we can effectively approximate the distance distribution of a given graph ; we shall use such a distribution as the graph structural property of interest.
Consider now a given total order on the nodes of ; we think of as a removal strategy in the following sense: when we want to remove arcs, we start removing the -largest node (and its incident arcs), go on removing the second--largest node etc. and stop as soon as arcs have been removed. The resulting graph will be denoted by . Of course, whereas is the empty graph. We are interested in applying some measure of divergence555We purposedly use the word “divergence” between distributions, instead of “distance”, to avoid confusion with the notion of distance in a graph. between the distribution and the distribution . By looking at the divergence when varies, we can judge the ability of to identify nodes that will disrupt the network.
4.1 Some removal strategies
We considered several different strategies for removing nodes from a graph. Some of them embody actually significant knowledge about the structure of the graph, whereas others are very simple (or even independent of the graph) and will be used as baseline. Some of them have been used in the previous literature, and will be useful to compare our results.
As a first observation, some strategies requires a symmetric graph (a.k.a., undirected). In this case, we symmetrise the graph by adding the missing arcs666It is mostly a matter of taste whether to use directed symmetric graphs or simple undirected graphs. In our case, since we have to cope with both directed and undirected graph, we prefer to speak of directed graphs that are symmetric, that is, for every arc there is a symmetric arc ..
The second obvious observation is that some strategies might depend on available metadata (e.g., URLs for web graphs) and might not make sense for all graphs.
- Random.
-
No strategy: we pick random nodes and remove them from the graph. It is important to test against this “nonstrategy” as we can show that the phenomena we observe are due to the peculiar choice of nodes involved, and not to some generic property of the graph.
- Largest-degree first.
-
We remove nodes in decreasing (out)degree order. This strategy is an obvious baseline, as degree centrality is the first shot at centrality in a network.
- Near-Root.
-
In web graphs, we can assume that nodes that are roots of web sites and their (quasi-)immediate successors (e.g., pages linked by the root) are most important in establishing the distance distribution, as people tend to link higher levels of web sites. This strategy removes essentially first root nodes, then the nodes that are children of a root on, and so on.
- PageRank.
-
PageRank [PBMW98] is an well-known algorithm that assigns ranks to nodes using a Markov chain based on the structure of the graph. It has been designed as an improvement over degree centrality, because nodes with high degree which however are connected to nodes of low rank will have a rather low rank, too (the definition is indeed recursive). There is a vast body of literature on the subject: see [BSV09, LM04] and the references therein.
- Label propagation.
-
Label propagation [RAK07] is a powerful technique for clustering symmetric graphs. Each node has a label (initially, the node number itself) and through a number of rounds each node changes its label by taking the label of the majority of its neighbours. At the end, node labels are used as cluster identifiers. Our removal strategy picks first, for each cluster in decreasing size order, the node with the highest number of neighbours in other clusters: intuitively, it is a representative of a set of tightly connected nodes (the cluster) which however has a very significant connection with the outside world (the other clusters) and thus we expect that its removal should seriously disrupt the distance distribution. Once we have removed all such nodes, we proceed again, cluster by cluster, using the same criterion (thus picking the second node of each cluster that has more connection towards other clusters), and so on.
4.2 Measures of divergence
Once we changed the structure of a graph by deleting some of its nodes (and arcs), there are several ways to measure whether the structure of the graph has significantly changed. The first, basic raw datum we consider is the number of pairs of nodes that are still reachable divided by the number of pairs initially reachable, expressed as a percentage. Then, to estimate the change of the distance distribution we considered the following possibilities (here denotes the original distance distribution, and the distribution after node removal):
- Relative average-distance change.
-
This is somehow the simplest and most natural measure: how much has the average distance changed? We use the measure
where denotes the average; in other words, we measure how much the average value changed. This measure is non-symmetric, but it is of course easy to obtain from .
- Relative harmonic-diameter change.
-
This measure is analogous to the relative average-distance change, but the average on distances is harmonic and computed on all pairs, that is:
where is the number of nodes of the graph. This measure, used in [Fog03], combines reachability information, as unreachable pairs contribute zero to the sum. It is easily computable from the neighbourhood function, as shown above.
- Kullback-Leibler divergence.
-
This is a measure of information gain, in the sense that it gives the number of additional bits that are necessary to code samples drawn from when using an optimal code for . Also this measure is non-symmetric, but there is no way obtain the divergence from to given that from to .
- norms.
-
A further alternative is given by viewing distance distributions as functions and measure their distance using some -norm, most notably or . Such distances are of course symmetric.
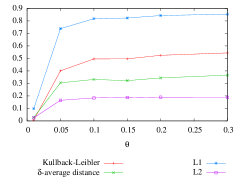
We tested, with various graphs and removal strategies, how the choice of distribution divergence influences the interpretation of the results obtained. In Figure 1 we show this for a single web graph and a single strategy, but the outcomes agree on all the graphs and strategies tested: the interpretation is that all divergences agree, and for this reason we shall use the (simple) measure applied to the average distance in the experimental section. The advantage of over the other measures is that it is very easy to interpret; for example, if has value, say, it means that node removal has increased the average distance by . We also discuss applied to the harmonic diameter.
|
5 Experiments
For our experiments, we considered a number of networks with various sizes and characteristics; most of them are either web graphs or (directed or undirected) social graphs of some kind (note that for web graphs we can rely on the URLs as external source of information). More precisely, we used the following datasets:
-
•
Hollywood: One of the most popular undirected social graphs, the graph of movie actors: vertices are actors, and two actors are joined by an edge whenever they appeared in a movie together.
-
•
LiveJournal: LiveJournal is a virtual community social site started in 1999: nodes are users and there is an arc from to if registered among his friends (it is not necessary to ask permission, so the graph is directed). We considered the same 2008 snapshot of LiveJournal used in [CKL+09] for their experiments
-
•
Amazon: This dataset describes similarity among books as reported by the Amazon store; more precisely the data was obtained in 2008 using the Amazon E-Commerce Service APIs using SimilarityLookup queries.
-
•
Enron: This dataset was made public by the Federal Energy Regulatory Commission during its investigations: it is a partially anonymised corpus of e-mail messages exchanged by some Enron employees (mostly part of the senior management). We turned this dataset into a directed graph, whose nodes represent people and with an arc from to whenever was the recipient of (at least) a message sent by .
-
•
For comparison, we considered two web graphs of different size: a 2004 snapshot of the .it domain ( million nodes), and a snapshot taken in May 2007 of the .uk domain ( million nodes).
We remark that all our graphs are available at the LAW web site.777http://law.dsi.unimi.it/. In particular, the graphs we used are the datasets named hollywood-2009, ljournal-2008, amazon-2008, enron, it-2004 and uk-2007-05. HyperANF is available as free software at the WebGraph web site888http://webgraph.dsi.unimi.it/, and the class RemoveHubs that has been used to perform the experiments we describe is part of the LAW software.
We applied our removal strategies with different impact levels (e.g., percentage of removed arcs), namely , , , , and . For each level we ran HyperANF at least seven times using 128 registers per counter: the percentage of reachable pair displayed in our tables has been obtained by averaging the neighbourhood functions obtained from the runs, with relative standard deviation smaller than (e.g., the measure is within relative error with confidence). The starting number of reachable pairs is known with relative standard deviation smaller than . The remaining derived measurements (average distances and harmonic diameters) have been computed separately on each run, and the resulting relative standard deviation is less than for the average distance, and less than for the harmonic diameter, except for about a dozen measurements, where it is less than for the average distance, and less than for the harmonic diameter.999Unfortunately, estimating with precision the harmonic diameter is difficult due to the nonlinearity of its definition. Our tables and graphs slightly differs from those previously published [BRV11b] because we had time to generate more runs, and thus increase the precision of our results: some variation is also observed because of the relatively small number of runs (unavoidable, due to the large number of graphs to be analyzed).
Amazon
.it
| Graph | Strategy | ||||||||||||
|---|---|---|---|---|---|---|---|---|---|---|---|---|---|
| Amazon | Random | ||||||||||||
| Degree | |||||||||||||
| PR | |||||||||||||
| LP | |||||||||||||
| Enron | Random | ||||||||||||
| Degree | |||||||||||||
| PR | |||||||||||||
| LP | |||||||||||||
| Hollywood | Random | ||||||||||||
| Degree | |||||||||||||
| PR | |||||||||||||
| LP | |||||||||||||
| LiveJournal | Random | ||||||||||||
| Degree | |||||||||||||
| PR | |||||||||||||
| LP | |||||||||||||
| .it | Random | ||||||||||||
| Degree | |||||||||||||
| PR | |||||||||||||
| LP | |||||||||||||
| Near-Root | |||||||||||||
| .uk | Random | ||||||||||||
| Degree | |||||||||||||
| PR | |||||||||||||
| LP | |||||||||||||
| Near-Root | |||||||||||||
6 Discussion
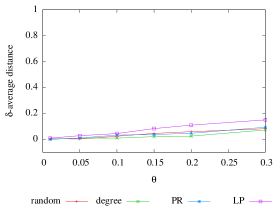
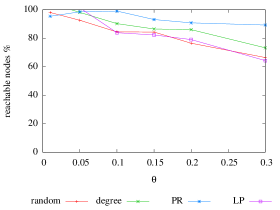
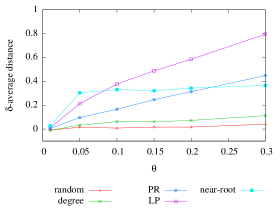
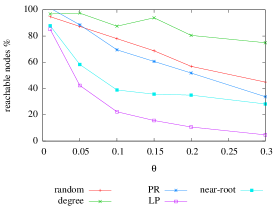
Table 5 and Figure 2 show that social networks suffer spectacularly less disconnection than web graphs when their nodes are removed using our strategies. Our most efficient removal strategy, label propagation, can disconnect almost all pairs of a web graph by removing 30% of the arcs, whereas it disconnects only about half (or less) of the pairs on social networks. This entirely different behaviour shows that web graphs have a path structure that passes through fundamental hubs.
Moreover, the average distance of the web graphs we consider increases by 5080% upon removal of 30% of the arcs, whereas in most social networks there is just an increase of a few percents (in any case, always less than ).101010We remark that in some cases the measure is negative or does not decrease monotonically. This is an artifact of the probabilistic technique used to estimate the number of pairs—small relative errors are unavoidable.
Note that random removal can separate a good number of reachable pairs, but the increase in average distance is very marginal. This shows that considering both measures is important in evaluating removal strategies.
Of course, we cannot state that there is no strategy able to disrupt social networks as much as a web graph (simply because this strategy may be different from the ones that we considered), but the fact all strategies work very similarly in both cases (e.g., label propagation is by far the most disruptive strategy) suggests that the phenomenon is intrinsic.
There is a candidate easy explanation: shortest paths in web graphs pass frequently through home pages, which are linked more than other pages. But this explanation does not take into account the fact that clustering by label propagation is significantly more effective than the near-root removal strategy. Rather, it appears that there are fundamental hubs (not necessarily home pages) which act as shortcuts and through which a large number of shortest paths pass. Label propagation is able to identify such hubs, and their removal results in an almost disconnected graph and in a very significant increase in average distance.
These hubs are not necessarily of high outdegree: quite the opposite, rather, is true. The behaviour of web graphs under the largest-degree strategy is illuminating: we obtain the smallest reduction in reachable pairs and an almost unnoticeable change of the average distance, which means that nodes of high outdegree are not actually relevant for the global structure of the network.
Social networks are much more resistant to node removal. There is no strict clustering, nor definite hubs, that can be used to eliminate or elongate shortest paths. This is not surprising, as networks emerging from social interaction are much less engineered (there is no notion of “site” or “page hierarchy”, for example) than web graphs.
The second important observation is that the removal strategies based on PageRank and label propagation are always the best (with the exception of the near-root strategy for .uk, which is better than PageRank). This suggests that label propagation is actually able to identify structurally important nodes in the graph—in fact, significantly better than any other method we tested.
Is the ranking provided by label propagation correlated to other rankings? Certainly not to the other rankings described in this paper, due to the different level of disruption it produces on the network. The closest ranking with similar behaviour is PageRank, but, for instance, Kendall’s between PageRank and ranking by label propagation on the .uk dataset is (complete uncorrelation).
It is interesting to compare our results against those in the previous literature. With respect to [AJB00], we test much larger networks. We can confirm that random removal is less effective that rank-based removal, but clearly the variation in diameter measured in [AJB00] has been made on a symmetrised version of the web graph. Symmetrisation destroys much of the structure of the network, and it is difficult to justify (you cannot navigate links backwards). We have evaluated our experiment using the variation in diameter instead of the variation in average distance (not shown here), but the results are definitely inconclusive. The behaviour is wildly different even between graphs of the same type, and shows no clear trend. This was expected, as the diameter is defined by a maximisation property, so it is very unstable.
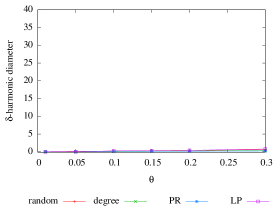
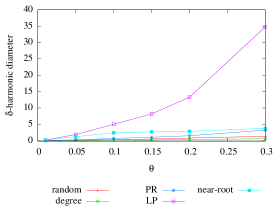
We also evaluated the variation in harmonic diameter (see Table 5), to compare our results with those of [Fog03]. The harmonic diameter is very interesting, as it combines reachability and distance. The data confirm what we already stated: web graphs react to removal of 30% of their arcs by label propagation by increasing their harmonic diameter by an order of magnitude—something that does not happen with social networks. Table 5 is even more striking than Table 5 in showing that label propagation selects highly disruptive nodes in web graphs.
Our criterion for node elimination is a threshold on the number of arcs removed, rather than nodes, so it is not possible to compare our results with [Fog03] directly. However, for .uk PageRank at removes 648 nodes, which produced in the .ie graph a relative increment of 100%, whereas we find 14%. This is to be expected, due to the very small size of the dataset used in [Fog03]: experience shows that connectedness phenomena in web graphs are very different in the “below ten million nodes” region. Nonetheless, the growth trend is visibile in both cases. However, the experiments in [Fog03] fail to detect both the disruptive behaviour at and the striking difference in behaviour between largest-degree and PageRank strategy.
7 Conclusions and future work
We have explored experimentally the alterations of the distance distribution of some social networks and web graphs under different node-removal strategies. We have confirmed some of the experimental results that appeared in the literature, but at the same time shown some basic limitations of previous approaches. In particular, we have shown for the first time that there is a clear-cut structural difference between social networks and web graphs111111In this paper, like in all the other experimental research on the same topic, conclusions about social networks should be taken with a grain of salt, due to the heterogeneity of such networks and the lack of a large repertoire of examples., and that it is important to test node-removal strategies until a significant fraction of the arcs have been removed.
Probably the most important conclusion is that “scale-free” models, which are currently proposed for both web graphs and social networks, do not to capture this important difference: for this reason, they can only make sense as long as they are adopted as baselines.
It might be argued that reachable pairs and distance distributions are too coarse as a feature. Nonetheless, we believe that they are the most immediate global feature that are approachable computationally. For instance, checking whether node removal alters the clustering coefficient would not be so interesting, because the clustering coefficient of each node depends only on the structure of the neighbourhood of each node. Thus, by removing first the nodes with high coefficient it would be trivial to make the clustering coefficient of the graph decrease quickly. Such trivial approaches cannot possibly work with reachable pairs or with distance distributions because they are properties that depend on the graph as a whole.
Finally, the efficacy of label propagation as a removal strategy suggests that it may be very interesting to study it as a form of ranking: an open question is whether it could be useful, for instance, as a query-independent ranking for information-retrieval applications.
References
- [AJB00] Réka Albert, Hawoong Jeong, and Albert-László Barabási. Error and attack tolerance of complex networks. Nature, 406:378–382, 2000.
- [BCK06] Stephen P. Borgatti, Kathleen M. Carley, and David Krackhardt. On the robustness of centrality measures under conditions of imperfect data. Social Networks, 28(2):124–136, 2006.
- [BE05] Ulrik Brandes and Thomas Erlebach. Network Analysis: Methodological Foundations (Lecture Notes in Computer Science). Number 3418 in Lecture Notes in Computer Science. Springer-Verlag, 2005.
- [Bor05] Stephen P. Borgatti. Centrality and network flow. Social Networks, 27(1):55–71, 2005.
- [Bor06] Stephen P. Borgatti. Identifying sets of key players in a social network. Comput. Math. Organ. Theory, 12:21–34, April 2006.
- [Bra01] Ulrik Brandes. A faster algorithm for betweenness centrality. Journal of Mathematical Sociology, 25(2):163–177, 2001.
- [BRV11a] Paolo Boldi, Marco Rosa, and Sebastiano Vigna. HyperANF: Approximating the neighbourhood function of very large graphs on a budget. In Sadagopan Srinivasan, Krithi Ramamritham, Arun Kumar, M. P. Ravindra, Elisa Bertino, and Ravi Kumar, editors, Proceedings of the 20th international conference on World Wide Web, pages 625–634. ACM, 2011.
- [BRV11b] Paolo Boldi, Marco Rosa, and Sebastiano Vigna. Robustness of social networks: Comparative results based on distance distributions. In Social Informatics, Third International Conference, SocInfo 2011, volume 6894 of Lecture Notes in Computer Science, pages 8–21. Springer, 2011.
- [BSV09] Paolo Boldi, Massimo Santini, and Sebastiano Vigna. PageRank: Functional dependencies. ACM Trans. Inf. Sys., 27(4):1–23, 2009.
- [CH10] Reuven Cohen and Shlomo Havlin. Complex Networks: Structure, Robustness and Function. Cambridge University Press, 2010.
- [CKL+09] Flavio Chierichetti, Ravi Kumar, Silvio Lattanzi, Michael Mitzenmacher, Alessandro Panconesi, and Prabhakar Raghavan. On compressing social networks. In KDD ’09: Proceedings of the 15th ACM SIGKDD international conference on Knowledge discovery and data mining, pages 219–228, New York, NY, USA, 2009. ACM.
- [DLMT08] Debora Donato, Stefano Leonardi, Stefano Millozzi, and Panayiotis Tsaparas. Mining the inner structure of the web graph. Journal of Physics A: Mathematical and Theoretical, 41(22):224017, 2008.
- [Fog03] Dániel Fogaras. Where to start browsing the web? In Innovative Internet Community Systems, Third International Workshop, IICS 2003, volume 2877 of Lecture Notes in Computer Science, pages 65–79. Springer, 2003.
- [LADW05] Lun Li, David L. Alderson, John Doyle, and Walter Willinger. Towards a theory of scale-free graphs: Definition, properties, and implications. Internet Math., 2(4), 2005.
- [LM04] Amy N. Langville and Carl D. Meyer. Deeper inside PageRank. Internet Mathematics, 1(3):355–400, 2004.
- [Mil67] Stanley Milgram. The small world problem. Psychology Today, 2(1):60–67, 1967.
- [ML00] Massimo Marchiori and Vito Latora. Harmony in the small-world. Physica A: Statistical Mechanics and its Applications, 285(3-4):539 – 546, 2000.
- [NP03] Mark E. J. Newman and Juyong Park. Why social networks are different from other types of networks. Phys. Rev. E, 68(3):036122, 2003.
- [PBMW98] Lawrence Page, Sergey Brin, Rajeev Motwani, and Terry Winograd. The PageRank citation ranking: Bringing order to the web. Technical report, Stanford Digital Library Technologies Project, Stanford University, Stanford, CA, USA, 1998.
- [PGF02] Christopher R. Palmer, Phillip B. Gibbons, and Christos Faloutsos. Anf: a fast and scalable tool for data mining in massive graphs. In KDD ’02: Proceedings of the eighth ACM SIGKDD international conference on Knowledge discovery and data mining, pages 81–90, New York, NY, USA, 2002. ACM.
- [RAK07] Usha N. Raghavan, Réka Albert, and Soundar Kumara. Near linear time algorithm to detect community structures in large-scale networks. Physical Review E (Statistical, Nonlinear, and Soft Matter Physics), 76(3), 2007.
- [WF94] Stanley Wasserman and Katherine Faust. Social network analysis: Methods and applications. Cambridge Univ Press, 1994.