On Ly emission in 3–6 UV-selected galaxies
Abstract
Context. Determining Ly properties of distant galaxies is of great interest for various astrophysical studies.
Aims. We examine how the strength of Ly emission can be constrained from broad-band SED fits instead of relying on spectroscopy.
Methods. We use our SED fitting tool including the effects of nebular emission, considering in particular Ly emission as a free parameter, and we demonstrate our method with simulations of mock galaxies. Using this tool we analyse a large sample of U, B, V, and i dropout galaxies with multi-band photometry.
Results. We find significant trends of the fraction of galaxies with Ly emission increasing both with redshift and towards fainter magnitude (at fixed ), and similar trends for the Ly equivalent width. Our inferred Ly properties are in good agreement with the available spectroscopic observations and other data.
Conclusions. These results demonstrate that the strength of Ly emission in distant star-forming galaxies can be inferred quantitatively from broad-band SED fits, at least statistically for sufficiently large samples with a good photometric coverage.
Key Words.:
Galaxies: starburst – Galaxies: ISM – Galaxies: high-redshift – Ultraviolet: galaxies – Radiative transfer1 Introduction
For various reasons observations of the Ly line in high redshift galaxies are of great interest. For example, Ly together with other observations can provide useful information on the physical properties of distant galaxies, such as their outflows, dust content, Hi column density, age and others (e.g. Shapley et al. 2003; Verhamme et al. 2008; Atek et al. 2008; Pentericci et al. 2009; Hayes et al. 2010, 2011) It may also be used as a signature to distinguish “normal” stellar populations from extremely metal-poor ones, or even to find Population III stars (e.g. Schaerer 2003; Nagao et al. 2008). Understanding the behaviour of Ly also allows us to clarify the overlap between different galaxy types such as Lyman break galaxies (LBGs) and Lyman alpha emitters (LAEs) (Verhamme et al. 2008) and the influence of this line on selection functions (Stanway et al. 2008; Reddy & Steidel 2009). Finally, Ly observations of distant galaxies are also being used to study questions of more cosmological nature, such as galaxy clustering and dark energy, and to probe cosmic reionisation beyond (Hamana et al. 2004; Malhotra & Rhoads 2004; Hill et al. 2008).
Generally, the Ly properties of distant galaxies have been determined from spectroscopic observations (follow-up or blind) or via narrow-band observations targetted to specific redshifts. Cooke (2009) has shown that LBGs at dominated by Ly absorption or emission can be distinguished based on broad-band photometry. Using SED modeling techniques taking emission lines into account (cf. Schaerer & de Barros 2009, 2010), we take this one step further demonstrating quantitatively that the properties of Ly emission can also be inferred from broad-band observations, at least statistically for large samples with sufficient photometric bands. This allows us, for example, to determine trends of Ly with redshift and other parameters, without resort to spectroscopy.
2 Observational data and SED modeling
de Barros et al. (2011) have analysed in depth a large sample of 3–6 dropout selected galaxies using an up-to-date photometric redshift and SED fitting tool, which treats the effects of nebular emission on the SEDs of galaxies. In their homogeneous analysis they determine the main physical properties, such as the star formation rate (SFR), stellar mass, age, and reddening. They assess carefully their uncertainties, and discuss the evolution of these properties with redshift. We here extend these simulations to perform SED fits with variable strengths of Ly for the same set of galaxies, with the aim of examining whether the available photometry allows us to distinguish any trends of Ly with redshift and/or other properties.
2.1 Photometric data and sample selection
We have used the GOODS-MUSIC catalogue of Santini et al. (2009) providing photometry in the U, B435, V606, i776, z850LP, J, H, K, bands mostly from the VLT and HST, and the 3.6, 4.5, 5.8, and 8.0 m bands from the IRAC camera onboard Spitzer. Using standard criteria as in Stark et al. (2009) we have then selected U, B, V, and i-drop galaxies. To reduce the contamination rate (typically 10–20 %) we have only retained the objects whose median photometric redshifts agree with the targetted redshift range. This leaves us with a sample of 389, 705, 199, and 60 galaxies with median photometric redshifts of , 3.9, 4.9, and 6.0. See de Barros et al. (2011) for more details.
2.2 SED models
Our SED fitting tool, described in Schaerer & de Barros (2009) and Schaerer & de Barros (2010), is based on a version of the Hyperz photometric redshift code of Bolzonella et al. (2000), modified to taking into account nebular emission. In de Barros et al. (2011) we consider a large set of spectral templates based on the GALAXEV synthesis models of Bruzual & Charlot (2003), covering different metallicities and a wide range of star formation histories. A Salpeter IMF is adopted. Nebular emission from continuum processes and numerous emission lines is added to the spectra predicted from the GALAXEV models as described in Schaerer & de Barros (2009), proportionally to the Lyman continuum photon production. The intergalactic medium (IGM) is treated with the prescription of Madau (1995).
The free parameters of our SED fits are: redshift , metallicity (of stars and gas), star formation history described by the timescale (i.e. SFR ), the age defined since the onset of star-formation, and attenuation described by the Calzetti law (Calzetti et al. 2000). In addition, we here introduce a variable Ly strength described by the relative Ly escape fraction , defined by
| (1) |
where is the intrinsic Ly luminosity of the spectral template given by its Lyman continuum flux and the case B assumption, and is the adopted Ly luminosity for the spectral template (before any additional attenuation with the Calzetti law, assumed to affect stars and gas in the same manner). Values therefore describe an additional reduction of Ly beyond the attenuation suffered by the UV continuum.
In practice we compute SED fits for all combinations of [0,10] in steps of 0.1, (0.02=Z⊙, 0.004, 0.001), (10, 30, 50, 70, 100, 300, 500, 700, 1000, 3000, ) Myr, 51 age steps from 0 to the age of the Universe (see Bolzonella et al. 2000), [0,4] mag in steps of 0.1, and (0,0.25,0.5,0.75,1.0). Minimisation over the entire parameter space yields the best-fit parameters as well as other properties such as the predicted Ly equivalent width and UV magnitude. To determine the uncertainties of the physical parameters, we use Monte-Carlo simulations by running typically 1000 realisations of each object. From this we derive the probability distribution function for each parameter/quantity, either for each individual object or for (sub)samples.
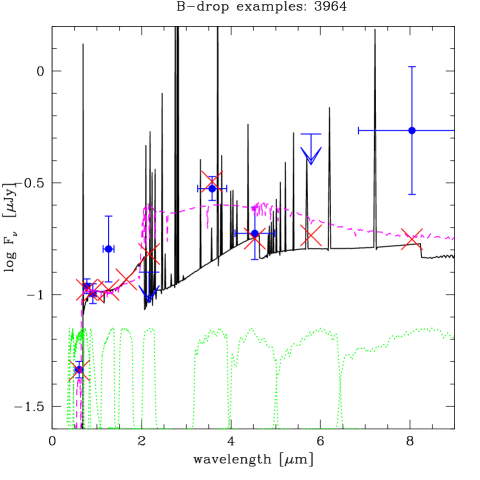
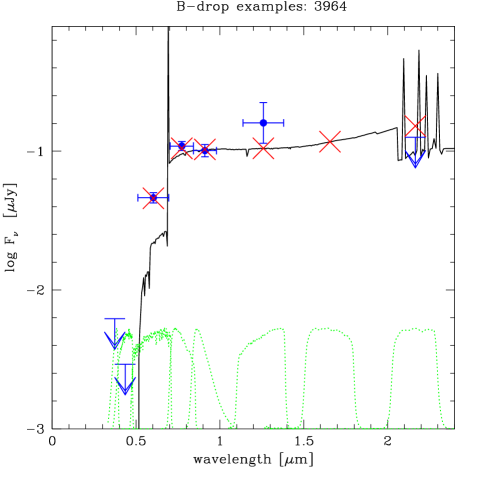
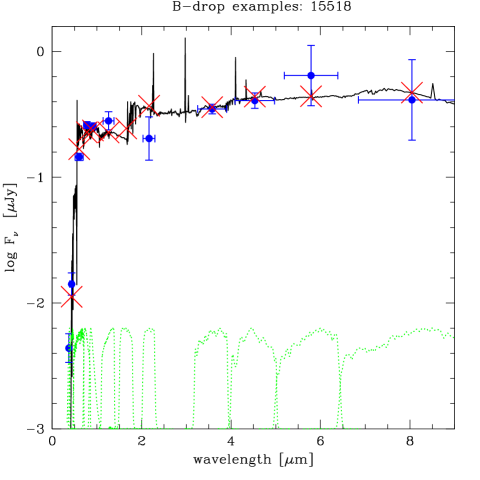
Examples of best-fit SEDs of two B-drop galaxies where a high (low) Ly equivalent width is inferred from the data are shown in Figs. 1 (2) for illustration. The position and shape of the availabe photometric bands are also shown. Several issues can be seen from these figures. First, we see that 2-3 bands, unaffected by Ly, are available to constrain the restframe UV domain, i.e. the UV slope. This is also true for our higher redshift samples, where e.g. the JHK bands probe the UV restframe for I-drops. Of course, the photometry is not necessary available and deep enough for all objects. Second, in general the contribution of nebular emission to the broad-band filters can vary strongly from case to case. See Fig. 1 showing an object best fit with a strong lines and a strong nebular continuum, whereas for the object shown in Fig. 2 nebular emission is negligible. Note, that the first object shows a clear excess at 3.6 m with respect to 4.5 m, which is naturally explained by presence of strong lines (H and others) in the first filter and few lines in the second for galaxies in this redshift range ( 3.8–5, cf. Shim et al. 2011; de Barros et al. 2011). In this case strong intrinsic Ly emission is also expected, and our fitting method yields a median (mean) Ly escape fraction =0.75 (0.57) and a corresponding Ly equivalent width =93 (71) Å. Finally, strong Ly emission does not necessarily imply a strong excess in the filter encompassing this line with respect to the next redward filter, since intrinsically is not very large, and since the continuum flux starts to be reduced by the IGM at .
Typically Ly contributes to 25-30% of the broad-band flux for U- to I-drops if we assume EW Å and compare this value to the filter width. However, this contribution is higher if we take into account the fact that the continuum flux decreases blueward of Ly. Therefore, depending on the source redshift and on the exact IGM attenuation, the relative contribution of Ly to the photometric signal can significantly exceed the above estimate. In any case, when sufficient filters are available, the Ly signal can be determined (albeit with considerable uncertainty), as we will show below.
3 Results
3.1 Evolution of the Ly fraction with redshift and UV magnitude
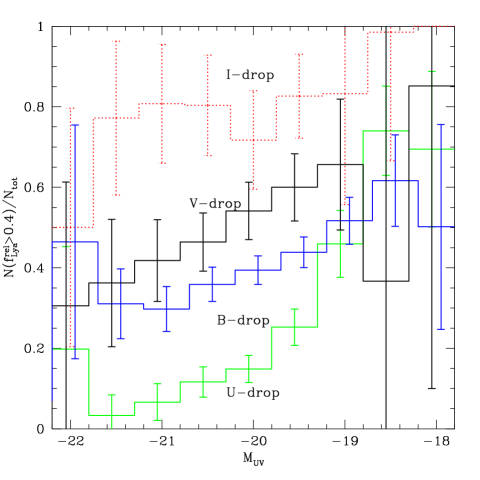
We have examined the probability distribution function (pdf) of the relative Ly escape fraction of our samples. Overall it turns out that is not well constrained for individual objects. For each sample, however, the pdf shows two relative maxima close to and 1, whose relative importance varies between the samples. To quantify this behaviour further, regardless of the detailed shape of the pdf, we count the number of objects with a relative escape fraction above 40%, and define the corresponding fraction of Ly objects as . This number should provide a simple estimate of the fraction of objects with Ly emission among the total dropout samples.
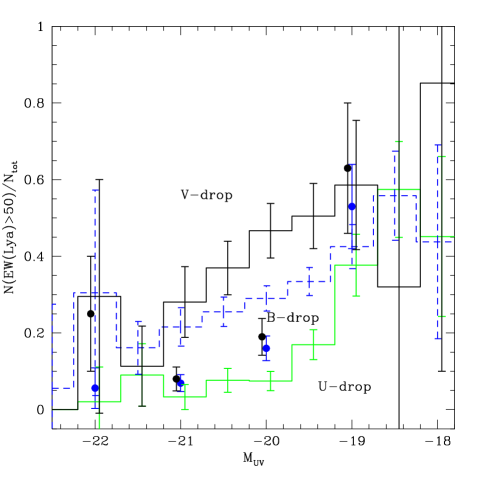
In Fig. 3 we plot as a function of the absolute UV magnitude for the samples of , 4, 5, and 6 galaxies. Two main results emerge from this figure. First, we find that the fraction of objects showing Ly emission increases with redshift (both on average and within each magnitude bin). Second, at each redshift we find that Ly emission is more common in galaxies with fainter UV magnitudes. Except at the brightest and faintest magnitudes, where the number of galaxies is relatively small, our trends are significant. The same trend is also found when using cuts in equivalent width instead of , as shown below.
Interestingly our derived Ly fraction shows the same behaviour with redshift and UV magnitude as obtained from and hinted at by several other studies, mostly based on spectroscopic observations of galaxies. For example, using photometric criteria derived from spectroscopy, Cooke (2009) showed an increasing fraction of objects with strong Ly emission among faint LBGs. The most direct comparison can be made with the work of Stark et al. (2010), who determined the Ly fraction of LBGs from spectroscopy of 400 B, V, I, and z dropout galaxies. These authors found indeed the same trends just described both with UV magnitude and with redshift. To compare our Ly with that derived by Stark et al. (2010) we apply the same criterium on the Ly restframe equivalent width ( 50 Å) on our samples. The result, shown in Fig. 4, is very encouraging, although some discrepancy seems to remain at intermediate magnitudes. The same holds when we compare our data with those of Stark et al. (2011). For our U-drop sample we find % of objects with Å at , comparable to 20–25 % of LBGs in the sample of Shapley et al. (2003) at similar UV magnitudes. Among LBGs Douglas et al. (2010) find 55% with Å, or % after correction for spectroscopically unconfirmed galaxies. Our values for the same cut are between 15–60 % for magnitudes brigther than . We conclude that the Ly trends derived with our method are in reasonable agreement with the available spectroscopic data.
Other data also supports the trend of a higher Ly fraction at high redshift. For example, a convergence of the luminosity functions and number densities of LBGs and LAEs has been noticed by various studies (e.g. Ouchi et al. 2008; Cassata et al. 2011). Using such surveys Hayes et al. (2011); Blanc et al. (2010) have shown that, on average, the absolute Ly escape fraction111The absolute Ly escape fraction is given by , where is the attenuation at the wavelength of Ly. increases with redshift from 0 to 6.5 in UV selected, star-forming galaxies. Our analysis shows that this also holds for LBGs.
3.2 The distribution of with magnitude and other comparisons
The “recovered” best-fit values of for all galaxies from 3–5 are plotted in Fig. 5 as a function of the UV magnitude. Our models show clearly – at each redshift – an absence of UV bright objects with large Ly equivalent widths, whereas for fainter objects occupies a wide range. This behaviour is well known, as it has been found in virtually all samples of LAE and LBGs at (or above 3) (see e.g. Shapley et al. 2003; Ando et al. 2006; Tapken et al. 2006; Shimasaku et al. 2006; Ouchi et al. 2008; Pentericci et al. 2009; Stark et al. 2010), although Nilsson et al. (2009) have questioned the statistical robustness of this trend. Our analysis of a large sample of LBGs therefore provides an independent confirmation for the deficit of large Ly equivalent widths at bright UV continuum luminosities and for an increasing maximum of toward fainter magnitudes found from spectroscopic and narrow-band surveys of LBGs and LAEs. The statistical significance of our result has already been shown in Fig. 3.
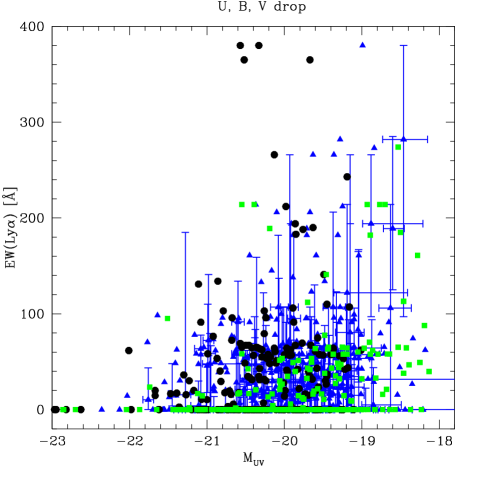
The Ly equivalent widths predicted from our SED fits span a reasonable range of values, comparable to those observed in various LBG samples (cf. e.g. Stark et al. 2010; Pentericci et al. 2009; Shapley et al. 2003), with most values between 0 and 60 Å (the typical value for constant star-formation with ). A good agreement is found between the EW distribution of Shapley et al. (2003) and our results for the U-drop sample.
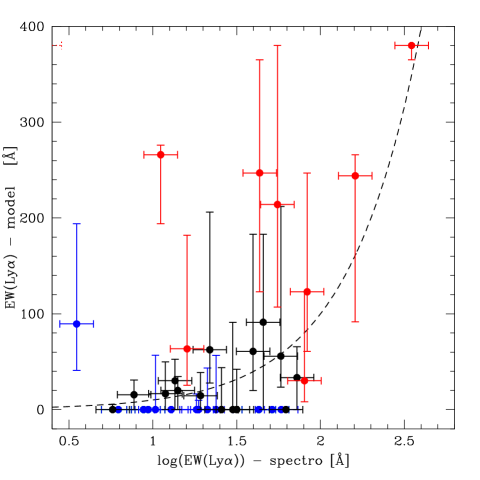
Finally we have examined all individual objects for which spectroscopic measurements of Ly where available. From the data of Stark et al. (2010) we find 36 objects in common with our sample. The predicted and observed Ly equivalent widths of these objects is shown in Fig. 6. Overall we find an agreement within a 68% confidence interval for 60% of the objects. The main outliers are 3 i-drop galaxies for which our model predicts too large equivalent widths (possibly related to uncertainties with the IGM treatment, cf. below), and several B-drops where the model underestimates . Although encouraging, further comparisons with larger samples may be helpful.
We conclude that our SED fitting method relying purely on broad-band photometry allows us to derive statistically meaningful trends of Ly with redshift and UV magnitude. Furthermore the trends and the predicted Ly strength appears both qualitatively and quantitatively in good/reasonable agreement with the existing observations.
3.3 Test of our method using mock simulations
The above comparison of our results with 36 galaxies with available Ly measurements can be improved by mock simulations allowing a more complete assessment of our method.
To do this we have constructed a set of synthetic galaxy spectra with known physical properties including , from which we then derive the synthetic photometry including typical observational errors. The photometry of these mock galaxies is then fitted using our SED fitting tool, and the derived compared to the intrinsic (input) one. In practice we have chosen to simulate a sample of 500 B-drop galaxies. To construct their synthetic spectra we randomly draw their physical parameters, i.e. varying age from 0 to 0.5 Gyr, star-formation histories with variable (taking the same values as for the SED fits, cf. above), variable , , and . We chose the intermediate metallicity (), since our fits are very degenerate in (cf. de Barros et al. 2011). Finally we add noise to the synthetic photometry taking the median photometric uncertainty of the observed B-drop sample in each band. Our artificial sample of galaxies should therefore be representative of typical B-drop galaxies.
The mock sample generated in this manner is then fitted using the same procedure adopted for the observed LBGs, allowing us to verify the accuracy of our fitting procedure. The result for the Ly equivalent width is shown in Fig. 7. A good agreement is found between the derived (output) and input equivalent widths albeit with a relatively large uncertainty. Examing the full probability distribution function of the derived equivalent widths we find ( Å (within 68% confidence), which demonstrates that our method is statistically able to recover the input value with no systematic offset. As expected the dispersion between the input and output equivalent widths increases with decreasing input . Note that the above dispersion has been obtained for a sample with a relatively low median Å.
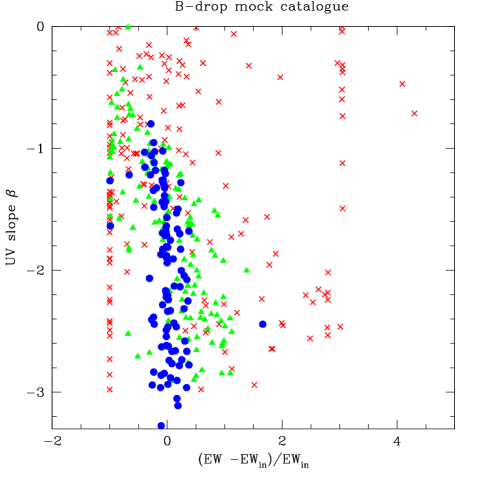
One may wonder whether the accuracy of recovering the strength of the Ly line depends on UV slope of the galaxy. If this was the case the trends found above with UV magnitude could be biased, since the observed UV slope appears to correlate with this quantity (e.g. Bouwens et al. 2009). In Fig. 8 we show the relative difference (“error”) between the output (derived) and input Ly equivalent width for our mock sample as a function of the UV slope determined in a standard fashion from the (i776-z850LP) color (Bouwens et al. 2009). For clarity we separate galaxies according to their input equivalent width EWin in this plot. We find no trend of the relative “error” with for objects with EW Å. For objects with faint Ly emission the errors become larger, as expected, but show no clear trend with UV slope, at least over the range of typical slopes observed at ( to ). We therefore conclude that our multi-band SED fitting method is able to recover the strength of Ly emission with an uncertainty which is independent of the intrinsic UV slope of the galaxy.

3.4 Possible biases
Could the main results obtained with our method, i.e. the increasing fraction of Ly emission towards fainter UV magnitudes and the increase of Ly with redshift among LBGs, be due to biases and not intrinsic to the galaxy population? We think that this is not the case for the following reasons.
First, our method is not biased by a possible trend of the UV slope towards fainter magnitudes, at least for the objects with sufficiently strong Ly emission (e.g. 50 Å). Furthermore our photometric method yields the same behaviour as spectroscopic measurements, which should be subject to different biases, and which generally do not reach the same depths. To avoid biases due to the difficulty of detecting faint Ly emission from objects faint in the continuum, Stark et al. (2010) have measured the fraction of LBGs at 4–6 with above an appropriate threshold, and we have applied the same cuts here (Fig. 4). Recent, deeper observations of 2–3 LBGs by N. Reddy (Private communication) also show a persistent increase of the Ly fraction towards faint objects once corrected for this bias.
Finally, these trends could also be biased by the LBG selection, which can be affected by the strength of Ly emission (cf. Stanway et al. 2007, 2008; Reddy et al. 2008; Reddy & Steidel 2009) As pointed out by Stark et al. (2010) this bias is minimised by simultaneously targetting “adjacent” drop-out populations, e.g. U,B,V, and I-drops as done here. In this way objects with strong Ly emission scattered out from one selection window will be recovered by the selection of the adjacent drop-out. Therefore biases related to Ly affecting the colors used for the LBG selection should only influence the approximate redshift distribution of galaxies, but should not bias the overall sample with respect to the strength of Ly.
We conclude that the derived trends of Ly with magnitude and redshift must be an intrinsic property of UV selected star-forming galaxies at high redshift.
3.5 Discussion
What explains the observed trends of Ly with UV magnitude and redshift? Based on radiation transfer models and on comparisons with observations Verhamme et al. (2008); Schaerer & Verhamme (2008) have shown that absorption by dust is the main process responsible for the observed diversity of Ly line profiles and strengths among LBGs and LAEs. From this they suggested that variations of the dust content with galaxy mass, UV magnitude, and redshift should explain the increasing fraction of Ly emission both with and with decreasing brightness of the objects. Findings of a correlation between extinction and the Ly escape fraction (cf. Atek et al. 2009; Hayes et al. 2010) and the observed decrease of the average UV attenuation with increasing redshift further support this picture, even quantitatively Hayes et al. (2011). To examine this further, we have checked whether our SED models reveal any correlation between and (or other physical properties). Beyond the one shown above with , we have not found clear additional correlations, the uncertainties/degeneracies being too large. We can speculate that future studies of large galaxy samples with additional observational constraints, e.g. from deep surveys with large sets of filters, should be able to detect such correlations.
Can our method be used to constrain cosmic reionisation? In principle yes, since as shown above, we are able to determine the strength of Ly in a similar way as spectroscopic observations, at least for a large sample of galaxies. From this we are then in principle able to determine the fraction of Ly emitters, the Ly luminosity function, or other related quantities, which can in turn be used to probe the evolution of the neutral hydrogen fraction with redshift (see e.g. Malhotra & Rhoads 2004; Dijkstra et al. 2007). However, we should be aware of the following possible limitations. At high- () the IGM significantly alters the SED shortward of Ly. In order to correctly predict the Ly strength from broad-band SED fits one therefore also needs the most accurate treatment of the Ly forest (in principle of stochastic nature) possible. At the same time there are some degeneracies between Ly strength, IGM, and also redshift, which can all modify the flux in the broad-band filter encompassing Ly. It is therefore clear that our method should become less accurate at very high redshift. Future applications to larger samples of high- galaxies observed in as many photometric bands as possible, and careful examination of the above mentioned degeneracies will show whether our SED fitting method can provide useful constraints also on Ly during the epoch of reionisation.
4 Summary and conclusions
Using an updated version of the Hyperz photometric redshift code of Bolzonella et al. (2000) adding nebular emission to the spectral templates (see Schaerer & de Barros 2009, 2010), we have analysed a large sample of Lyman-break selected galaxies at 3–6 in the GOODS-S field, for which deep multi-band photometry from the U-band to 8 m is available. To our extensive exploration of the parameter space covering redshift, metallicity, star-formation history, age, and attenuation whose results are discussed in detail in de Barros et al. (2011), we have added a variable Ly strength, described by a relative Ly escape fraction . We show that significant trends of Ly strength with redshift and with UV magnitude can be inferred from broad-band photometric observations of large samples of galaxies using our method. The validity of our method is also demonstrated by our simulations of mock galaxies. Our method relies on fitting all the photometric bands constraining the UV and optical rest-frame SED. However, even with just 3 bands some Ly trends may be detectable, as e.g. shown already by Cooke (2009) for galaxies.
We find an increase of the fraction of LBGs showing Ly emission both with redshift, and towards fainter UV-restframe magnitudes at each redshift. Furthermore, we also infer a decrease of the average and the maximum Ly equivalent width toward bright objects. Our results are fully compatible with the trends found from spectroscopic observations of individual LBGs and LAEs (e.g. Ando et al. 2006; Ouchi et al. 2008; Stark et al. 2010), and with other more global trends of the Ly escape fraction with redshift (Hayes et al. 2011).
In principle our method should also be applicable to derive the Ly properties of galaxies, of particular interest for studies of the history of cosmic reionisation, and in others contexts. At least we have shown that even broad-band photometric observations can reveal some information about Ly emission in high redshift galaxies.
Acknowledgements.
We have appreciated stimulating discussions with Matthew Hayes, Naveen Reddy, and other colleagues during the spring-summer of 2011. The work of DS and SdB is supported by the Swiss National Science Foundation. DPS is supported by an STFC postdoctoral research fellowship.References
- Ando et al. (2006) Ando, M., Ohta, K., Iwata, I., et al. 2006, ApJL, 645, L9
- Atek et al. (2008) Atek, H., Kunth, D., Hayes, M., Östlin, G., & Mas-Hesse, J. M. 2008, A&A, 488, 491
- Atek et al. (2009) Atek, H., Kunth, D., Schaerer, D., et al. 2009, A&A, 506, L1
- Blanc et al. (2010) Blanc, G. A., Adams, J., Gebhardt, K., et al. 2010, ArXiv e-prints
- Bolzonella et al. (2000) Bolzonella, M., Miralles, J., & Pelló, R. 2000, A&A, 363, 476
- Bouwens et al. (2009) Bouwens, R. J., Illingworth, G. D., Franx, M., et al. 2009, ApJ, 705, 936
- Bruzual & Charlot (2003) Bruzual, G. & Charlot, S. 2003, MNRAS, 344, 1000
- Calzetti et al. (2000) Calzetti, D., Armus, L., Bohlin, R. C., et al. 2000, ApJ, 533, 682
- Cassata et al. (2011) Cassata, P., Le Fèvre, O., Garilli, B., et al. 2011, A&A, 525, A143+
- Cooke (2009) Cooke, J. 2009, ApJL, 704, L62
- de Barros et al. (2011) de Barros, S., Schaerer, D., & Stark, D. 2011, A&A, in preparation
- Dijkstra et al. (2007) Dijkstra, M., Wyithe, J. S. B., & Haiman, Z. 2007, MNRAS, 379, 253
- Douglas et al. (2010) Douglas, L. S., Bremer, M. N., Lehnert, M. D., Stanway, E. R., & Milvang-Jensen, B. 2010, MNRAS, 409, 1155
- Hamana et al. (2004) Hamana, T., Ouchi, M., Shimasaku, K., Kayo, I., & Suto, Y. 2004, MNRAS, 347, 813
- Hayes et al. (2010) Hayes, M., Östlin, G., Schaerer, D., et al. 2010, Nature, 464, 562
- Hayes et al. (2011) Hayes, M., Schaerer, D., Ostlin, G., et al. 2011, ApJ, 730, 8
- Hill et al. (2008) Hill, G. J., Gebhardt, K., Komatsu, E., et al. 2008, in Astronomical Society of the Pacific Conference Series, Vol. 399, Panoramic Views of Galaxy Formation and Evolution, ed. T. Kodama, T. Yamada, & K. Aoki, 115–+
- Madau (1995) Madau, P. 1995, ApJ, 441, 18
- Malhotra & Rhoads (2004) Malhotra, S. & Rhoads, J. E. 2004, ApJL, 617, L5
- Nagao et al. (2008) Nagao, T., Sasaki, S. S., Maiolino, R., et al. 2008, ApJ, 680, 100
- Nilsson et al. (2009) Nilsson, K. K., Möller-Nilsson, O., Møller, P., Fynbo, J. P. U., & Shapley, A. E. 2009, MNRAS, 400, 232
- Ouchi et al. (2008) Ouchi, M., Shimasaku, K., Akiyama, M., et al. 2008, ApJS, 176, 301
- Pentericci et al. (2009) Pentericci, L., Grazian, A., Fontana, A., et al. 2009, A&A, 494, 553
- Reddy & Steidel (2009) Reddy, N. A. & Steidel, C. C. 2009, ApJ, 692, 778
- Reddy et al. (2008) Reddy, N. A., Steidel, C. C., Pettini, M., et al. 2008, ApJS, 175, 48
- Santini et al. (2009) Santini, P., Fontana, A., Grazian, A., et al. 2009, A&A, 504, 751
- Schaerer (2003) Schaerer, D. 2003, A&A, 397, 527
- Schaerer & de Barros (2009) Schaerer, D. & de Barros, S. 2009, A&A, 502, 423
- Schaerer & de Barros (2010) Schaerer, D. & de Barros, S. 2010, A&A, 515, A73+
- Schaerer & Verhamme (2008) Schaerer, D. & Verhamme, A. 2008, A&A, 480, 369
- Shapley et al. (2003) Shapley, A. E., Steidel, C. C., Pettini, M., & Adelberger, K. L. 2003, ApJ, 588, 65
- Shim et al. (2011) Shim, H., Chary, R.-R., Dickinson, M., et al. 2011, ApJ, 738, 69
- Shimasaku et al. (2006) Shimasaku, K., Kashikawa, N., Doi, M., et al. 2006, PASJ, 58, 313
- Stanway et al. (2008) Stanway, E. R., Bremer, M. N., & Lehnert, M. D. 2008, MNRAS, 385, 493
- Stanway et al. (2007) Stanway, E. R., Bunker, A. J., Glazebrook, K., et al. 2007, MNRAS, 376, 727
- Stark et al. (2009) Stark, D. P., Ellis, R. S., Bunker, A., et al. 2009, ApJ, 697, 1493
- Stark et al. (2010) Stark, D. P., Ellis, R. S., Chiu, K., Ouchi, M., & Bunker, A. 2010, MNRAS, 408, 1628
- Stark et al. (2011) Stark, D. P., Ellis, R. S., & Ouchi, M. 2011, ApJL, 728, L2+
- Tapken et al. (2006) Tapken, C., Appenzeller, I., Gabasch, A., et al. 2006, A&A, 455, 145
- Verhamme et al. (2008) Verhamme, A., Schaerer, D., Atek, H., & Tapken, C. 2008, A&A, 491, 89