Dust discs around intermediate mass and Sun-like stars in the 16 Myr old NGC 1960 open cluster
Abstract
We present an analysis of Spitzer IRAC (3.6–8m) and MIPS (24m) imaging of members of the 16Myr old open cluster NGC 1960 (M36). Models of terrestrial planet formation indicate that rocky planets are likely to achieve their final masses at around 10–30Myr, and thus this cluster is at an interesting epoch for planet formation. We find 21 B-F5 type stars and 14 F6-K9 type stars which have 24m excess emission, and thus determine that % of B-F5 type stars and % of F6-K9 type stars in this cluster have 24m excess emission. These excess frequencies are similar to those observed in other clusters of similar age. Three early type stars have excesses at near-infrared wavelengths. Analysis of their SEDs confirms that these are true debris discs and not remnant primordial or transitional discs. None of the 61 sun-like stars have confirmed near-infrared excess, and we can place a limit on the frequency of 8m excess emission around sun-like stars of 7%. All of the detected excesses are consistent with emission from debris discs and are not primordial.
keywords:
circumstellar matter – infrared: stars.1 Introduction
Most young (1–2 Myr old) stars are surrounded by a gas-rich primordial disc with dust producing high levels of emission in the infrared (, e.g. Kenyon & Hartmann 1995). These are the birthplaces of planets. Current models of extra-solar planet formation propose that dusty discs around a new star settle and km-sized planetesimals aggregate on a short (1Myr) timescale (Weidenschilling & Cuzzi, 1993). The largest planetestimals undergo runaway accretion followed by oligarchic growth resulting in tens or hundreds of 1000km-sized bodies in their own cleared “feeding zones” (Klahr, 2008). These phases may take up to a few million years. Circumstellar gas accretes onto the star or onto large protoplanetary cores to create gas giant planets (Hartmann et al., 1998). Finally these planetary embryos collide and merge in a chaotic growth phase to form a few stable terrestrial planets over 10-100Myr (see e.g. Weidenschilling 1977). These or other process remove the primordial discs on timescales of 3–7Myr (Hernández et al., 2007; Hillenbrand, 2008; Currie et al., 2009). By 10 Myr almost all remaining discs are optically thin debris discs (see e.g. Wyatt 2008 and references therein). Emission from such discs arises from second generation dust populations produced in collisions between planetesimals. These dust grains absorb and re-radiate star light at wavelengths typically 10m.
The Spitzer Space telescope has been used to study the evolution of debris discs in a statistical manner (see e.g. Rieke et al. 2005, Su et al. 2006, Siegler et al. 2007, Rebull et al. 2008, Carpenter et al. 2009). These studies have tried to answer the question of why two apparently similar stars can have very different levels of excess emission. To date, the clearest dependency is on age. In A and early F-type stars there is evidence for a peak in the upper envelope of excess emission at 10-20Myr before a decay in proportion with time (see e.g. Wyatt 2008 and references therein). For solar-type stars the number of observed objects is smaller and so correlations are harder to establish. Based on current evidence the decay of 24m excess around solar-type stars appears to follow a similar pattern to the A stars but on a timescale that is an order of magnitude shorter (a drop from 40% to 20% of stars with 24m excess occurs between 10 and 100Myr for solar-type stars, and between 100 and 500Myr for A-type stars, see Figure 6 of Siegler et al. 2007). In general the levels of excess emission are also smaller around lower mass objects (2 times the photospheric flux) apart from around some of the youngest sources. These results can be interpreted within the framework of the evolutionary models of Kenyon and Bromley (2005; 2006). These suggest that planetesimals take longer to form at 10-30au around A-type stars than at 1au around G-type stars (assuming thermal equilibrium, an excess detected at 24m implies a temperature of 100–150K, translating to dust orbital radii of 3–30au around A and early F-type stars and 0.5–3au around solar-type stars). Thus there are copious dust producing collisional events for 10-100Myr during planetesimal accretion around A-type stars. Around solar-type stars 100km-sized embryos may be complete within a few Myr, and thus subsequent observed debris is likely to have been produced in recent catastrophic collisions like the impact that formed the Earth-Moon system (see e.g. Canup 2004 and references therein). These massive collisions are seen in as peaks in the excess emission above a lower background of emission in simulations of planetesimal discs (see e.g. Kenyon & Bromley 2005). Other authors have found these collisions could ignite collisional avalanches in the disc, which are brighter in discs with high optical depths (large populations of small grains, Grigorieva et al. 2007), and could lead to longer-lived increased emission.
The observed peak in debris disc emission for A and early F-type stars (10–20Myr) is an important epoch for terrestrial planet formation, as models and radiometric dating suggest that terrestrial planets reach their final mass within 10–30Myr (Wetherill & Stewart, 1993; Yin et al., 2002; Kenyon & Bromley, 2006). Disc emission from this epoch could therefore provide a direct tracer of the frequency of terrestrial planet-forming collisions. Cluster samples at this age have already been the target of Spitzer campaigns. Clusters with published 24m Spitzer photometry include: the 16–17 Myr Sco-Cen association (40 stars across F and G spectral types, Chen et al. 2005); the 27Myr old IC 4665 cluster (73 stars, A to mid-K types Smith et al. 2011); NGC 2547 at 35–40 Myrs old (Naylor & Jeffries 2006; photometry for 70 sources); NGC 2232 at 25Myr (209 sources B–M type but only 38 have published 24m excess, Currie et al. 2008); and h and Persei at 13 Myr (616 sources, spectral types B–G but uncertain membership lists, Currie et al. 2008). It is difficult to obtain sufficient statistics from individual clusters to examine model predictions (either due to uncertain memberships or issues with obtaining sufficient 24m photometry). Combining open cluster data is the primary method of studying factors such as the influence of stellar mass on the incidence of debris discs at the epoch of terrestrial planet formation. As open clusters provide a homogeneous, chemically uniform coeval population, studies of multiple open clusters allow tests of how environmental factors influence debris emission, and the planet forming processes that create it.
NGC 1960 (M36) is a young open cluster, with an age determined by isochrone fitting of 16Myr (Sanner et al., 2000). The large error bars on this value are a reflection of the difficulty of determining the age of this cluster as it has no known significantly evolved stars. Other recent age estimates in the literature include an age of 20Myr (Mayne & Naylor, 2008) and 25Myr (Hasan, 2005). As these are within the errors given by Sanner et al. (2000), we adopt an age of 16Myr in this paper. The cluster lies at a distance of 1318120pc and has a reddening of mag (Sanner et al., 2000). This cluster provides an ideal complement to the studies of NGC 2232 and h and Persei as it lies between these clusters in age. Combining the studies of these clusters will allow us to place constraints on the evolution of debris discs within the peak of debris disc emission itself. It is also worth noting that this cluster can be viewed as an older analogue of the Orion Nebula Cluster (ONC). Integrating a Kroupa mass function (Kroupa, 2001) and noting that there are 30 objects with masses of 3–7 (using a distance modulus of mag and extinction of , Sanner et al. 2000, and finding objects with absolute magnitudes -1.4–0.79, see target selection in next section) there are 445 stars with masses 0.5–7 and 1680 stars with masses 0.1–7. These numbers are comparable with the ONC. We would also expect 14 stars more massive than 7 and find 16 stars of this size in NGC1960 (see target selection in the next section), which is also comparable to the ONC.
In this paper we present Spitzer archive data of NGC 1960. We use IRAC and MIPS 24m photometry to identify excess emission around cluster members based on vs colours and SED fitting. We discuss how levels of excess compare with other cluster samples at this epoch, and how these observations constrain models of terrestrial planet formation.
2 NGC 1960 targets
To identify bright target members of the cluster we used the sample presented by Sanner et al. (2000) and adopt the same proper motion and colour membership criteria presented in that paper. From their initial sample of 864 stars with and band photometry, 121 sources were found to have proper motions consistent with cluster membership (within 3 of the central cluster proper motion mas/yr in RA, mas/yr in Dec). Proper motion detections were considered accurate for sources with mag, and thus we adopt this brightness as a cut-off for membership from this catalogue ( translates to a spectral type of G0 for this cluster). As a further test of cluster membership the versus colour-magnitude of the targets is compared to a 16Myr-old isochrone from Siess et al. (2000) with mag (as determined by isochrone fitting in Sanner et al. 2000). The colour-magnitude diagram is shown in Figure 1. This led to the rejection of 7 targets with and a final selection of 63 targets. We extract magnitudes for the targets from the 2MASS catalogue (Skrutskie et al., 2006). This source list is given in Table 1.
A set of lower mass members of NGC 1960 was assembled from spectroscopy obtained at the William Herschel 4.2-m telescope. A separate paper is being prepared using these data, but the details relevant to this paper are given below. Observations were performed on 2009 November 25–26 and 2010 November 12–14 using the AF2/WYFFOS multifibre spectrograph, with an echelle grating that provided a spectral coverage of 420Å centred at 6600Å and a resolving power of 11 000. Targets with were selected from a versus colour-magnitude diagram, constructed using a photometric survey performed at the Isaac Newton Telescope (N. Mayne private communication). We took spectra of 472 unique objects (64 were observed twice or more) along with a suite of standard stars.
The data were reduced and analysed as described in Jeffries et al. (2009). Bespoke software was used to flatfield, extract and wavelength calibrate the spectra before cross-correlation with radial velocity (RV) standards using the wavelength range 6370–6550Å. We obtained good radial velocities for 358 unique targets – the precision varied with signal-to-noise ratio and rotational broadening. In a cluster as young as NGC 1960, the presence of measurable Li in the atmospheres of its cool stars is expected. Indeed, Li is depleted so rapidly in low-mass stars that its presence in K or M-type stars () is a very strong indication of youth ( Myr, Jeffries 2006). The spectra were examined for the presence of a lithium resonance line at 6708Å. After correcting all the results to a common heliocentric frame, it was clear that the Li-rich objects defined a kinematic cluster within the data. After an iterative clipping algorithm was applied we found that the Li-rich objects had a mean heliocentric RV of km s-1, with an additional estimated zero point uncertainty of about 0.5 km s-1. An analysis of stars with two or more spectra showed that our RV precision estimates are realistic.
To select members we chose to include all those Li-rich stars which have a heliocentric RV within 2 error bars of the cluster mean, where this error included an additional systematic 1 km s-1 representing a typical internal RV dispersion for a cluster (see Jeffries et al. 2009). This gave a list of 69 candidate members with a median RV precision of 1.3 km s-1 (targets are listed in Table 2). To estimate the level of any possible contamination, we make a similar selection from the Li-rich stars, but using mean RVs that are displaced by km s-1 from the actual cluster mean. This resulted in the selection of objects which, despite their discrepant RVs, could still be close-binary cluster members. We conclude that this sample of low-mass cluster candidates has per cent contamination.
For both the bright and lower mass samples temperatures are estimated using the colours of the targets using the relation
(Alonso et al., 1996). Colours were first dereddened using (Sanner et al., 2000) and conversions to from Rieke & Lebofsky (1985). For some of the higher mass targets (spectral type earlier than F0) a relation in is more often favoured to approximate temperature. Using the relation we find temperatures that can be lower by up to 10% for the highest mass targets. In this paper temperature is only used to determine colour corrections on the photometry. Within the K temperature range of the higher mass targets, this translates to a maximum difference in aperture correction factor of 0.5%.
| ID | RA | Dec | (-)0 | (-)0 | , K | |
|---|---|---|---|---|---|---|
| 1 | 84.06585 | 34.1436 | 8.052 | -0.216 | -0.681 | 11769 |
| 2 | 84.09608 | 34.1758 | 8.133 | -0.232 | -0.696 | 11842 |
| 3 | 84.16359 | 34.0639 | 8.178 | -0.199 | -0.666 | 11696 |
| 4 | 84.17627 | 34.2017 | 8.275 | -0.144 | -0.137 | 9535 |
| 5 | 84.13335 | 34.1798 | 8.297 | -0.222 | -0.698 | 11852 |
| … |
| ID | RA | Dec | (-)0 | (-)0 | , K | |
|---|---|---|---|---|---|---|
| 1_136 | 84.06671 | 34.0180 | 14.378 | 0.675 | 1.725 | 5419 |
| 1_138 | 84.04419 | 33.8800 | 14.050 | 0.426 | 1.033 | 6542 |
| 1_151 | 83.91997 | 33.9586 | 14.155 | 0.449 | 1.273 | 6114 |
| 1_223 | 84.09403 | 33.9216 | 14.999 | 0.664 | 1.788 | 5332 |
| 1_371 | 84.12115 | 34.0361 | 16.086 | 0.963 | 2.438 | 4550 |
| … |

3 Spitzer data
Data were sourced from the Spitzer Heritage Archive (SHA). Data were taken with the IRAC (Fazio et al., 2004) and MIPS (Rieke et al., 2004) instruments under Spitzer Programme P50265. IRAC data were obtained on 23rd October 2008 in high dynamic range mode using a 68 mapping array. The AOR consists of 260″map steps, array orientation and a 5-point Gaussian dither with small scale factor. A frame time of 12 second exposures gave a 5 point-source sensitivity of 17.4, 16.6, 15.7 and 14.8 magnitudes in the four IRAC bands (3.6m, 4.5m, 5.8m and 8m) respectively.
MIPS data were obtained on 1st November 2008 in scan mapping mode centered at 5h36m12s +34d08m24s. A medium scan rate, scan leg length of 0.5∘ and 11 scan legs were used to cover an area of 38′55′. Five repetitions of the AOR were obtained, giving a 5 point-source sensitivity of 11.4 magnitudes at 24m.
The data were extracted as BCD (basic calibrated data) files from the archive. These data are individually flux-calibrated array images. The Spitzer Science Center MOPEX package (Makovoz & Marleau, 2005) was used to produce the final mosaics. We used standard MOPEX modules. The individual 24m MIPS frames were flat-fielded using the flatfield module in MOPEX. Overlap correction was determined using the default settings in the overlap module and the final image mosaic consisting of all five repetitions of the AOR was constructed using the mosaic module. Mosaics were created for each of the IRAC channels using the overlap and mosaic modules in MOPEX with default settings. For details of these modules see Makovoz & Marleau (2005) or the on-line MOPEX user’s guide at http://ssc.spitzer.caltech.edu/dataanalysistools/tools/ mopex/mopexusersguide/. Photometry was extracted using the APEX package from MOPEX. For the IRAC channels the PSF is undersampled and thus photometry was extracted in circular apertures of radius 3 pixels (36) with background determined in an annulus of inner radius 12 pixels and outer radius 20 pixels (144–24″). Apertures were centered on the location of each source as listed in Tables 1 and 2. Of the 132 targets in the full sample, 4 (2, 4, 2) fell outside the channel 1 (2, 3, 4) imaging mosaics. Array location-dependent corrections were applied to the IRAC photometry. Correction images available on-line at http://ssc.spitzer.caltech.edu/irac/calibrationfiles/locationcolor/ were mosaiced in the same way as the data frames to produce a correction mosaic. The aperture photometry of a source was then multiplied by the value of the correction mosaic at the center of the source image. Aperture corrections were taken from tabulated values listed in the IRAC data handbook. Colour corrections were applied by interpolation from tabulated values using the source effective temperatures as listed in Tables 1 and 2. We used the tabulated values in the IRAC data handbook to convert the flux of the targets in Jy to magnitudes. Specifically, the zero-points used were 280.9Jy at 3.6m, 179.7Jy at 4.5m, 115.0Jy at 5.8m and 64.1Jy at 8.0m. Absolute calibration of IRAC is stable to 1–3% (Reach et al., 2005). We add a 3% calibration uncertainty in quadrature to statistical background errors from pixel to pixel variation determined in the aperture module to give a final error on the IRAC photometry. The photometry was de-reddened using the values determined by Sanner et al. (2000) converted to IRAC wavelengths using relations of Flaherty et al. (2007). The final photometry is listed in Tables 3 and 4.
In the MIPS data the PSF is not undersampled. We used the APEX PRF(Point Response Function) fitting module to determine a PRF model for the final mosiac using the brightest and cleanest stars (no near neighbours, no bad pixels) in our target list to determine a PRF model using the prf_estimate module. This model was used to fit the target stars to determine source position (from input lists taken from Tables 1 and 2) and flux in the PRF photometry module in APEX. If the source could not be well fit (according to a analysis) with either a single or multiple point sources (active deblend), then the PRF photometry was determined to have failed. For sources which were not fit in the PRF photometry, or where the PRF fits were sufficiently distant from the input source position that the detected source was unlikely to be our target (1225 corresponding to 1/5 of the FWHM of the average PSF for all sources) then the aperture photometry was adopted instead. Apertures of radius 2.6 pixels (637) were used with annuli of inner radius 8.16 pixels and outer radius 13.06 pixels (20″– 32″) to determine the background.
| Source | [3.6] | [4.5] | [5.8] | [8.0] | [24] | - [24] | Comments | |
|---|---|---|---|---|---|---|---|---|
| 1 | 8.909 [0.033] | 8.844 [0.033] | 8.876 [0.033] | 8.966 [0.033] | 8.918 [0.046] | -0.183 | 0.906 | |
| 2 | 8.985 [0.033] | 8.953 [0.033] | 8.990 [0.033] | 9.061 [0.033] | 8.784 [0.045] | 0.048 | 1.122 | |
| 3 | 8.968 [0.033] | 8.934 [0.033] | 8.993 [0.033] | 9.034 [0.033] | 9.129 [0.048] | -0.283 | 0.826 | |
| 4 | 8.106 [0.033] | 7.709 [0.033] | 7.549 [0.033] | 7.310 [0.033] | 6.262 [0.043] | 2.152 | 7.424 | XS |
| 5 | 9.154 [0.033] | 9.110 [0.033] | 9.147 [0.033] | 9.221 [0.033] | 9.259 [0.048] | -0.261 | 0.845 | |
| … | ||||||||
| 33 | 11.140 [0.033] | 11.122 [0.033] | 11.186 [0.034] | 11.254 [0.038] | 11.453 | -0.410 | 0.423 | Contam. |
| … |
Notes: Stars which had contaminating flux of more than 13% subtracted from the aperture photometry are marked as “Contam” in the comments column. None of these targets have been identified as a having confirm 24m excess. Sources with more than 3 higher than the photospheric relation from Plavchan et al. (2009) are marked as excess sources by the note “XS” in the comments column. The error on the photospheric relation includes differences from different photospheric predictions, variation in the colours observed for sources without excess and statistical error on the 24m photometry added in quadrature as described in the text.
| Source | [3.6] | [4.5] | [5.8] | [8.0] | [24] | - [24] | Comments | |
|---|---|---|---|---|---|---|---|---|
| 1_136 | 12.621 [0.033] | 12.645 [0.033] | 12.679 [0.039] | 12.726 [0.055] | 11.940 | 0.715 | 1.890 | |
| 1_138 | – | 12.935 [0.034] | – | 13.312 [0.119] | 11.886 [0.300] | 1.134 | 2.851 | XS |
| 1_151 | 12.809 [0.033] | 12.810 [0.034] | 12.832 [0.040] | 12.838 [0.084] | 11.385 [0.166] | 1.499 | 3.958 | XS |
| 1_223 | 13.254 [0.034] | 13.272 [0.034] | 13.284 [0.050] | 13.508 [0.156] | 12.007 | 1.206 | 2.964 | |
| 1_371 | 13.580 [0.034] | 13.486 [0.035] | 13.626 [0.058] | 13.828 [0.214] | 11.930 | 1.720 | 4.623 | |
| … |
Notes: See notes on Table 3 for description of comments column.
Some of our targets are close enough to other objects for contamination of the aperture photometry (not PRF photometry) to be an issue. To determine a correction for contaminating sources in the aperture photometry we used the APEX module in MOPEX to create a list of all source detections () in the MIPS 24m mosaic. We identified the sources that were most isolated from other detections (no other detection within 10 pixels, 25″of the source) and grouped them by brightness (PRF determined flux). We then used the aperture module to place apertures (of the same size, 637 radius, used for the target sources) at the source and then at increasing distance from the source (in a direction away from other detections) to determine the flux that would fall into an aperture at a set distance from the source. The relationship between the flux and distance from the source was found to be well fit by a semi-Gaussian profile with FWHM 105. Flux from the target was 5% of the flux measured in an on-source aperture at 109 and 1% of the on-source flux at 135. For each of our target sources the area within 20″was checked for detected sources in the 24m image, and any possible contamination calculated by multiplying the aperture flux by the value of the Gaussian function described above at the appropriate distance. In order to account for sources that might be below the 3 detection limit in the 24m image, but that could be contaminating the target photometry, we also considered detections recorded by the APEX module in the IRAC 8m mosaic. The relation between 8m and 24m flux was calculated by comparing the values determined for sources detected in both images. The median and median absolute deviation for the ratio of measured fluxes was . Any sources within 20″of our target detected at 24m had their contamination calculated, the contaminating source was then removed from the list of detected sources at 8m and then the residual 8m detection list was checked for sources within 20″of the target. The flux of these sources was divided by 4.57 to get the 24m flux and the contamination in the target aperture calculated as above. The median and mean absolute deviation of the contamination of the targets is 7% 6% of the aperture flux. Sources with high levels of contamination (13%, 1 higher than average) or with other issues that could affect their photometry (e.g. high number of bad pixels, close to the edge of the mosaic) are noted in Table 4. PRF photometry should mitigate against the effects of source contamination through the active deblend algorithm, and so we do not include a contamination correction for sources with PRF photometry. We used the above steps to determine the levels of contamination that would have been seen in aperture photometry for those sources with PRF photometry. This was used as a method of checking that there could be no sources in the IRAC 8m mosaic that might have been blended with the target in the lower resolution 24m mosaic. In all cases the possible contamination was % of the PRF photometry.
After subtracting the contaminating flux from the MIPS 24m photometry an aperture correction of 0.433 magnitudes determined from bright targets was applied. A colour-correction was applied for each target by interpolation from values tabulated in the MIPS data handbook. We used the zero-point of 7.14Jy listed in the handbook to convert the fluxes into magnitudes. Photometric errors for MIPS 24m observations is 4% (Engelbracht et al., 2007). We added this in quadrature to statistical errors returned from the aperture/PRF photometry APEX modules arising from pixel to pixel variations to give a final error on the flux. The final MIPS photometry is listed in Tables 3 and 4. Of the 132 targets in the sample, 2 fall outside the 24m mosaic (2_195 and 2_277). These targets also fall outside the field of view in the IRAC images, and therefore they are not included in the table.
4 Detection of excess emission
4.1 Near-infrared excess
The sensitivity of the IRAC data allows the detection of photospheric emission down to the levels of photospheric emission of M dwarfs at the distance of NGC 1960 (1300pc). Thus all the targets which fall within the IRAC fields of view are detected with good signal-to-noise (5).
To determine if there is any excess emission in the IRAC photometry from the target stars we plot the , , and colours against . This method has been used in other clusters to search for near-infrared excess (see e.g. Gorlova et al. 2007; Currie et al. 2008; Smith et al. 2011). These plots are shown in Figure 2.


The plots show that the majority of targets have colours consistent with photospheric emission. Crosses mark the targets in Table 1 and diamonds mark the sources listed in Table 2. Errors on the IRAC colours are taken from the pixel-pixel variation in the background apertures in the IRAC photometry plus the 3% maximum calibration error typical for IRAC photometry (Reach et al., 2005), added in quadrature to the errors on the photometry from 2MASS. In order to identify sources with unusual colours, we adopt the following procedure. For each target, we identify other targets in the sample with similar colours (within ). The mean IRAC colour for these targets is calculated, together with the error (standard deviation of the IRAC colours added in quadrature to the mean error on the colour calculated as described above). Any targets with colours differing from the mean of other targets with similar by more than 3 times this error are identified and removed from the source list. This process is repeated until no sources with colours different from the average by more than 3 times the error are found. The outlier sources are labelled on the figures.
From the IRAC colours, we identify bright targets 4 and 8 as having colours consistent with excess emission in all 4 IRAC bands, bright target 14 as having colours consistent with excess emission in bands [4.5], [5.8] and [8.0], and lower mass stars 4_336 and 4_536 as having colours consistent with excess in the two longest IRAC wavebands. None of these targets are highlighted in the 2MASS catalogue as having uncertain photometry.
Bright target 16 has colours that appear to be consistent with excess emission in the two longest IRAC bands ( and ), although in the -clipping algorithm described above these colours are at the 2.3 and 2.1 levels of significance. Constructing an SED for this object using a Kurucz model profile for the appropriate temperature (9900K, see Table 1) and scaling to a best fit for the 2MASS photometry we find the IRAC channel 3 and 4 photometry to be consistent with photospheric emission within 2 and 3 respectively. Fitting a blackbody to the IRAC and MIPS photometry of the source shows that any excess must be at a maximum temperature of 600K (in order to not exceed limits from the IRAC photometry). This corresponds to a minimum radial location of 0.67au assuming the emitting grains behave like blackbodies. However, as the IRAC photometry is consistent with a photospheric emission within the errors we cannot confirm that this target exhibits true near-infrared excess.
4.1.1 Contamination by other sources
The target 4_536 lies very close to the bright target 8. In the IRAC channel 4 data (8m), the emission from bright target 8 extends to the location of 4_536, and so the target may have contaminated flux. This is also true in the IRAC channel 3 image, although the emission from bright target 8 is less extended in this image. As the resolution is higher for the lower wavelength channels, this is not the case in the channel 1 and channel 2 images. Thus we cannot confirm excess for this target in the IRAC bands. This target is not detected at the 3 level in the MIPS 24m imaging, and so we have no other photometric measurements to further test whether this target exhibits true excess emission.
The target 4_336 lies very close to a bright infrared source (detected in the IRAC images at 84.02458 degrees in RA, 34.103 degrees in Dec). This source has been identified as IRAS 05327+3404, a probable pre-main sequence K2 class I/II star with a large optically thick circumstellar disc producing a large infrared excess (not thought to be related to NGC 1960, Magnier et al. 1999). In the high resolution data (IRAC channels 1 and 2) this source can be seen as separate from the target 4_336. However, in the IRAC channels 3 and 4 and the MIPS 24m images, the bright source IRAS 05327+3404 extends to cover the location of the target 4_336. We can therefore only provide upper limits to the flux for this target in IRAC channels 3 and 4, and in the MIPS 24m photometry.
4.1.2 True excess
The bright targets 4, 8 and 14 (BD +34 1113, BD +34 1110, and BD +34 1098 respectively) are amongst the highest mass stars in our sample, as indicated by their colour in and temperature inferred from . These sources show evidence for excess emission in the near and mid-infrared (see Table 3 and Figure 2). We checked these sources did not have significant contamination using the method described in section 2. We construct SEDs for these objects using Kurucz model profiles for the appropriate temperature for each source (see Table 1) scaled to a best fit to the JHKS 2MASS photometry using a analysis. These plots (Figure 3) show that the near-infrared slopes are not consistent with photospheric emission alone. We can fit the IRAC and MIPS photometry by adding a single temperature blackbody to the photospheric emission for bright sources 4 and 8. These fits are at temperatures of 800K and 900K respectively (equivalent to dust lying at radii of 0.73au and 0.36au respectively assuming the material emits as a blackbody). For bright target 14 the IRAC and MIPS photometry cannot be fit by a single temperature blackbody, and so we adopt two blackbody contributions at temperatures of 600K and 180K to fit the emission (0.73 and 8.06au). It should be noted that this illustrative fit is non-unique and that longer wavelength photometry would be required to determine constraints on the cooler blackbody temperature in particular. In all three plots the blackbody contributions are shown by a dotted line and the total (blackbody and photospheric emission) is shown by a dashed line (Figure 3).


For all three targets with near-infrared excess we must ask if this emission is evidence for a remnant primordial disc. At an age of 16Myr for the cluster such primordial discs would be rare as they are expected to dissipate on timescales of a few Myr (see Wyatt 2008 and references therein). The fractional luminosity of these discs is much lower than we would expect for primordial disc emission. Adopting the blackbody fits to the emission shown in Figure 3, we find that the excess emission has fractional luminosity for both bright star 4 and 8, and that the two components of the excess around bright star 14 have fractional luminosities of and (for components at 600K and 180K respectively). These levels are consistent with which conventionally defines a debris disc as opposed to a primordial disc (Lagrange et al., 2000). These targets join a small but growing population of A stars with debris discs within 10au (e.g. Lep, Moerchen et al. 2007, HD172555 Rebull et al. 2008). Bright star 14 is one of a growing number of systems with evidence for multiple component discs. 11 stars were identified by Chen et al. (2009) as having probable multiple component discs, which have been interpreted as possible solar-system analogues (see also the Pic association member Tel, Smith et al. 2009).
4.1.3 Limits on near-infrared excess and primordial emission
As a further confirmation of the evolved nature of the targets observed in this study, we follow the example of Muzerolle et al. (2010) and consider the IRAC/MIPS SED slope for each of our objects as a method of identifying possible primordial/transition disc candidates. We consider the value of over IRAC channels 1 and 3 (so for m and m) and over IRAC channel 4 and MIPS (m and m). We plot these spectral slopes for all stars in our study in Figure 4, and plot upper limits to the spectral slope for sources without significant photometry at m. According to the metrics of Muzerolle et al. (2010), stars with are possible primordial disc hosts. Stars with and are possible transition disc candidates, and may have optically thick discs at 1au with depleted/optically thin inner holes. Target 4_336 appears to lie in the primordial disc region, but this object’s flux is highly contaminated by a known primordial disc candidate as discussed in Section 4.1.1, and therefore this is not a true detection of a primordial disc. Bright target 4 lies close to the boundary for possible primordial emission. Bright target 14 lies in the region of possible transition disc emission. However, for both these targets we have shown that it is possible to fit their emission with optically thin () blackbody emission. Thus we find the emission for both these targets is consistent with debris disc emission. The remaining targets in our study all have and , consistent with no excess or optically thin emission.

For those targets with no evidence of significant near-infrared excess, we determine the limits we can place on excess emission in the IRAC photometric bands. Excluding the sources discussed above, we determine an empirical photospheric locus and uncertainty in as a function of . For each value of , we determine the mean and standard deviation of the colours of sources with within 0.25 of this value. These are our empirical photospheric locus and error. We fit a linear model to the error to determine the sigma values for each colour. We determine the dispersions in colours to be , , , and . Adopting these uncertainties, we find that for an F5-type star () we can place the following 3 limits on excess emission in the near-infrared: ; ; ; and . For objects with ( M1-type) we place the following 3 limits on excess in the near-infrared: ; ; ; and .
4.2 24m excess
The principal means of identifying debris discs is the detection of excess emission (above the levels expected from the photosphere) in mid-infrared ranges, and no detection of such an excess at near-infrared wavelengths (which may indicate a primordial or transition disc). The sensitivity of the MIPS observations of NGC 1960 allow a detection down to 12th magnitude at 24m (3 point source limit). This means we can only detect photospheres to A3V (), which means that for many of our targets, we would not expect to detect the photosphere. This is reflected in the results presented in Tables 3 and 4. Those sources with significant detections generally have high values of and (detected emission at 24m / expected emission from the photosphere).
In order to determine which targets exhibit 24m excess, we follow the example of recent authors (e.g. Rebull et al. 2008; Stauffer et al. 2010) in using the targets’ colours. This method requires a well-defined model for photospheric colours. Stauffer et al. (2010) used Spitzer observations to determine an empirical relation for from , defined as . Similar relations have been presented by Gorlova et al. (2006), and Plavchan et al. (2009), who included M dwarfs in the spectral range covered. As the Stauffer et al. (2010) relation is only valid to and our NGC 1960 sample includes sources of lower mass, we use the Plavchan et al. (2009) relation as our photospheric model.

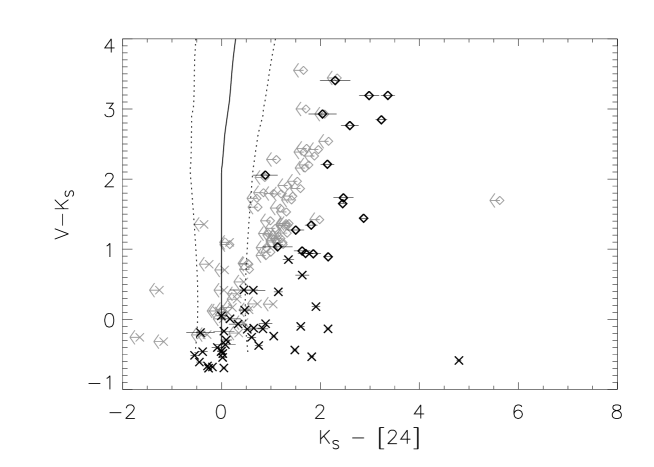
In Figure 5 we show the vs colours of the target sources. Crosses are used to mark the bright targets taken from Sanner et al. (2000), and diamonds mark the sources identified as lower mass cluster members. Upper limits for targets with signal to noise of less than 5 are marked in grey. Over-plotted as a solid line is the expected photospheric colour from Plavchan et al. (2009). We determine the dispersion around this relation by considering the colours of the bright targets () for which the photosphere should have been detectable. A histogram of the colours of these sources was constructed, and a Gaussian function fitted to the left-hand side of this function (the targets which are not likely to have excess emission). The best fitting Gaussian FWHM was found to be 0.14. This dispersion includes the errors in (typically around 0.05 for targets with , see Table 3), and so we adopt this value as a minimum uncertainty on the photospheric values of . We expect the errors on the colours to increase for fainter targets due to decreased signal to noise. Using all significant detections () we examined the errors on the 24m photometry as a function of . We found that the effect of source colour on the uncertainty was relatively weak. This is because for most of the spectral range considered in this study we are detecting sources with excess emission only, and so the error levels were nearly constant. We determined a linear fit to the uncertainty (using a test) on and added this to the measurement of the dispersion adopted as a minimum uncertainty as discussed above. This gave us a final uncertainty on from our photometry of . We also consider the differences between the photospheric colour models from Plavchan et al. (2009), Gorlova et al. (2006) and Stauffer et al. (2010). For each value of we interpolate the predicted for each model, and add the standard deviation of the three results in quadrature to the error relation already described. These errors are shown (at a 3 level) by a dotted line in Figure 5.
5 Discussion
5.1 Relationship with multiplicity
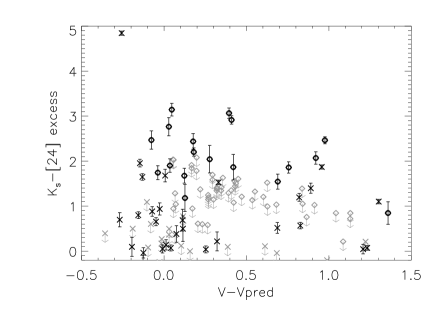
As the majority of stars are binary or higher-order multiples (Abt, 1983; Duquennoy & Mayor, 1991) , the relationship between stellar multiplicity and debris disc parameters has been the subject of much recent study. Cieza et al. (2009) presented an analysis of IRAC data from several Spitzer legacy surveys which showed that for projected separations of 40au, systems were half as likely to retain their primordial discs than systems with larger separations (suggesting a disc lifetime of 0.3-0.5 Myr for close binaries compared to 3-5 Myr around single stars). Conversely Trilling et al. (2007) found in their study of field stars (with most stars 600 Myr old) that the binary stars had a higher incidence of debris discs than single stars. Debris discs were found to be more common around binaries with small (3au) or large (50au) separations than around intermediate separation binaries (3–50au). This survey concentrated on detections at 70m, and so on discs that were further from their host stars. Plavchan et al. (2009) found no evidence of the trend suggested by Trilling et al. (2007), and Duchêne (2010) found no significant dependence of debris disc incidence with binarity or binary separation. Stauffer et al. (2010) showed tentative evidence that in the 100 Myr Blanco 1 cluster binary stars have a lower 24m excess frequency than single stars (adopting height above a single star isochrone as a binarity proxy). They combine their results with data from the Pleiades ( 100 Myr) and NGC 2547 ( 35 Myr) and find an overall chance of 0.05% that the excess around single and binary samples is drawn from the same parent population (using a K-S test). In Smith et al. (2011) we showed that there was no evidence for a dependence of debris disc emission on stellar multiplicity in the 27 Myr old open cluster IC4665. We adopt the same analysis here using height above a single star isochrone as a proxy for multiplicity and compare this to colour. The isochrone was tuned from a fit to the Pleiades following Stauffer et al. (2010). This is shown in the left-hand panel of Figure 6. Bright star 4 (HIP 26354) stands out in this plot as having a very high band magnitude for its colour (). This source has been identified as having high variability ( Lefèvre et al. 2009) and therefore the target’s photometric measurements are dependent on the epoch of observation, a possible cause of the anomalously high band magnitude.
We expect that most targets will have (where ) is the predicted V band magnitude of a star of a given colour from the single star isochrone). Sources with are possible triples or higher-order systems. From our sample of 132 targets (from Tables 2 and 1) 26 are found to have , giving a detection rate of % higher-order multiples. This is somewhat higher than is seen in other studies (9–12%, Abt 1983; Abt & Levy 1976; Duquennoy & Mayor 1991), although not significantly so. This could also be reduced if we take into account errors on the 2MASS photometry, which means that at the 3 level a minimum of 16 sources (12% of the target list) have , which agrees with the expected frequencies of higher-order multiplicity. In general we do not see any evidence for a relation between and (see right-hand panel of Figure 6). We separate the sample into sources with and those with and compare the colours of the two populations. Using a K-S test on the excess for sources with significant 24m detections (where the excess is defined as and is determined from the Plavchan model for the photospheric colours) we find only a 70% probability that we can reject the null hypothesis that the samples are drawn from the same population. We also compare the two samples ( and ) including the upper limits. We use the ASURV statistical package (LaValley et al., 1990) to compare the two populations using several tests (see Feigelson & Nelson 1985 for a description of the tests). We find that the probability of rejecting the null hypothesis (that the samples are drawn from the same population) is 0.47 according to the logrank test, and 0.74 according to the Peto-Prentice test. The differences in the probabilities arise from the different treatments of the upper limits in the methods. In either case we see no evidence that the multiplicity of the stellar system affects the incidence of debris disc emission in this cluster.
5.2 Placing NGC 1960 into context
The NGC 1960 cluster is at an interesting age for planet formation. At 16Myr, any gas giant planets are expected to have formed and the circumstellar disc evolved from a gas-rich to gas-poor state within Myr for high-mass stars (B, A and early F-type, e.g. Hernández et al. 2005) or 5–7Myr for low mass stars (F5 or later, e.g. Hernández et al. 2007). Terrestrial planet formation on the other hand is expected to continue for up to 100Myr (e.g. Weidenschilling 1977). A peak in 24m debris emission at 10–20 Myr around A and early F-type stars can be interpreted as evidence of delayed stirring of the disc by the formation of Pluto-sized bodies at this epoch (see e.g. Kenyon & Bromley 2002). We now explore how NGC 1960 fits in with these models.
5.2.1 Excess emission at 24m
A ‘rise and fall’ in 24m excess emission (emission above expected photospheric levels) was first identified by Hernández et al. (2007) and Currie et al. (2008). The peak levels of excess emission (defined as emission above that arising from the stellar photosphere) and frequency of excess are seen to rise from 5–10 Myrs, before falling after 20 Myrs around higher mass (A and early F-type) stars. We examine NGC 1960 in the context of this pattern by comparing the rate of excess around the higher mass stars to other clusters of ages 5 Myrs.
In Figure 7 we show the frequency of excess emission for stars of spectral types B0-F5 observed with MIPS. We include data for the following open clusters: Orionis (5Myr, Hernández et al. 2009, 2010); Upper Scorpius (5 Myr, Carpenter et al. 2009 and Chen et al. 2005); Orion OB1b (5 Myr) and Orion OB1a (8.5Myr, both Hernández et al. 2006); Lower Centaurus Crux (16Myr) and Upper Centaurus Lupus (17Myr, both Chen et al. 2005); NGC 2232 (25Myr, Currie et al. 2008, note that only 38/209 stars have published MIPS 24m observations); IC 4665 (27Myr, Smith et al. 2011); NGC 2547 (35Myr, Gorlova et al. 2007); IC 2391 (50Myr, Siegler et al. 2007); Blanco 1 (100Myr, Stauffer et al. 2010); the Pleiades (115Myr, Gorlova et al. 2006); the Hyades (625Myr, Cieza et al. 2009); and a collection of field stars (Bryden et al., 2006). For all clusters we extract the spectral type for each object listed in the above papers. Where no spectral type is listed we assign a spectral type based on the colour of the target. The relationship was determined from Kurucz model profiles of stars at typical temperatures for each spectral type (so F5 stars have , temperatures taken from Cox 2000). The frequencies are listed in Table 5. Clusters with less than 10 members in the spectral range B0-F5 were excluded from Figure 7 but are listed in Table 5 and included in our examination of levels of excess emission below. Stars are identified as having excess emission if they satisfy the following criteria (following Currie et al. 2008):
| (1) |
and
| (2) |
where this last condition takes into account systematic errors, e.g. from dispersion in colours. It should be noted that all the excess sources identified in NGC 1960 meet these criteria. for each target is given by the relation determined by Plavchan et al. (2009), as shown in Figure 5. For this spectral range we expect (dereddened). Extinction () was taken from the papers mentioned above, and converted to and according to the relations in Rieke & Lebofsky (1985) and Flaherty et al. (2007) respectively.
In Figure 7 and Table 5 we give a 1 confidence limit on the frequency of excess. We assign a confidence limit based on the tabulated confidence limits of Poisson statistics presented in Gehrels (1986). However, for several of the samples listed in Table 5 there are sources with 24m upper limits or non-detections, which could potentially be disc hosts. For all sources with upper limits to their 24m photometry, we take the 3 upper limit to [24] and determine if the source could have an excess. This is determined by checking if the upper limit would be listed as an excess according to equations 1 and 2. If the upper limit is below these cut-offs, the source is an upper limit with no disc. Otherwise the target is a potential host of excess emission. We use the number of sources with possible excess emission to define another upper limit to the confidence limits on the frequency of excess for each cluster. The largest of this upper limit and that determined from the Poisson statistics of Gehrels (1986) is presented in Table 5 and shown in Figure 7. In this plot we can see that the cluster NGC 1960 has a fairly typical frequency of excess emission given its age (%). We can possibly see the peak of excess frequency at 10–20 Myr, however the statistics for the younger clusters are quite uncertain. As only one young cluster (Upper Sco, 5 Myr) has a low frequency of excess, we cannot confirm with this data that the “rise and fall” in frequency is statistically significant.

| Name | Age | B0-F5 | F6-K9 | Reference | ||
|---|---|---|---|---|---|---|
| Myr | Excess/Total | % with excess | Excess/Total | % with excess | ||
| Orionis | 51 | 16/44 | 36 | 22/401 | 5 | Hernández et al. (2009, 2010) |
| Orion OB1b | 51 | 11/28 | 39 | 3/5X | – | Hernández et al. (2006) |
| Upper Sco | 51 | 10/70 | 14 | 6/23 | 26 | Carpenter et al. (2009); Chen et al. (2005) |
| Orion OB1a | 8.51.5 | 12/25 | 56 | 1/1X | – | Hernández et al. (2006) |
| Pic | 126 | 5/9X | – | 2/12 | 17 | Rebull et al. (2008) |
| Sco-Cen | 16-17 | 13/25 | 52 | 3/11 | 27 | Chen et al. (2005) |
| NGC 1960 | 16 | 21/71 | 30 | 14/61 | 23 | This paper |
| NGC2232 | 254 | 9/23 | 39 | 4/15 | 26 | Currie et al. (2008) |
| IC4665 | 275 | 9/23 | 39 | 12/29 | 41 | Smith et al. (2011) |
| NGC2547 | 355 | 15/33 | 45 | 21/41 | 51 | Gorlova et al. (2007) |
| IC2391 | 505 | 2/18 | 11 | 6/13 | 46 | Siegler et al. (2007) |
| Blanco 1 | 10020 | 4/12 | 33 | 1/25 | 4 | Stauffer et al. (2010) |
| Pleiades | 11520 | 7/44 | 16 | 3/38 | 13 | Gorlova et al. (2006) |
| Hyades | 62550 | 1/11 | 9 | 1/67 | 1 | Cieza et al. (2009) |
| Field | 4000a | 0/4X | – | 6/65 | 9 | Bryden et al. (2006) |
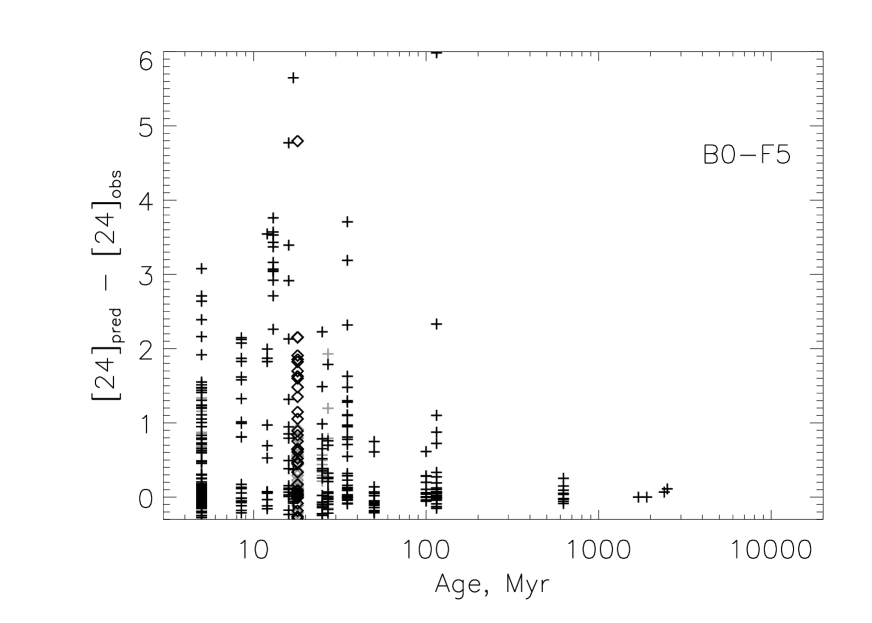
In addition to considering the overall frequencies of excess, we also consider the level of excess emission for each target, given as , where is determined from predicted for the target (see above paragraph). We show the excesses for stars in the spectral range B0–F5 in Figure 8. Here we include observed excess emission from stars in h and Persei (Currie et al., 2008) which were excluded from the statistical analysis because of uncertain membership lists, and Pictoris and the field stars which were excluded from Figure 7 because of the low number of objects (see Table 5). Here we again see that NGC 1960 (shown by diamonds) is comparable to other clusters of a similar age. Bright star 14, which has the highest levels of excess emission in this cluster (and also has excess in the near infrared) has one of the highest levels of excess emission observed, although its SED shows that the emission is consistent with debris disc emission rather than that from a primordial disc (see section 4). This figure displays more clearly that there is a ‘rise and fall’ in the upper envelope of 24m excess emission, as the peak levels of 24m excess reach a maximum at 10–20Myr before falling off. A fall-off proportional to time is expected from models of the evolution of debris discs (e.g. Dominik & Decin 2003; Wyatt et al. 2007).
We show the same plots for lower mass stars of spectral types F6–K9. In Figure 9 we can see that the frequency of 24m excess falls off roughly in proportion to time after 50Myr. NGC 1960 has a fairly typical excess frequency for its age (%), although given the large upper limit, we have really defined a lower limit to the frequency of 23% (excluding the Poisson statistical errors). There is some evidence of the ‘rise and fall’ of debris discs seen in higher mass stars, although again the statistics for the younger clusters are highly uncertain. In this plot it appears that the peak frequencies of debris discs around F6–K9 type stars are seen in clusters of ages Myrs with an abrupt fall-off at 100 Myrs (see also Table 5). This is slower than the expected time taken to form Pluto-mass proto-planets at 1 au, and in fact according to the models of Kenyon & Bromley (2005), a later peak in the 24m excess emission is to be expected for discs at greater distances from the star (see Figures 7 and 8 of Kenyon & Bromley 2005). This suggests that rather than witnessing excesses arising from terrestrial planet regions around F6–K9 type stars, we may be seeing the inner edge of more distant planetesimal belts (due to the apparently smooth increase in frequencies towards a peak at 30–50 Myrs). Constraints on longer wavelength emission for the cluster samples would be required to explore this possibility. Siegler et al. (2007) found evidence that for clusters older than 10Myrs the frequency of 24m excess emission fell-off steadily. We do not find such a strong relation in our data (we have considered a larger set of cluster samples), although it is clear that by 100Myr excess frequencies are very low. These differences are likely to arise from different criteria for identifying the presence of excess. This plot demonstrates that the frequency of debris disc emission is likely to be a function of many factors aside from the age of the cluster, however with the small numbers of clusters under consideration, an examination of these factors is beyond the scope of this paper.
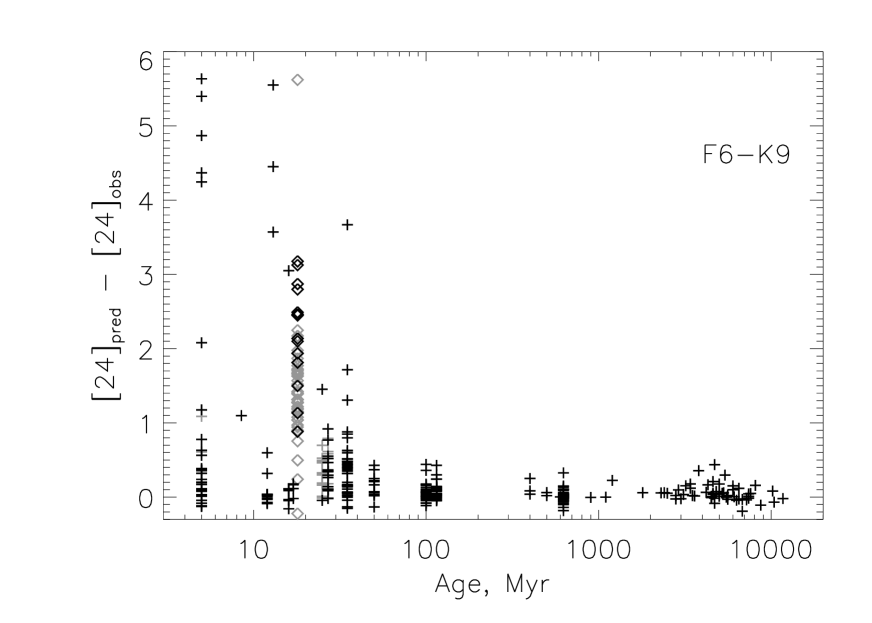
In Figure 10 we see that the levels of excess emission observed around stars in the spectral range F6–K9 in NGC 1960 are typical for stars of similar ages. We do not see evidence for a delayed peak (levels of excess emission being higher in clusters Myr old) in this spectral range. This may in part be due to residual primordial disc populations at 5Myr around lower mass stars, for example those seen in Upper Sco (sources in this cluster with were determined to be primordial in Carpenter et al. 2009). However removal of the primordial disc targets would mean that the frequency of true debris discs in these clusters is lower, and therefore the evidence for a delayed peak would be stronger. In common with the drop off in frequency of excess in this spectral range, high levels of excess emission are not seen at ages 100Myrs in these clusters.

Interestingly, for NGC 1960 we see no evidence that either the frequency or the levels of excess emission at 24m are dependent on spectral type. This is somewhat contrary to the expectation that 24m excess should be longer lived around brighter stars, which arises from the difference in time taken to form planetesimals at larger radial distances around A-type stars (excess detected at 24m imply a temperature of 100–150K, translating to an offset of 3–30au around A and early F-type stars and 0.5–3au around solar-type stars assuming thermal equilibrium). Within the context of current planet formation theories (Kenyon & Bromley, 2005, 2006), we might expect the 24m emission around lower mass stars of 16Myr to be the result of massive collisions between proto-planetary bodies, and we might expect it to occur less frequently than the planetesimal collisions thought to be responsible for the 24m emission around higher mass stars. In fact, for the majority of the clusters listed in Table 5, there is no significant difference between the frequency of excess emission observed around B0–F5-type stars and that observed around F6–K9-type stars. However, for the majority of clusters older than 5Myr, the typical levels of excess emission observed around higher mass stars are higher than that observed around lower mass stars (see Figures 8 and 10), which does agree with the model predictions. This does not appear to be the case for NGC 1960. The highest observed excess is indeed observed around a higher mass star (bright target 14), but in general the levels of excess emission observed are similar regardless of colour (proxy for spectral type). Our results are biased by the fact that only relatively high levels of excess will be detected around lower mass stars, and so there is probably a population of stars in the range F6–K9 with lower levels of excess than shown in Figure 10. However, as we do not see a population of higher mass stars with larger excesses (excluding bright star 14), these results might suggest that there are a large number of lower mass sources in the NGC 1960 cluster that are currently undergoing massive collisions. The reason why many sources in the cluster should experience massive collisions at a similar time is unclear, and if this is the reason for the 24m excess observed around lower mass stars, this presents a challenge to current planet formation theories. In Table 6 we show the frequencies of stars with large 24m excess () for clusters with populations 10 stars in both spectral bins. From these statistics we cannot see a significant difference between the frequencies of large excess emission observed in NGC 1960 and other clusters. We do find some evidence that the frequency of stars with large excess emission drops at 25Myr amongst both high and low mass samples, which is in agreement with steady-state evolution models. We cannot determine if the relationship between the frequency of large excesses in the lower mass (F6–K9 type) and higher mass (B0–F5 type) spectral bins is significantly different for NGC 1960, partly due to the high errors involved (errors on the frequencies were determined in the same way as errors on the overall excess frequencies in Table 5). With the current data, we have no statistically significant evidence that NGC 1960 is different from other clusters of similar ages.
| Name | Age | B0-F5 | F6-K9 | Reference | ||
|---|---|---|---|---|---|---|
| Myr | Excess/Total | % with excess | Excess/Total | % with excess | ||
| Orionis | 51 | 0/44 | 0 | 4/401 | 1 | Hernández et al. (2009, 2010) |
| Upper Sco | 51 | 2/70 | 3 | 6/23 | 26 | Carpenter et al. (2009); Chen et al. (2005) |
| Sco-Cen | 16-17 | 5/25 | 20 | 1/11 | 9 | Chen et al. (2005) |
| NGC 1960 | 16 | 3/71 | 4 | 8/61 | 13 | This paper |
| NGC2232 | 254 | 1/23 | 4 | 0/15 | 0 | Currie et al. (2008) |
| IC4665 | 275 | 0/23 | 0 | 0/29 | 0 | Smith et al. (2011) |
| NGC2547 | 355 | 0/33 | 0 | 2/41 | 5 | Gorlova et al. (2007) |
| IC2391 | 505 | 0/18 | 0 | 0/13 | 0 | Siegler et al. (2007) |
| Blanco 1 | 10020 | 0/12 | 0 | 0/25 | 0 | Stauffer et al. (2010) |
| Pleiades | 11520 | 0/44 | 0 | 0/38 | 0 | Gorlova et al. (2006) |
| Hyades | 62550 | 0/11 | 0 | 0/67 | 0 | Cieza et al. (2009) |
Notes: Errors on excess frequencies are determined in the same manner as for Table 5 as described in the text. Only clusters with 24m observations of 10 stars in each spectral bin have been included in this table.
In summary the levels and frequency of excess emission seen in NGC 1960 are not significantly different to other open clusters of similar ages. The bright target 14 (BD +34 1098) has one of the highest levels of excess emission observed in early-type stars, but SED fitting has shown that this is consistent with debris as opposed to primordial emission.
5.2.2 Excess emission at 8m
A subset of the open clusters discussed above also have published 8m IRAC photometry. We consider how the frequency of 8m excess evolves with time. Frequencies are listed by age and spectral bin in Table 7. Errors on the frequency are derived from upper limits and the Poisson statistics of Gehrels (1986) as described for the 24m data in the preceeding section.
| Name | Age | B0-F5 | F6-K9 | Reference | ||
|---|---|---|---|---|---|---|
| Myr | Excess/Total | % with excess | Excess/Total | % with excess | ||
| Orionis | 51 | 2/44 | 5 | 15/401 | 4 | Hernández et al. (2009, 2010) |
| Orion OB1b | 51 | 1/29 | 3 | 0/5X | – | Hernández et al. (2006) |
| Upper Sco | 51 | 5/68 | 7 | 4/45 | 9 | Carpenter et al. (2006) |
| Orion OB1a | 8.51.5 | 2/25 | 8 | 0/1X | – | Hernández et al. (2006) |
| NGC 1960 | 16 | 3/71 | 4 | 0/61 | 7 | This paper |
| NGC 2232 | 254 | 1/23 | 4 | 1/15 | 7 | Currie et al. (2008) |
| IC4665 | 275 | 1/23 | 4 | 0/29 | 10 | Smith et al. (2011) |
| NGC 2547 | 355 | 2/33 | 6 | 2/41 | 5 | Gorlova et al. (2007) |
Notes: X Frequency of excess emission in this spectral range
highly uncertain due to low number of stars.
a No significant detections at 8m in this spectral range.
These figures confirm that 8m excess emission is rare amongst stars of ages 5Myr. We do not see any evidence for a dependence of 8m excess frequency on the age of the cluster. As we only have upper limits for many of the clusters, particularly for the lower mass spectral bin, any dependence of 8m frequency on age or spectral type is difficult to determine. However we can state that the 8m excess frequency is always lower than the 24m frequency. This demonstrates that hot–warm dust is much less common than warm–cool debris disc emission. This in turn suggests that discs are likely to lie at a few to tens of au from the star, and not within 1 or a few au. This is consistent with the picture of debris discs arising from statistical studies and studies of individual debris disc hosts (see Wyatt 2008 and references therein).
6 Conclusions
In this paper we have presented a study of the cluster NGC 1960 (M36) using archival Spitzer MIPS and IRAC data. These data have been used to search for debris discs in the cluster. Our conclusions are as follows:
-
1.
We have identified 38 targets as having significant 24m excess. One target, bright star 14 (BD +34 1098), has very high levels of excess (85). Three targets (including BD +34 1098) have significant excess emission at near-infrared wavelengths. The SEDs of these targets have been examined and the emission has been determined to be consistent with second generation debris emission, as opposed to remnant primordial discs.
-
2.
The frequency and overall levels of excess emission observed in NGC 1960 are consistent with other clusters of similar ages (30% of B0–F5 type stars, and 23% of F6-K9 stars have significant excess). The data from this cluster are consistent with a ‘rise and fall’ in debris disc emission amongst higher mass stars, and with a possible delayed peak in emission amongst lower mass stars.
-
3.
We find no evidence for a dependence of excess emission on stellar multiplicity. We are however restricted in our examination of this relationship by a lack of completeness in the 24m flux measurements for intermediate to lower mass stars.
Acknowledgments
This work is based on archival data obtained with the Spitzer Space Telescope, which is operated by the Jet Propulsion Laboratory, California Institute of Technology under a contract with NASA. This paper has made use of data obtained at the William Herschel Telescope, which is operated on the island of La Palma by the Isaac Newton Group in the Spanish Observatorio del Roque de los Muchachos of the Instituto de Astrofísica de Canarias. R.S. would like to acknowledge the support of the UK Science and Technology Facilities Council (STFC).
References
- Abt (1983) Abt H. A., 1983, ARAA, 21, 343
- Abt & Levy (1976) Abt H. A., Levy S. G., 1976, ApJS, 30, 273
- Alonso et al. (1996) Alonso A., Arribas S., Martinez-Roger C., 1996, A&A, 313, 873
- Bryden et al. (2006) Bryden G., et. al., 2006, ApJ, 636, 1098
- Canup (2004) Canup R. M., 2004, ARAA, 42, 441
- Carpenter et al. (2006) Carpenter J. M., Mamajek E. E., Hillenbrand L. A., Meyer M. R., 2006, ApJL, 651, L49
- Carpenter et al. (2009) Carpenter J. M., Mamajek E. E., Hillenbrand L. A., Meyer M. R., 2009, ApJ, 705, 1646
- Chen et al. (2005) Chen C. H., Jura M., Gordon K. D., Blaylock M., 2005, ApJ, 623, 493
- Chen et al. (2005) Chen C. H., et al., 2005, ApJ, 634, 1372
- Chen et al. (2009) Chen C. H., Sheehan P., Watson D. M., Manoj P., Najita J. R., 2009, ApJ, 701, 1367
- Cieza et al. (2009) Cieza L. A., et al., 2009, ApJL, 696, L84
- Cox (2000) Cox A. N., 2000, Allen’s astrophysical quantities. (New York: AIP Press; Springer)
- Currie et al. (2008) Currie T., Kenyon S. J., Balog Z., Rieke G., Bragg A., Bromley B., 2008, ApJ, 672, 558
- Currie et al. (2009) Currie T., Lada C. J., Plavchan P., Robitaille T. P., Irwin J., Kenyon S. J., 2009, ApJ, 698, 1
- Currie et al. (2008) Currie T., Plavchan P., Kenyon S. J., 2008, ApJ, 688, 597
- Dominik & Decin (2003) Dominik C., Decin G., 2003, ApJ, 598, 626
- Duchêne (2010) Duchêne G., 2010, ApJL, 709, L114
- Duquennoy & Mayor (1991) Duquennoy A., Mayor M., 1991, A&A, 248, 485
- Engelbracht et al. (2007) Engelbracht C. W., et al., 2007, PASP, 119, 994
- Fazio et al. (2004) Fazio G. G., et al., 2004, ApJS, 154, 10
- Feigelson & Nelson (1985) Feigelson E. D., Nelson P. I., 1985, ApJ, 293, 192
- Flaherty et al. (2007) Flaherty K. M., Pipher J. L., Megeath S. T., Winston E. M., Gutermuth R. A., Muzerolle J., Allen L. E., Fazio G. G., 2007, ApJ, 663, 1069
- Gehrels (1986) Gehrels N., 1986, ApJ, 303, 336
- Gorlova et al. (2006) Gorlova N., Rieke G. H., Muzerolle J., Stauffer J. R., Siegler N., Young E. T., Stansberry J. H., 2006, ApJ, 649, 1028
- Gorlova et al. (2007) Gorlova N., Balog Z., Rieke G. H., Muzerolle J., Su K. Y. L., Ivanov V. D., Young E. T., 2007, ApJ, 670, 516
- Grigorieva et al. (2007) Grigorieva A., Artymowicz P., Thébault P., 2007, A&A, 461, 537
- Hartmann et al. (1998) Hartmann L., Calvet N., Gullbring E., D’Alessio P., 1998, ApJ, 495, 385
- Hasan (2005) Hasan P., 2005, Bulletin of the Astronomical Society of India, 33, 151
- Hernández et al. (2005) Hernández J., Calvet N., Hartmann L., Briceño C., Sicilia-Aguilar A., Berlind P., 2005, AJ, 129, 856
- Hernández et al. (2006) Hernández J., Briceño C., Calvet N., Hartmann L., Muzerolle J., Quintero A., 2006, ApJ, 652, 472
- Hernández et al. (2007) Hernández J., et al., 2007, ApJ, 662, 1067
- Hernández et al. (2009) Hernández J., Calvet N., Hartmann L., Muzerolle J., Gutermuth R., Stauffer J., 2009, ApJ, 707, 705
- Hernández et al. (2010) Hernández J., Morales-Calderon M., Calvet N., Hartmann L., Muzerolle J., Gutermuth R., Luhman K. L., Stauffer J., 2010, ApJ, 722, 1226
- Hillenbrand (2008) Hillenbrand L. A., 2008, Physica Scripta Volume T, 130, 014024
- Jeffries (2006) Jeffries R. D., 2006. In Chemical Abundances and Mixing in Stars in the Milky Way and its Satellites, ed. S. Randich, L. Pasquini pp 163–170. Berlin: Springer-Verlag
- Jeffries et al. (2009) Jeffries R. D., Jackson R. J., James D. J., Cargile P. A., 2009, MNRAS, 400, 317
- Kenyon & Bromley (2002) Kenyon S. J., Bromley B. C., 2002, ApJL, 577, L35
- Kenyon & Bromley (2005) Kenyon S. J., Bromley B. C., 2005, AJ, 130, 269
- Kenyon & Bromley (2006) Kenyon S. J., Bromley B. C., 2006, AJ, 131, 1837
- Kenyon & Hartmann (1995) Kenyon S. J., Hartmann L., 1995, ApJS, 101, 117
- Klahr (2008) Klahr H., 2008, Nature, 52, 78
- Kroupa (2001) Kroupa P., 2001, MNRAS, 322, 231
- Lagrange et al. (2000) Lagrange A.-M., Backman D. E., Artymowicz P., 2000, in V. M., P. B. A., S. R. S., eds, Protostars and Planets IV Planetary Material around Main-Sequence Stars. (Tuscan: University of Arizona Press), pp 639–672
- LaValley et al. (1990) LaValley M., Isobe T., Feigelson E. D., 1990, in Bulletin of the American Astronomical Society Vol. 22 of Bulletin of the American Astronomical Society, Software Report: ASURV, The Pennsylvania State University. pp 917–+
- Lefèvre et al. (2009) Lefèvre L., Marchenko S. V., Moffat A. F. J., Acker A., 2009, A&A, 507, 1141
- Magnier et al. (1999) Magnier E. A., Waters L. B. F. M., Groot P. J., van den Ancker M. E., Kuan Y.-J., Martín E. L., 1999, A&A, 346, 441
- Makovoz & Marleau (2005) Makovoz D., Marleau F. R., 2005, PASP, 117, 1113
- Mayne & Naylor (2008) Mayne N. J., Naylor T., 2008, MNRAS, 386, 261
- Moerchen et al. (2007) Moerchen M. M., Telesco C. M., Packham C., Kehoe T. J. J., 2007, ApJL, 655, L109
- Muzerolle et al. (2010) Muzerolle J., Allen L. E., Megeath S. T., Hernández J., Gutermuth R. A., 2010, ApJ, 708, 1107
- Naylor & Jeffries (2006) Naylor T., Jeffries R. D., 2006, MNRAS, 373, 1251
- Plavchan et al. (2009) Plavchan P., Werner M. W., Chen C. H., Stapelfeldt K. R., Su K. Y. L., Stauffer J. R., Song I., 2009, ApJ, 698, 1068
- Reach et al. (2005) Reach W. T., et al., 2005, PASP, 117, 978
- Rebull et al. (2008) Rebull L. M., et al., 2008, ApJ, 681, 1484
- Rieke & Lebofsky (1985) Rieke G. H., Lebofsky M. J., 1985, ApJ, 288, 618
- Rieke et al. (2005) Rieke G. H., et al., 2005, ApJ, 620, 1010
- Rieke et al. (2004) Rieke G. H., et al., 2004, ApJS, 154, 25
- Sanner et al. (2000) Sanner J., Altmann M., Brunzendorf J., Geffert M., 2000, A&A, 357, 471
- Siegler et al. (2007) Siegler N., Muzerolle J., Young E. T., Rieke G. H., Mamajek E. E., Trilling D. E., Gorlova N., Su K. Y. L., 2007, ApJ, 654, 580
- Siess et al. (2000) Siess L., Dufour E., Forestini M., 2000, A&A, 358, 593
- Skrutskie et al. (2006) Skrutskie M. F., et al., 2006, AJ, 131, 1163
- Smith et al. (2009) Smith R., Churcher L. J., Wyatt M. C., Moerchen M. M., Telesco C. M., 2009, A&A, 493, 299
- Smith et al. (2011) Smith R., Jeffries R. D., Oliveira J. M., 2011, MNRAS, 411, 2186
- Stauffer et al. (2010) Stauffer J. R., et al., 2010, ApJ, 719, 1859
- Su et al. (2006) Su K. Y. L., et al., 2006, ApJ, 653, 675
- Trilling et al. (2007) Trilling D. E., et al., 2007, ApJ, 658, 1289
- Weidenschilling (1977) Weidenschilling S. J., 1977, MNRAS, 180, 57
- Weidenschilling & Cuzzi (1993) Weidenschilling S. J., Cuzzi J. N., 1993, in E. H. Levy & J. I. Lunine ed., Protostars and Planets III Formation of planetesimals in the solar nebula. pp 1031–1060
- Wetherill & Stewart (1993) Wetherill G. W., Stewart G. R., 1993, Icarus, 106, 190
- Wyatt (2008) Wyatt M. C., 2008, ARAA, 46, 339
- Wyatt et al. (2007) Wyatt M. C., Smith R., Greaves J. S., Beichman C. A., Bryden G., Lisse C. M., 2007, ApJ, 658, 569
- Yin et al. (2002) Yin Q., Jacobsen S. B., Yamashita K., Blichert-Toft J., Télouk P., Albarède F., 2002, Nature, 418, 949