Incommensurate Magnetic Order in TbTe3
Abstract
We report a neutron diffraction study of the magnetic phase transitions in the charge-density-wave (CDW) TbTe3 compound. We discover that in the paramagnetic phase there are strong 2D-like magnetic correlations, consistent with the pronounced anisotropy of the chemical structure. A long-range incommensurate magnetic order emerges in TbTe3 at = 5.78 K as a result of continuous phase transitions. We observe that near the temperature the magnetic Bragg peaks appear around the position (0,0,0.24) (or its rational multiples), that is fairly close to the propagation vector associated with the CDW phase transition in TbTe3. This suggests that correlations leading to the long-range magnetic order in TbTe3 are linked to the modulations that occur in the CDW state.
1 Introduction
The RTe3 family of compounds (R=rare earth) have recently attracted renewed interest as a model system for layered (two-dimensional) charge-density-wave (CDW) materials. RTe3 crystallizes in an orthorhombic structure, composed of double layers of planar Te- sheets separated by corrugated R-Te layers. The average chemical structure can be described using the space group [1] (in this setting the lattice parameters and are close to each other, whereas is approximately 6 times longer), although in these materials an incommensurate lattice modulation with a wave vector is observed below the phase transition into the CDW state [2, 3]. Such a CDW state with modulations along the -axis is present in all RTe3 materials. However, the members with the heaviest rare-earth elements exhibit a second CDW phase transition at lower temperatures that is characterized by a modulation wavevector [4, 5]. The temperatures of these two CDW transitions show opposite trends as a function of the R-atom mass. Whereas decreases towards heavier members of the family (i.e., going from La to Tm), the associated with the - axis incommensurability is higher for heavier compounds [4, 6]. For the specific compound studied in this report, TbTe3, transport and diffraction experiments yield = 336 K. Although transport measurements do not clearly reveal the presence of a second CDW transition, STM measurements performed at 6 K do show an ordering pattern that is associated with the wavevector [5]. More recent high resolution x-ray diffraction measurements confirm the presence of a transverse CDW at low temperatures, with wave-vector , though is at present unknown [7].
The RTe3 family appears to be a classic CDW system, for which the CDW wavevector corresponds to an enhancement of the generalized susceptibility , which is largely driven by FS nesting [8, 9, 10]. The enhancement is, however, far from being a divergence, suggesting an important role for strong electron-phonon coupling [10]. The Fermi surface is composed of states associated with the double Te layers, and is therefore similar for all members of the series. The principal role of the rare earth ion R appears to be chemical pressure, which only modestly affects the resulting CDW wavevectors [2, 4].
In addition to hosting an incommensurate CDW, for magnetic rare earth ions, RTe3 also hosts long range antiferromagnetic order at low temperatures. The magnetic phase transitions of RTe3 have been studied using magnetisation [6, 11, 12, 13], calorimetry [6, 11, 13] and electrical resistivity [6, 11, 12, 13]. Using these macroscopic techniques the temperatures of the magnetic transitions have been determined and a phase diagram summarizing the temperatures of CDW and magnetic phase transition of RTe3 has been established in Ref. [6]. However, the nature of the long-range magnetic order in this family of compounds has not yet been studied by diffraction techniques, and the effect of the incommensurate lattice modulation on the magnetic structure is unknown. To bridge this gap we have performed neutron scattering experiments in the representative compound TbTe3. The choice of this material was dictated by the following reasons. In order to establish possible relationship of the propagation vectors associated to the CDW state and of the long-range magnetic order one needs to study the material that has reasonably close values between and . Based on this condition, the DyTe3 and TbTe3 are both attractive candidates according to their phase diagram [6]. DyTe3 undergoes two magnetic phase transitions at T3.6 K and T3.45 K [6]. However, due to high absorption of Dy the neutron measurements on DyTe3 are too challenging [14]. TbTe3 exhibits three closely located magnetic phase transitions at the following temperatures: = 5.78 K, = 5.56 K and = 5.38 K [6]. Here, we present a study of the magnetic phase transitions in TbTe3 using powder and single crystal neutron diffraction.
2 Experimental techniques
Single crystals of TbTe3 were grown by slow cooling a binary melt, as described elsewhere [11]. As the material is rather air-sensitive, the TbTe3 powder was obtained by crushing the single crystals in He-atmosphere. The powder was immediately sealed in a cylindric vanadium can of 6 mm in diameter used for the measurements.
Powder neutron diffraction experiments were performed at the DMC cold-neutron diffractometer [15](neutron spallation source SINQ [16], PSI) in the temperature range 1.5 – 60 K. Most of the data were collected with neutron wavelengths of Å, giving access to the wave vectors range 0.1–3.4 Å-1. Typical exposure times were hours.
The experiments on the single crystals of TbTe3 with size of roughly mm3 were performed at the TriCS single crystal diffractometer [17]. A pyrolytic graphite (PG) monochromator was used with neutron wavelength Å. A 120 mm long PG filter was installed in the beam in order to ensure full suppression of higher-order neutrons. The temperature range of interest for these measurements is K, because the three magnetic phase transitions are close to each other in the range K. This interval was scanned with steps of K. To ensure the required accuracy in temperature an ”orange”-type He flow cryostat was used. One of the samples was aligned in the [H,K,0] plane and a second sample was aligned in the [0,K,L]. The normal beam geometry was employed, tilting the detector in the range of -10…10 deg. This allowed to access reflections with L=1 and H=1, respectively.
3 Powder Diffraction Results


The data at 60 K was taken as a reference for the scattering in the paramagnetic phase of TbTe3. The average chemical structure of TbTe3 was refined with Fullprof [18] within the space group following a structural model of the RTe3-type materials developed in Ref. [19]. This analysis indicates the presence of several preferred orientations in the sample, impeding high-quality refinements of both chemical and magnetic structures. Nevertheless, the lattice parameters obtained from the data Å , Å , and Å are in agreement with those published earlier [19]. In what follows we concentrate on the differences of the data taken at temperatures lower than 60 K. In this experimental setup the low-temperature changes in the chemical structure of TbTe3 are not resolved.
Figure 1 shows difference-patterns at selected temperatures, obtained by eliminating the contribution from the chemical structure with the subtraction of the diffraction pattern at 60 K. As expected from the macroscopic properties of TbTe3, magnetic Bragg peaks appear in the diffraction patterns collected below = 5.78 K. Furthermore, relatively sharp asymmetric peaks appear in the diffraction patterns even at temperatures slightly higher then (e.g., the patterns taken at 6.2 K and 7 K). As shown in Fig. 1, these unusual peaks have an extended shoulder towards higher wavevectors. Such scattering profiles from powders are typical for systems with pronounced quasi-two-dimensional (quasi-2D) properties, as observed e.g. in graphite [20] or in 2D magnetic materials [21]. Therefore, one may expect that in a relatively broad temperature range above TbTe3 exhibits quasi-2D behavior. The positions of the magnetic Bragg peaks are temperature-dependent and may be clearly distinct in different magnetic phases. This suggests that the magnetic phases occurring in TbTe3 are modulated and the propagation vector is locked-in at incommensurate position only below . In addition, the asymmetric peaks above are located at a different wavevector as compared to magnetic Bragg peaks observed just below . This is best seen for the scattering profiles shown in Fig. 1 in the vicinity of Å .
Figure 2 shows the magnetic diffraction pattern measured from TbTe3 at 2 K. Some of the magnetic peaks could be indexed in terms of the average chemical cell and are labeled in Fig. 2 (due to the complexity of the pattern the use of single-crystal neutron diffraction data was essential for this step). Clearly, most of the magnetic Bragg peaks are at positions incommensurate with the average chemical structure of the material. It may be speculated that the broad magnetic peaks observed in the vicinity of Å and Å are composed by many magnetic Bragg peaks which are located close to each other in wave-vector space, due to the rather large value of the lattice parameter . We note here that among the magnetic Bragg peaks we could not identify any with non-zero value of .
4 Single-Crystal Diffraction Results

Taking into account the complexity of the powder diffraction patterns observed in magnetically ordered phases of TbTe3, there are considerable difficulties not only in developing a proper model of the arrangement of the Tb magnetic moments, but even in determining the propagation vectors in the magnetically ordered phases. In a trial to overcome these difficulties a series of single-crystal experiments were performed at the base temperature =2 K, below . Those reflections, which were successfully indexed at =2 K, are labeled in Fig. 2. There was no attempt to index the peaks observed in powder diffraction patterns at higher temperatures. Instead, the temperature evolution of those peaks that were identified at = 2 K was traced up to K.
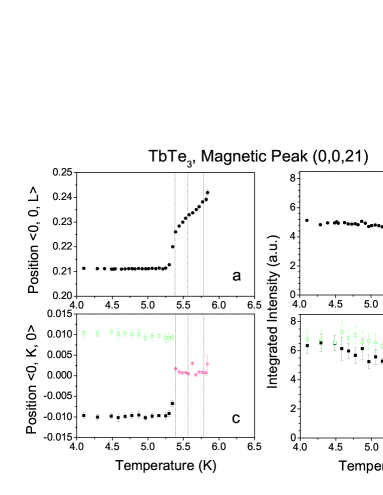
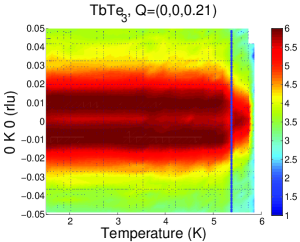
Figure 3 shows false-color maps of neutron intensities taken in a close vicinity of the () incommensurate magnetic reflection in the temperature range K. At the base temperature this reflection has incommensurate components both along the and directions. However, the incommensurate component along the direction appears to be small and diminishes above in a step-like way. Above the incommensurate components along the direction is also temperature-dependent. For a more quantitative analysis the scans for each temperature are fitted assuming a Gaussian shape for a Bragg reflection. The resulting temperature dependence of the position and intensity of the peak () are shown in Fig. 4. The modulation vector along the direction stays constant within the precision of the measurements below . Above the propagation vector increases smoothly and reaches the value of at . The modulation vector along the direction is also constant below , while above this temperature the component of the modulation vanishes. The intensity measured around the position also appears to be nearly temperature-independent below . Above this temperature however, the overall intensity observed in the vicinity of the position drops by a factor of 2, as can be deduced from Fig. 4b-d. Further the intensity gradually decreases and above we could not detect any scattering above the background level around that position. In the whole studied temperature range the width of the peaks is limited by resolution. Gradual decrease of the Bragg intensity suggest a continuous character of the phase transition that the crystal undergoes at , whereas an abrupt change in magnetic intensity at points to a first order phase transition.
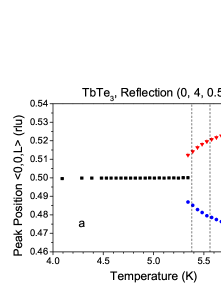
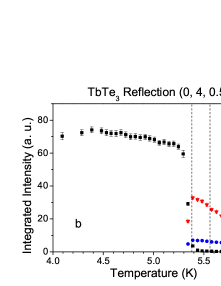
The magnetic Bragg peaks, characterized by the propagation vector (0,0,0.5), exhibit a qualitatively different behavior. Figure 5 shows the temperature dependence of the Bragg peak in the temperature range K as a representative example. Whereas below the propagation vector is (0,0,0.5), above this temperature the position of the magnetic Bragg peaks becomes incommensurate in a step-like fashion as (0,0,0.5) with displaying a temperature dependence. The intensity of the magnetic peak decreases abruptly at and smoothly diminishes towards . Weak magnetic peaks around the position are still observed in paramagnetic phase up to K.
5 Discussion and Conclusions
We have performed a first study of magnetic phase transitions in TbTe3 by powder and single-crystal neutron diffraction. We find that in the paramagnetic phase, slightly above = 5.78 K, there are pronounced 2D-like magnetic correlations. At long-range magnetic order emerges as a result of a continuous phase transition. In all three magnetically ordered phases, incommensurate modulations are present. This observation is at variance with the typical behavior of unmodulated rare-earth intermetallic compounds (see e.g. [22, 23]). Incommensurate magnetic structures often appear in these materials just below the phase transition into the magnetically ordered state. However, in most cases magnetoelastic coupling and crystal-field effects typically result in a lock-in transition to a commensurate magnetic structure. The behavior found in TbTe3 only partially resembles these general expectations. As shown in Fig. 5 the magnetic propagation vector of the -type observed just below turns out to be locked-in below into the simple antiferromagnetic position . However, the magnetic Bragg peaks observed below near the position (0,0,0.24), stabilize at low temperature at the incommensurate position (0,,0.21). This effect is possibly due to the incommensurate lattice modulation present in TbTe3 in the CDW state.
The propagation vectors of the magnetic structures, which we succeeded to identify in TbTe3, have components either along the or directions, or a linear combination of both. We could not assign any of the magnetic peaks, observed in powder diffraction pattern, as a Bragg reflection with non-zero component of the propagation vector. Therefore, our results do not point towards a link of the propagation vector associated with the second CDW phase transition and of the magnetic order in TbTe3. Nonetheless, we discover that near the temperature the magnetic Bragg peaks appear around the positions (0,0,0.24) (or its rational multiples). This value is fairly close to the propagation vector [4] associated with the high-temperature CDW phase transition, raising the possibility that correlations leading to the long-range magnetic order in TbTe3 might be linked to the modulated chemical structure in the CDW state. These results stimulate further work to refine the magnetic structure in this and related magnetic RTe3 compounds, with the ultimate goal of establishing how the CDW and magnetic order interact and coexist.
6 Acknowledgments
This work is based on the experiments performed at the Paul Scherrer Institut, Switzerland and has been supported by the Swiss National Foundation for the Scientific Research within the NCCR MaNEP pool. Work at Stanford University was supported by the Department of Energy, Office of Basic Energy Sciences under contract DE-AC02-76SF00515.
References
References
- [1] Norling B K and Steinfink H 1966 Inorg. Chem. 5, 1488
- [2] DiMasi E, Aronson M C, Mansfield J F, Foran B and Lee S 1995 Phys. Rev. B 52, 14516
- [3] Malliakas C, Billinge S J L, Kim H J and Kanatzidis M G 2005 J. Am. Chem. Soc. 127, 6510
- [4] Ru N, Condron C L, Margulis G Y, Shin K Y, Laverock J, Dugdale S B, Toney M F and Fisher I R 2008 Phys. Rev. B 77, 035114
- [5] Fang A, Ru N, Fisher I R and Kapitulnik A 2007 Phys. Rev. Lett. 99, 046401
- [6] Ru N, Chu J H and Fisher I R 2008 Phys. Rev. B 78, 012410
- [7] A. Banerjee and T. Rosenbaum, private communication
- [8] Brouet V, Yang W L, Zhou X J, Hussain Z, Moore R G, He R, Lu D H, Shen Z X, Laverock J, Dugdale S B, Ru N, and Fisher I R 2008 Phys. Rev. B 77, 235104
- [9] Laverock J, Dugdale S B, Major Zs, Alam M A, Ru N, Fisher I R, Santi G and Bruno E 2005 Phys. Rev. B 71, 085114
- [10] Johannes M D and Mazin I I 2008 Phys. Rev. B 77, 165135
- [11] Ru N and Fisher I R 2006 Phys. Rev. B 73, 033101
- [12] Yuji Iyeiri, Teppei Okumura, Chishiro Michioka and Kazuya Suzuki 2003 Phys. Rev. B 67, 144417
- [13] Deguchi K, Okada T, Chen G F, Ban D, Aso N and Sato N K 2009 Journal of Physics Conference Series 150, 042023
- [14] In fact we gave a trial and performed a neutron powder diffraction experiment on DyTe3 packed into a double wall vanadium container. However, with the exception of two most intense peaks, the signal to noise ratio was not favorable for reliable conclusions. Therefore, we do not report the neutron scattering results obtained for DyTe3 and concentrate here on TbTe3.
- [15] Fischer P, Keller L, Schefer J and Kohlbrecher J 2000 Neutron News 11, 19
- [16] Blau B et al., 2009 Neutron News 20, 5
- [17] Schefer J, Könnecke M, Murasik A, Czopnik A, Strässle Th, Keller P and Schlump N 2000 Physica B 276-278, 168
- [18] Rodríguez-Carvajal J 1993 Physica B 192, 55
- [19] Malliakas C and Kanatzidis M 2006 J. Am. Chem. Soc. 128, 12612
- [20] Warren B E 1941 Phys. Rev. 59, 693
- [21] Roessli B, Fischer P, Zolliker M, Allenspach P, Mesot J, Staub U, Furrer A, Kaldis E, Bucher B, Karpinski J, Jilek E and Mutka H 1993 Z. Phys. B 91, 149
- [22] Gignoux D and Schmitt D 1993 Phys. Rev. B 48, 12682
- [23] Gignoux D and Schmitt D 1994 JMMM 129, 53