Also at ]the Department of Physics, University of Illinois, Urbana, Illinois 61801, USA Also at ]the Canadian Institute for Advanced Research, Toronto, Ontario, M5G 1Z8 Canada
Low-temperature, high-density magneto-optical trapping of potassium
using the open 4S 5P transition at 405 nm
Abstract
We report the laser cooling and trapping of neutral potassium on an open transition. Fermionic 40K is captured using a magneto-optical trap (MOT) on the closed transition at 767 nm and then transferred, with unit efficiency, to a MOT on the open transition at 405 nm. Because the state has a smaller line width than the state, the Doppler limit is reduced. We observe temperatures as low as 63(6) K, the coldest potassium MOT reported to date. The density of trapped atoms also increases, due to reduced temperature and reduced expulsive light forces. We measure a two-body loss coefficient of cms-1, and estimate an upper bound of cm2 for the ionization cross section of the 5P state at 405 nm. The combined temperature and density improvement in the 405 nm MOT is a twenty-fold increase in phase space density over our 767 nm MOT, showing enhanced pre-cooling for quantum gas experiments. A qualitatively similar enhancement is observed in a 405 nm MOT of bosonic 41K.
I Introduction
Magneto-optical trapping is a widely applied technique for creating cold, dense samples of neutral atoms. Ultracold gas experiments typically use a MOT for accumulation and pre-cooling, although laser cooling alone has been unable to create a quantum degenerate sample without a subsequent evaporative cooling step. Density in laser cooling is limited by repulsive radiation pressure due to re-absorption Walker et al. (1990); *wieman:1992 and by collisional loss processes Weiner et al. (1999). The temperature limit, in the simplest two-level theory, is the Doppler temperature, , where is the line width of the excited state Wineland and Itano (1979); *letokhov:1981; *ashkin:1979. Fortuitously, the multi-level structure of ground states can allow for sub-Doppler temperatures Lett et al. (1989); Dalibard and Cohen-Tannoudji (1989), but these effects are not seen in all atomic species. Particularly, sub-Doppler cooling is non-existent in 6Li Lin et al. (1991) and weak Modugno et al. (1999); *cataliotti:1998 or difficult to observe DeMarco and Jin (1999) in 40K. Since these are the only two stable fermionic alkali isotopes, and thus commonly used for the study of quantum degenerate Fermi gases, new cooling techniques would be beneficial.
Laser cooling on narrower lines can achieve lower temperatures, as has been demonstrated with earth alkaline atoms. In the case of 88Sr Vogel et al. (1999); *katori:1999, the broad 30 MHz cycling transition (1SP1) at 461 nm is used to capture atoms, followed by cooling on the narrow 7.5 kHz forbidden transition (1SP0) at 689 nm. This two-step process combines a large capture rate during the first stage with the low Doppler temperature of the second stage. Alkali atoms do not have forbidden transitions, however higher excited states do have smaller line widths. For example, in potassium, the 5P state has a line width of 1.19 MHz, roughly five times smaller than the 6.0 MHz line width of the 4P state that has been used in all potassium laser cooling experiments to date. However, the 4S 5P transition is not a cycling transition, and alternate decay channels could depolarize magnetic sublevels, increase the depumping effect of the cooling laser, and interrupt laser cooling mechanisms.
It has been shown that laser cooling is possible using open transitions, both with metastable helium Koelemeij et al. (2003); *Tychkov:2004 and with lithium Duarte et al. (2011). In the case of He*, a MOT on the 2S 3P transition at 389 nm was shown to have a lower two-body loss rate , lower re-absorption rates, and a larger cooling force per recoil, resulting in increased density. No reduction in temperature was seen since the He* 2P and 3P excited states have the same lifetime. In the case of 6Li, a MOT on the narrower 2S 3P line did have a reduced temperature, but not an increased density. Unlike lithium and metastable helium, potassium has a D-state decay channel that could perturb laser cooling more significantly (see Fig. 1). In addition to reduced Doppler temperatures, higher-state transitions may provide other advantages: multi-photon decay channels allow for background-free detection, and the smaller transition wavelength reduces the diffraction limit of imaging and manipulation. A specific advantage of the potassium transition at 405 nm is the emergence of inexpensive GaN diode lasers Gustafsson et al. (2000a) in the 395–410 nm range.
In this paper, we explore cooling and trapping on the “blue” transition of 40K at 405 nm. Atoms are first accumulated in a standard MOT on the “D2” transition at 767 nm, for which the capture rate is high. The cloud is then transferred to a blue MOT, where we observe a temperature as low as 63(6) K and a ten-fold increase in density. Although the capture velocity and beam size of the blue MOT are small, we observe almost perfect transfer between MOTs. We find that loss rates in the blue MOT from two-body loss and photoionization are higher than in the D2 MOT, but these processes play little role on the sub-100-ms timescale that we observe is necessary for equilibration.
Our paper is organized as follows. In Sec. II we discuss the state structure of potassium and calculate the effect of excitation on the transition using the steady-state Bloch equations. We estimate the cooling and trapping power with a semiclassical treatment. In Sec. III we describe the critical components of our experimental system, including generation of 405 nm light with diode lasers and the optical configuration of the two-color MOT. Sec. IV presents the primary results of the paper: the capture fraction, lifetime, temperature, and density of a blue potassium MOT. Further laser cooling results, prospects, and conclusions are discussed in Sec. V.
| Line width () | 6.04(1) MHz | 1.19(2) MHz |
|---|---|---|
| Branching ratio | Cycling | 1 / 6.4(7) |
| Cross section () | 0.28 m2 | 0.010(1) m2 |
| Saturation intensity () | 1.752(3) mW/cm2 | 23(2) mW/cm2 |
| Steady-state polarization | 100% | 61(1)% |
| Depumping probability | 0% | 18(2)% |
| Doppler temperature | 145.0(3) K | 23.5(7) K |
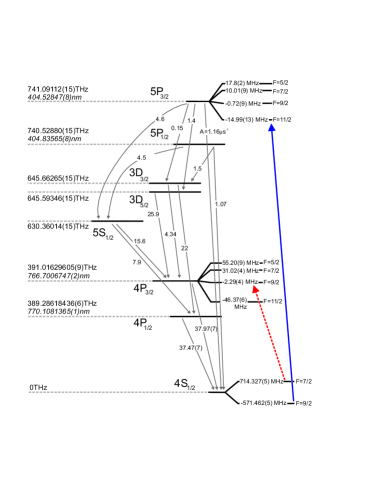
II 4S1/2 5P3/2 Transition: Theory and Background
Figure 1 shows a level diagram of potassium including all possible decay paths from the state. The line strength of the is kHz, thirty times weaker than the MHz D2 transition. However, the excited state is broadened to MHz by other decay channels: five out of six times the state decays via a three-photon cascade instead of emitting a single blue photon.
We calculate excitation properties and cooling rates of the 4S 5P transition by finding the steady-state solution of the optical Bloch equation (OBE) that includes all relevant levels. Because the transition is not closed, continual excitation requires a repumping beam. As in the experiment, atoms are repumped on the transition, whose strength is chosen here to be powerful enough that it is not the limiting timescale.
Table 1 summarizes key steady-state properties of excitation to the 4P and 5P states. Unlike a cycling transition, polarized optical pumping on the open transition scrambles the states. However, the depolarization rate is not quite as bad as Fig. 1 might suggest: 61% of atoms in the manifold are in the doubly-polarized state. The resonant scattering cross-section is nearly thirty times smaller than the D2 transition due to a narrow line width and smaller wavelength. This could be an advantage for cooling trapped or dense clouds since optical density is reduced. However, for the same reasons, the saturation intensity is an order of magnitude higher, increasing optical power requirements.
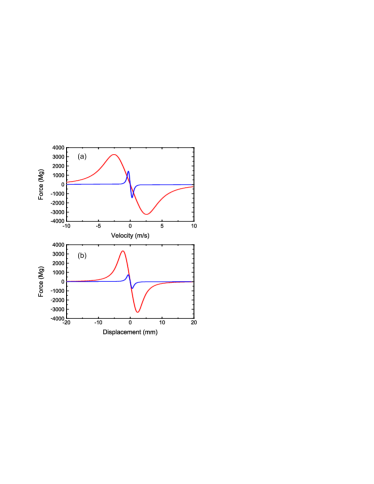
Laser cooling and trapping performance of the 4S 5P transition is estimated by including either Doppler or Zeeman shifts in the OBE calculation. Recoil heating is assumed to arise from momentum diffusion with an energy increase of per scattering event, where , is the transition frequency, is the speed of light, and is the mass of 40K. Heating in the multi-photon decay path is due to the scattering of three photons of various momenta.
At comparable scaled detunings and saturations, Fig. 2(a) shows that the blue transition can achieve a higher cooling rate than the D2 transition. However, the maximum force and the capture range are greatly reduced. Figure 2(b) shows that the spring constant is comparable for the two transitions, but that trapping volume is larger for the red MOT. These calculations support the strategy of loading atoms using the 767 nm transition and then transferring later to the 405 nm MOT for additional cooling and compression. We find a steady-state temperature of 24 K for the blue transition, indeed smaller than the Doppler temperature of the D2 transition. In fact, this steady-state temperature in the low-intensity limit is slightly (18%) less than the expected in the two-level Doppler cooling, because the multi-photon cascade causes slower momentum diffusion than single-photon kicks with the same total energy.
Another difference between laser cooling with blue instead of infrared light is the possibility of photo-ionization. The ionization energy of potassium is 1049.56782(2) THz Sansonetti (2008), so the 5P state can be ionized by the 405 nm MOT light, or by any photon with a wavelength less than nm. By contrast, the 4P state requires photons with a wavelength less than nm, which is not provided by the D2 MOT. The 405 nm trap light may also ionize any state during the radiative cascade, and the 767 nm repump can only ionize the 5P state.
III Laser and MOT Setup
The 4S 5P transition is placed in a wavelength band for which GaN diode lasers have become readily available, due to recent commercial interest in optical storage media. These sources have been exploited to perform 4S 5P spectroscopy of natural potassium Gustafsson et al. (2000a, b); Uetake et al. (2003); Halloran et al. (2009); Mills et al. (2005) and enriched 40K Behrle et al. (2011), but never laser cooling.
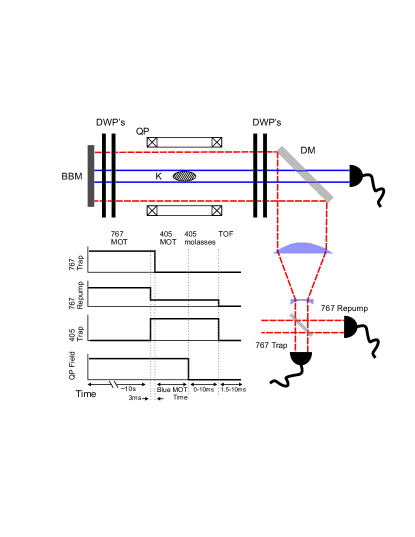
Our 405 nm master is a grating-stabilized diode laser with 10 mW output. Half of this power is injected Park and Yoon (2003); *komori:2003 into a 100-mW diode laser (“slave” laser). At room temperature, and without injection, the slave diode spectrum is nearly 1 nm wide and centered at 407 nm. The poor current and temperature tuning characteristics of the diode, approximately +0.02 nm/mA and +0.05 nm/∘C respectively, necessitate cooling the diode to -20 ∘C. Without injection the Fabry-Perot spectrum of the slave is featureless, but strong peaks are evident when successfully injected. The output of the slave, typically run at 60 mW, is passed through a single-mode optical fiber before use in the MOT (see Fig. 3).
The remaining 5 mW of master light is used for modulation transfer spectroscopy using a natural-abundance potassium cell heated to 140∘C. The elevated temperature is necessary because the Doppler cross section is two orders of magnitude smaller than the cross section for the D2 transition. We lock to the transition in 39K (with unresolved excited states) that is the closest spectral feature to the transition of 40K. The additional 0.5 GHz shift is performed with acousto-optic modulators.
The D2 MOT uses retro-reflected beams along three axes, limited by the cell windows to be 4.4 cm diameter in the horizontal axes and 3.8 cm diameter in the vertical axis. A background potassium vapor is created from enriched dispensers (5% 40K), and collected in the trap using the strong transition. During this phase, there are two overlapping 767 nm beams: a trap with 200 mW total power detuned by MHz from the transition, and a repump with 150 mW total power detuned by MHz from the transition. After s, the blue MOT is turned on, with up to 30 mW total power. As shown in Fig. 3, the smaller (10-mm diameter) blue beams are mixed with the infrared beams on dichroic mirrors. We use dichroic wave plates to control independently the polarization of the two colors. There is a short time (3 ms) when both MOTs are on before the D2 trap light is turned off (see timing diagram of Fig. 3), while the D2 repump beam is left on at reduced intensity. Blue laser cooling is applied typically for 30 ms.
Laser-cooled atoms are characterized using absorption imaging on the 4S 4P transition. Temperature is measured in time-of-flight, with a gaussian fit to the density distribution imaged at various free-flight times, 1.5–10 ms after the magnetic field and laser beams have been extinguished.
IV 4S 5P MOT of 40K
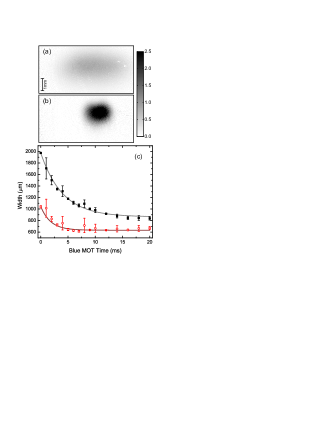
We observe that atoms are held by the blue MOT. A typical absorption image of the D2 MOT and the blue MOT are shown in Fig. 4. Across a broad range of parameters, compression occurs, which is a first indication of cooling (see below for further discussion). Fig. 4(c) shows that cloud sizes in the blue MOT equilibrate with a relaxation time of 2–4 ms. In a damped oscillator model of atomic motion in a MOT, where , the atomic position damps with a time , which is consistent with what we measure — 4 ms using the typical force curves of Fig. 2(b). Atomic velocities would damp in a much faster time s, so after the spatial compression shown in Fig. 4(c), blue laser cooling is complete.
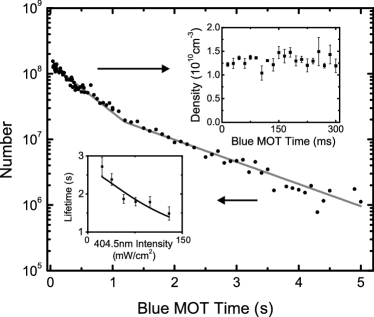
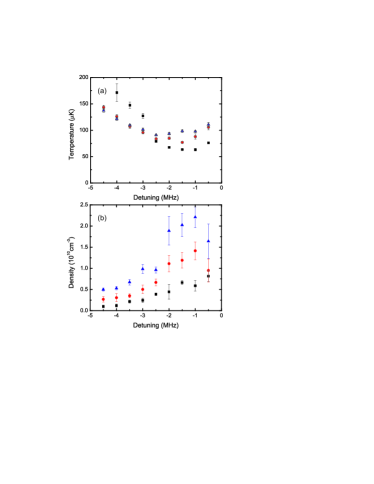
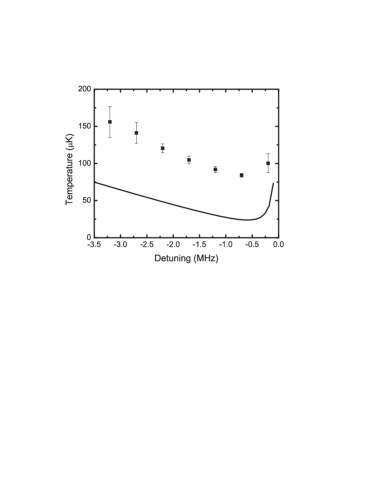
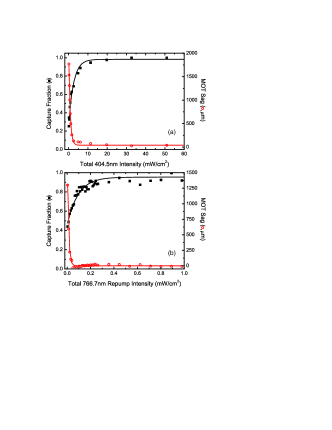
Figure 5 shows the capture fraction and gravitational sag as a function of blue trap intensity and D2 repump intensity. In both cases, providing the saturation intensity (see Table 1) is sufficient for complete transfer into a strong trap.111For low intensities, the measured sag values are roughly ten times larger than the sag one would expect from our simple model. Also note that the displacement switches sign for intermediate repump intensity, which would not be the case if the spring constant were monotonic in intensity. It may be that optical pumping is not correctly functioning in a MOT at intensities far below saturation. From exponential fits, the transfer efficiency is 90% for 5.5 mW/cm2 of blue trap intensity and for 0.21 mW/cm2 of D2 repump intensity. The 26:1 ratio between these follows approximately the ratio of saturation intensities of each transition.
Since the capture rate of a MOT from background vapor is proportional to for small beam sizes , one would expect a reduction in steady-state number in going from the 767 nm to the 405 nm trap. Accordingly, a measurement of atom number versus time (Fig. 6) shows no sign of saturation after a hundred-fold reduction in number. We can then use such a measurement as a clean measure of loss processes, ignoring additional capture.
We also note that since we are not loading atoms from vapor into the blue MOT, we can choose small beam sizes, and reduce the 405 nm power requirement. In our configuration, the total power required at saturation intensity is roughly 2.5 mW, which our laser system can easily provide.
The loss data in Fig. 6 fits well to two exponential time scales, indicative of two-body losses at high density, and one-body losses (collisions with background atoms plus photoionization) at low density. The loss rate from a MOT is Weiner et al. (1999)
| (1) |
where is the one-body lifetime, is the two-body loss coefficient, and is the atomic number density. To find , we fit the data at long hold times ( s, ) where the atom number is strongly reduced and two-body losses can be neglected. The lifetime versus 405 nm intensity is show as the bottom inset to Fig. 6. The decrease in lifetime versus intensity could be evidence of ionization losses. The line is a fit to a model that includes the intensity dependence of both the ionization rate and the excited state fraction. A separate study of MOT fluorescence versus laser power, comparing D2 and blue MOTs, was used to calibrate excited state fraction versus intensity. Together, we find an ionization cross section of cm2 for the state at 405 nm. We report this value as an upper bound since the ionizing beams are also the trap beams and we cannot rule out other trap loss processes 222From similar measurements of lifetime versus repump intensity, we constrain the effect of repump ionization to be negligible. One would guess a 15 s ionization time for mW/cm2 using the rubidium ionization cross section of cm2 measured at 690 nm by Ambartzumian et al. (1976).
There are no measured cross sections for the ionization of the 5P states of potassium, only for the equivalent state, 6P, of rubidium Anderlini et al. (2004); Courtade et al. (2004); Ambartzumian et al. (1976). These rates may be comparable since the ionization cross section from the potassium 4P states Petrov et al. (2000); Amina et al. (2008) is within a factor of three of the 5P cross section for rubidium Dinneen et al. (1992). Indeed, our upper bound is similar in magnitude to the cm2 cross section for the 6P state of rubidium from Ambartzumian et al. (1976) measured at nm.
To measure the two-body loss rate, we assume the MOT density distribution is Gaussian, which is supported by absorption images of the cloud. From the top inset in Fig. 6 we see that the peak density at short times is roughly constant, so the number decays as
| (2) |
We then fit the data at short hold times ( ms) to an exponential decay and use (from our previous measurement) and to find . At MHz, we find cm3/s for mW/cm2, and cm3/s for mW/cm2. These are relatively high two-body loss rates compared to alkali MOTs on the D2 transition, which are typically in the range of to cm3/s Weiner et al. (1999). Values for 40K 767 nm MOTs vary from Ridinger et al. (2011) to cm3/s Modugno et al. (2003). Therefore, overall loss rates in the 405 nm MOT are larger than the 767 nm MOT, but for the short timescales (tens of milliseconds) required to decrease temperatures and increase density, these loss rates are still negligible.
A primary motivation for cooling on a narrow transition is to achieve a lower asymptotic temperature. Figure 7 shows how the temperature and peak density of the blue MOT change with detuning, at various quadrupole gradients. A minimum temperature of 63(6) K is seen for a 5 G/cm magnetic quadrupole gradient. Operating the MOT with higher gradients increases both the temperature and density. In all cases, the minimum temperature and maximum density are found near .
We attribute the increase in density to three factors. First, the temperature in the MOT is lower. Second, expulsive forces due to re-absorption are reduced, because the same spring constant is achieved with a scattering rate that is six times smaller. The open transition may further reduce re-absorption by pumping to the ground states. Third, the optical density seen by both the incident and the scattered blue photons is reduced by a factor of nearly thirty.
In comparison, our D2 MOT density is typically cm-3 and temperature is typically K. Since phase space density scales as , the combined K and cm-3 (achieved with a blue MOT at 7.5 G/cm and -1.5 MHz detuning) realizes a twenty-fold enhancement in phase space density.
V Prospects and Conclusions
Since the lowest observed MOT temperatures occur at low gradients, one might expect continued improvement during an optical molasses phase, in which magnetic fields have been extinguished (see Fig. 3 inset). Figure 8 shows that minimum temperature, roughly K, is comparable to what is observed in the MOT, although optimized at a lower detuning, . These temperatures are still more than three times the Doppler temperature calculated in Sec. II, which may be due to a low cooling rate as compared to the short molasses time available. Indeed we observe that the temperature asymmetry between the vertical and horizontal axes in the MOT persists during the molasses phase, when no gradient asymmetry remains. Even the asymptotic temperature might not be expected to reach the Doppler limit: while the calculation in Sec. II includes multi-level effects, it neglects three-dimensional effects, reabsorption, and heating due the intensity fluctuations. The latter effect has been shown by Chanelière et al. to limit one-dimensional Doppler cooling to several times in Sr, when Sisyphus and other sub-Doppler mechanisms are absent Chanelière et al. (2005). In the case of 4S 5P cooling in 40K, polarization gradient cooling may be interrupted by the optical pumping and depolarization effects of the three-photon cascade.
We have also observed laser cooling and trapping for bosonic 41K on the transition. A similar order-of-magnitude increase in MOT density was apparent, although further study is warranted. With any isotope of potassium, additional improvements might be possible with more sophisticated timing sequences of detuning and/or intensity of cooling light, which has been fruitful in narrow-line MOTs and in sub-Doppler cooling of bosonic potassium Landini et al. (2011).
In sum, we have observed laser cooling and trapping of neutral potassium on the open transition. Nearly complete transfer from a D2 MOT is observed, although the blue MOT is ineffective at capturing directly from the vapor. We observe temperatures as low as 63(6) K along one axis, roughly half of the Doppler limit on the D2 transition. Unlike sub-Doppler cooling observed in 40K during a molasses phase Modugno et al. (1999), our approach reduces temperature while the confining MOT quadrupole field is still present. Density is enhanced ten-fold in typical conditions, due to lower temperature and reduced re-absorption effects. Cooling and compression together increase the phase space density by more than an order of magnitude, demonstrating improved pre-cooling for quantum degenerate gas experiments. The reduced wavelength of the transition may enable improved imaging or addressing resolution ( nm), for instance in the context of strongly correlated lattices where the spacing is typically 500 nm Bakr et al. (2009); *sherson:2010.
More generally, since the potassium cascade structure is shared by sodium, rubidium, cesium, and francium, our work along with Ref. Duarte et al. (2011) suggests that laser cooling and trapping using the S P transition will be successful for all alkali atoms.
Acknowledgements.
We would like to thank K. Pilch, M. Schöll, and F. Stubenrauch for their early contributions, and thank B. DeMarco, R. Hulet, P. Duarte, A. Steinberg, M. Greiner, and S. Trotzky for discussions. This work was supported by the DARPE OLE program, ARO, AFOSR, CIfAR, CFI, and NSERC.References
- Walker et al. (1990) T. Walker, D. Sesko, and C. Wieman, Phys. Rev. Lett. 64, 408 (1990).
- Lindquist et al. (1992) K. Lindquist, M. Stephens, and C. Wieman, Phys. Rev. A 46, 4082 (1992).
- Weiner et al. (1999) J. Weiner, V. S. Bagnato, S. Zilio, and P. S. Julienne, Rev. Mod. Phys. 71, 1 (1999).
- Wineland and Itano (1979) D. J. Wineland and W. M. Itano, Phys. Rev. A 20, 1521 (1979).
- Letokhov and Minogin (1981) V. S. Letokhov and V. G. Minogin, Phys. Rep. 73, 1 (1981).
- Ashkin and Gordon (1979) A. Ashkin and J. P. Gordon, Op. Lett. 4, 161 (1979).
- Lett et al. (1989) P. Lett, W. Phillips, S. Rolston, C. Tanner, R. Watts, and C. Westbrook, J. Opt. Soc. Am. B 6, 2084 (1989).
- Dalibard and Cohen-Tannoudji (1989) J. Dalibard and C. Cohen-Tannoudji, J. Opt. Soc. Am. B 6, 2023 (1989).
- Lin et al. (1991) Z. Lin, K. Shimizu, M. Zhan, F. Shimizu, and H. Takuma, Jpn. J. Appl. Phys. 30, L1324 (1991).
- Modugno et al. (1999) G. Modugno, C. Benkő, P. Hannaford, G. Roati, and M. Inguscio, Phys. Rev. A 60, R3373 (1999).
- Cataliotti et al. (1998) F. S. Cataliotti, E. A. Cornell, C. Fort, M. Inguscio, F. Marin, M. Prevedelli, L. Ricci, and G. M. Tino, Phys. Rev. A 57, 1136 (1998).
- DeMarco and Jin (1999) B. DeMarco and D. S. Jin, Science 285, 1703 (1999).
- Vogel et al. (1999) K. Vogel, T. Dinneen, A. Gallagher, and J. Hall, IEEE Trans. Instrum. Meas. 48, 618 (1999).
- Katori et al. (1999) H. Katori, T. Ido, Y. Isoya, and M. Kuwata-Gonokami, Phys. Rev. Lett. 82, 1116 (1999).
- Koelemeij et al. (2003) J. C. J. Koelemeij, R. J. W. Stas, W. Hogervorst, and W. Vassen, Phys. Rev. A 67, 053406 (2003).
- Tychkov et al. (2004) A. S. Tychkov, J. C. J. Koelemeij, T. Jeltes, W. Hogervorst, and W. Vassen, Phys. Rev. A 69, 055401 (2004).
- Duarte et al. (2011) P. M. Duarte, R. A. Hart, J. M. Hitchcock, T. A. Corcovilos, T. L. Yang, A. Reed, and R. G. Hulet, “All-optical production of a lithium quantum gas using narrow-line laser cooling,” (2011), arXiv:1109.6635 .
- Gustafsson et al. (2000a) U. Gustafsson, J. Alnis, and S. Svanberg, Am. J. Phys. 68, 660 (2000a).
- Sansonetti (2008) J. E. Sansonetti, J. Phys. Chem. Ref. Data 37, 7 (2008).
- Wang et al. (1997) H. Wang, J. Li, X. T. Wang, C. J. Williams, P. L. Gould, and W. C. Stwalley, Phys. Rev. A 55, R1569 (1997).
- Berends et al. (1988) R. Berends, W. Kedzierski, J. Atkinson, and L. Krause, Sp. Acta 43B, 1069 (1988).
- Mills et al. (2005) A. Mills, J. A. Behr, L. A. Courneyea, and M. R. Pearson, Phys. Rev. A 72, 024501 (2005).
- Arimondo et al. (1977) E. Arimondo, M. Inguscio, and P. Violino, Rev. Mod. Phys. 49, 31 (1977).
- Gustafsson et al. (2000b) U. Gustafsson, G. Somesfalean, J. Alnis, and S. Svanberg, Applied Optics 39, 3774 (2000b).
- Uetake et al. (2003) S. Uetake, K. Hayasaka, and M. Watanabe, Jpn. J. Appl. Phys. 42, L332 (2003).
- Halloran et al. (2009) L. Halloran, S. Fostner, E. Paradis, and J. Behr, Op. Comm. 282, 554 (2009).
- Behrle et al. (2011) A. Behrle, M. Koschorreck, and M. Köhl, Phys. Rev. A 83, 052507 (2011).
- Park and Yoon (2003) C. Y. Park and T. H. Yoon, Jpn. J. Appl. Phys. 42, L754 (2003).
- Komori et al. (2003) K. Komori, Y. Takasu, M. Kumakura, Y. Takahashi, and T. Yabuzaki, Jpn. J. Appl. Phys. 42, 5059 (2003).
- Note (1) For low intensities, the measured sag values are roughly ten times larger than the sag one would expect from our simple model. Also note that the displacement switches sign for intermediate repump intensity, which would not be the case if the spring constant were monotonic in intensity. It may be that optical pumping is not correctly functioning in a MOT at intensities far below saturation.
- Note (2) From similar measurements of lifetime versus repump intensity, we constrain the effect of repump ionization to be negligible. One would guess a 15\tmspace+.1667ems ionization time for \tmspace+.1667emmW/cm2 using the rubidium ionization cross section of \tmspace+.1667emcm2 measured at 690\tmspace+.1667emnm by Ambartzumian et al. (1976).
- Anderlini et al. (2004) M. Anderlini, E. Courtade, D. Ciampinie, J. H. Müller, O. Morsch, and E. Arimondo, J. Opt. Soc. Am. B 21, 480 (2004).
- Courtade et al. (2004) E. Courtade, M. Anderlini, D. Ciampini, J. H. Müller, O. Morsch, E. Arimondo, M. Aymar, and E. J. Robinson, J. Phys. B 37, 967 (2004).
- Ambartzumian et al. (1976) R. V. Ambartzumian, N. P. Furzikov, V. S. Letokhov, and A. A. Puretsky, Appl. Phys. 9, 335 (1976).
- Petrov et al. (2000) I. Petrov, V. Sukhorukov, E. Leber, and H. Hotop, Euro. Phys. J. D 10, 53 (2000).
- Amina et al. (2008) N. Amina, S. Mahmooda, S. Haqa, M. Kalyara, M. Rafiqa, and M. Baig, J. Quant. Spec. Rad. Trans. 109, 863 (2008).
- Dinneen et al. (1992) T. P. Dinneen, C. D. Wallace, K.-Y. N. Tan, and P. L. Gould, Op. Lett. 17, 1706 (1992).
- Ridinger et al. (2011) A. Ridinger, S. Chaudhuri, T. Salez, U. Eismann, D. R. Fernandes, K. Magalhães, D. Wilkowski, C. Salomon, and F. Chevy, “Large atom number dual-species magneto-optical trap for fermionic 6Li and 40K atoms,” (2011), arXiv:1103.0637 .
- Modugno et al. (2003) G. Modugno, G. Roati, M. Inguscio, M. Santos, G. Telles, L. Marcass, and V. Bagnato, Euro. Phys. J. D 23, 409 (2003).
- Chanelière et al. (2005) T. Chanelière, J.-L. Meunier, R. Kaiser, C. Miniatura, and D. Wilkowski, J. Opt. Soc. Am. B 22, 1819 (2005).
- Landini et al. (2011) M. Landini, S. Roy, L. Carcagní, D. Trypogeorgos, M. Fattori, M. Inguscio, and G. Modugno, “Sub-doppler laser cooling of potassium atoms,” (2011), arXiv:1107.2337 .
- Bakr et al. (2009) W. S. Bakr, J. I. Gillen, A. Peng, S. Fölling, and M. Greiner, Nature 462, 74 (2009).
- Sherson et al. (2010) J. F. Sherson, C. Weitenberg, M. Endres, M. Cheneau, I. Bloch, and S. Kuhr, Nature 467, 68 (2010).