Anharmonic Phonons and Magnons in BiFeO3
Abstract
The phonon density of states (DOS) and magnetic excitation spectrum of polycrystalline BiFeO3 were measured for temperatures K , using inelastic neutron scattering (INS). Our results indicate that the magnetic spectrum of BiFeO3 closely resembles that of similar Fe perovskites, such as LaFeO3, despite the cycloid modulation in BiFeO3. We do not find any evidence for a spin gap. A strong -dependence of the phonon DOS was found, with a marked broadening of the whole spectrum, providing evidence of strong anharmonicity. This anharmonicity is corroborated by large-amplitude motions of Bi and O ions observed with neutron diffraction. A clear anomaly is seen in the dependence of Bi-dominated modes across the Néel transition. These results highlight the importance of spin-phonon coupling in this material.
pacs:
63.20.kk, 75.30.Ds, 75.85.+t, 78.70.NxI Introduction
Multiferroic materials exhibiting a strong magneto-electric coupling are of great interest for potential applications in spintronic devices and actuator systems Wang-Liu-Ren ; Catalan . BiFeO3 (BFO) is one of the few known systems exhibiting simultaneous magnetic and ferroelectric ordering at K, and as such is a strong candidate for applications Wang-Liu-Ren ; Catalan ; Lebeugle-PRB2007 . BFO crystallizes in a rhombohedrally-distorted perovskite structure (space group ) Kubel ; Palewicz-synchrotron ; Palewicz-neutron ; Sosnowska-review . The Bi lone-pair is thought to be responsible for the off-centering of Bi atoms, which induces the ferroelectricity, with a high Curie temperature K Catalan . The Fe ions, inside oxygen octahedra, carry large magnetic moments Catalan , and order antiferromagnetically (AF) below the Néel temperature, K, with some canting of the spins, and a long-period cycloid modulation Catalan ; Sosnowska ; Ramazanoglu . Unravelling the behavior of phonons and magnons, and their interactions, is crucial to understanding and controlling multiferroic properties Wang-Liu-Ren . Phonons couple to the ferroelectric order, and magnons to the magnetic order, and it is expected that phonons and magnons strongly interact in a system exhibiting simultaneous ferroelectric and antiferromagnetic order, such as BFO Wang-Liu-Ren . This interaction also gives rise to mixing of the excitations, resulting in electromagnons, for example Wang-Liu-Ren ; Catalan . To our knowledge, there are currently no reported experimental data of the full magnon and phonon spectra in BFO, however. Multiple Raman measurements have been performed, but these only probe modes at small wavevectors Haumont-Raman ; Cazayous-Raman ; Rovillain-Raman ; Singh2008-Raman ; Singh2011-Raman ; Shimizu-Raman ; Hlinka-Raman ; Porporati-Raman ; Fukumura-Raman-lowT ; Fukumura-Raman-highT ; Palai-Raman . Here, we report the first INS measurement of the phonon DOS in polycrystalline BiFeO3, as a function of , as well as more detailed measurements of the magnon spectrum than previously reported Loewenhaupt . From these data, we extract the exchange coupling constant of BFO, and we identify a strong anharmonicity of the phonons, providing evidence for strong spin-phonon coupling.
II Neutron Diffraction
A stoichiometric mixture of Bi2O3 (99.99%, Aldrich) and Fe2O3 (99.99%, Aldrich) was ball-milled for 10 hours NIST-waiver . The resulting powder was hot-pressed at C for min in a half-inch diameter graphite die, with a ton force applied, and a heating rate of Cmin. The pressed pellets were annealed in vacuum at K for h. The total sample weight was about g.
| (K) | (%) | () | () | () | () | () | () | () | () | () | |
|---|---|---|---|---|---|---|---|---|---|---|---|
| 300 | 1.285 | 2.0 | 5.5752 | 13.8654 | 0.0977 | 0.0819 | 0.0694 | 0.0722 | 0.1038 | 0.0899 | 0.0698 |
| 473 | 2.306 | 2.0 | 5.5862 | 13.9013 | 0.1291 | 0.1035 | 0.0914 | 0.0919 | 0.1303 | 0.1148 | 0.0956 |
| 573 | 2.151 | 1.9 | 5.5930 | 13.9222 | 0.1455 | 0.1163 | 0.1008 | 0.1014 | 0.1458 | 0.1261 | 0.1058 |
| 623 | 2.099 | 2.0 | 5.5966 | 13.9332 | 0.1527 | 0.1189 | 0.1046 | 0.1088 | 0.1531 | 0.1327 | 0.1094 |
| 723 | 1.714 | 1.7 | 5.6033 | 13.9513 | 0.1645 | 0.1301 | 0.1153 | 0.1170 | 0.1658 | 0.1437 | 0.1189 |
| 773 | 1.749 | 1.7 | 5.6065 | 13.9594 | 0.1718 | 0.1353 | 0.1190 | 0.1225 | 0.1704 | 0.1493 | 0.1264 |
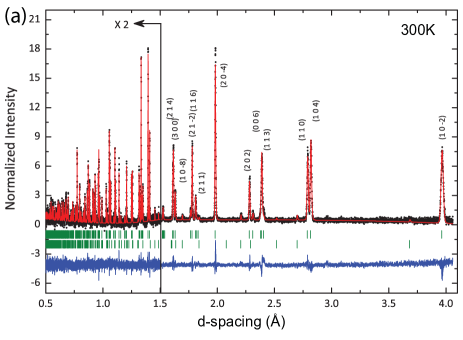

Neutron diffraction measurements were performed using the POWGEN time-of-flight diffractometer at the Spallation Neutron Source (SNS), at Oak Ridge National Laboratory. The sample was placed inside a thin-wall vanadium container, and loaded in a radiative vacuum furnace. Data were collected at K. The time-of-flight diffractometer uses a broad incident spectrum of neutrons, and was configured with a center-wavelength . The diffraction data were refined with GSAS Larson2004 , using the space-group. The fits indicated good crystallinity and good sample purity with 98% BiFeO3 and 2% of a secondary phase, indexed as Fe2O3, at all temperatures. For K, the data were refined with a G-type antiferromagnetic order, without cycloid modulation. Since the inclusion of the G-type AF order did not change the refinements significantly, it is likely that the further incorporation of the cycloid structure would only have a minimal effect on our results. Results are summarized in Table 1. The diffraction data and Rietveld fits for K and K are shown in Fig. 1 (for one of three detector banks). We observe a constant intensity ratio for (104) and (110) reflections at all temperatures measured, and thus our data do not support the – transition reported in Ref. Jeong .
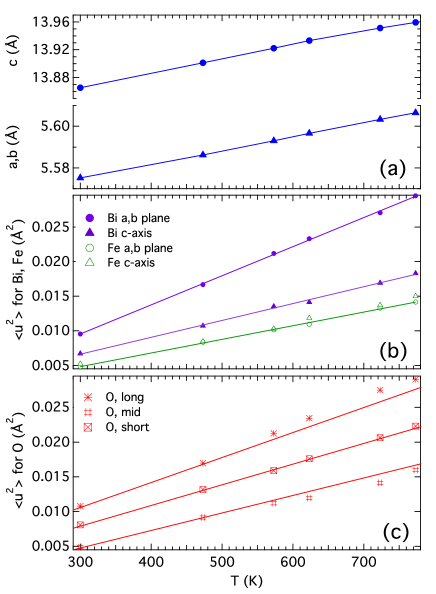
The refined lattice parameters and atomic positions are in good agreement with prior reports Palewicz-synchrotron ; Palewicz-neutron . The temperature dependences of the lattice constants and mean square thermal displacements (squares of quantities in Table 1) are shown in Fig. 2. The mean-square displacements were refined with an anisotropic harmonic model for all atoms, which assumes Gaussian probability distributions for atom positions. The atomic mean-square displacements are largest for Bi, followed by O. Our results for thermal displacements are also in good agreement with Ref. Palewicz-neutron , although we find displacements that are larger for Bi than for Fe, both along the (trigonal) -axis and in the (basal) plane. For Bi and Fe vibration modes, the behavior of is linear in , as expected in the high- regime of an harmonic oscillator (from the theoretical partial phonon DOS reported in Wang-DFT , the average phonon energies for Bi and Fe vibrations are and meV, respectively equivalent to K and K). In this regime, the amplitude of vibrations does not depend on the mass, but only on an effective force-constant, , Willis-Pryor . Linear fits to the Bi and Fe data indicate that the effective for Bi motions in the () plane is about half of the force-constant for Bi motions along , which itself is comparable to those for either types of Fe motions. We note that our fits did not use anharmonic displacement models, which could slightly affect the results. The results for of oxygen atoms in Fig. 2-c shows a departure from linearity around K for the short and long axes of the thermal ellipsoids. This effect may be related to the magnetic transition at K, although there could also be effects of phonon thermal occupations, since the average energy of O vibrations is meV, corresponding to K Wang-DFT .
III Inelastic Neutron Scattering
INS spectra were measured using the ARCS direct-geometry time-of-flight chopper spectrometer at the SNS arcspaper . In the ARCS measurements, the sample was encased in a mm diameter, thin-walled Al can, and mounted inside a low-background furnace for measurements at K. All measurements were performed under high vacuum. An incident neutron energy meV was used and the energy resolution (full width at half max.) was 3 meV at meV neutron energy loss, increasing to 7 meV at the elastic line.
Additional INS measurements were performed with the Disk Chopper Spectrometer (DCS) at the NIST Center for Neutron Research, with incident energy meV, in up-scattering mode (excitation annihilation) dcspaper . In these conditions, the energy resolution was 0.12 meV at the elastic line, increasing to 1.2 meV at 25 meV neutron energy gain. For DCS measurements, the sample was encased in the same Al can as in the ARCS measurements. The empty Al sample container was measured in identical conditions to the sample at all temperatures, and subtracted from the data. DCS measurements at K were performed in a high-temperature He refrigerator, and measurements at K were performed in a radiative furnace.
III.1 Magnetic Spectrum
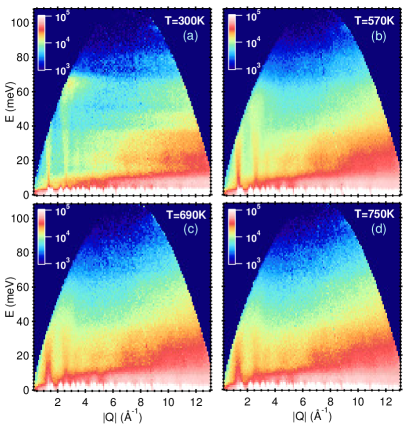
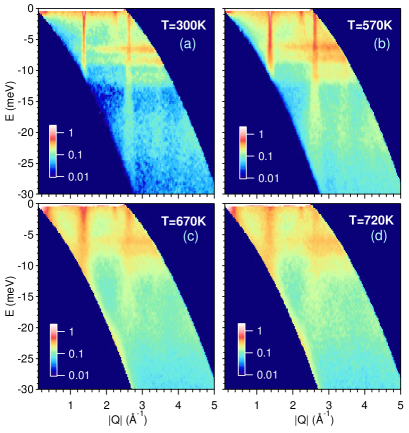
Figure 3 shows the orientation-averaged scattering function, , obtained with ARCS, as a function of temperature ( and are the momentum and energy transfer to the sample, respectively). At K, the data for clearly show steep spin-waves, emanating from strong magnetic Bragg peaks at and , and extending to meV. This range of energies overlaps with much of the phonon spectrum (see below). The intensity of the magnetic Bragg peaks decreases with increasing , vanishing for K, in good agreement with the reported K. The magnetic scattering nearly vanishes for , owing to the magnetic form factor of Fe3+ ions. The high-, optical part of the spin-waves is strongly damped for K, well below . The low- part of the spin-waves is also clearly seen in the DCS data in Fig. 4-a,b, corresponding to sharp vertical streaks emanating from the magnetic Bragg peaks. The acoustic part of the spin-waves shows some -broadening with increasing below . Magnetic correlations remain for , but are much broader (Figs. 3/4-c,d). We note that the orientation-averaged spin-waves show a strong similarity between BiFeO3 and other AFeO3 perovskites, such as ErFeO3, LaFeO3 and YFeO3 shapiro1974 ; McQueeney ; JieMa_phd .
An important question is whether low-energy spin-waves are present in BFO, and whether an energy gap exists, potentially associated with an anisotropy in the exchange coupling, or single-ion anisotropy. Figure 5-b shows the magnetic scattering intensity, , measured with DCS, integrated over the spin-wave dispersing from , and compared to the phonon background on either side. This figure clearly shows that the intensity from the spin-wave persists down to meV, where it merges with the elastic scattering signal. Thus, we can estimate an upper-bound for any magnetic anisotropy gap, meV, if any such gap exists. This is at odds with reports of a gap, meV, derived from modeling the low- specific heat Lu-SpecificHeat .
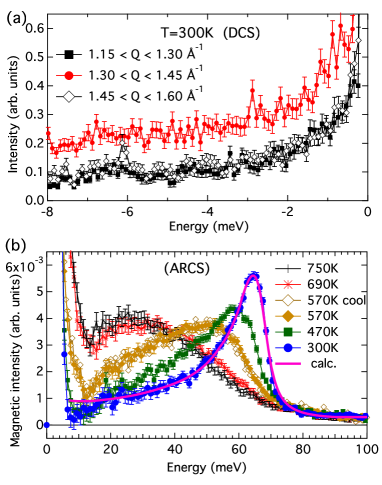
Although the powder average of excitations does not allow us to determine if multiple spin-wave branches exist within the magnon DOS, we can compare our results with recent Raman scattering studies that reported multiple electromagnon modes in BFO between 1.5 and 7.5 meV Rovillain-Raman ; Singh2008-Raman . We do not see these excitations in the powder spectrum at either or K (see Fig. 5-a), although high-resolution INS measurements on single-crystals may be needed to observe such effects. Our results for the magnetic spectrum show a single maximum, around meV at K, see Fig. 5-b. This is at odds with the magnetic spectrum reported in Ref. Loewenhaupt , which showed additional maxima around and meV. However, the extra peaks in Loewenhaupt are likely due to peaks in the phonon DOS at these energies (see below). We use the magnetic DOS to estimate the exchange coupling, with a simple spin-wave model for a collinear Heisenberg G-type antiferromagnet in an undistorted perovskite structure. A similar model successfully described the spin waves in the orthoferrite compounds ErFeO3, TmFeO3 shapiro1974 , as well as LaFeO3 and YFeO3 McQueeney ; JieMa_phd , which have close magnetic structures. This does not capture possible effects from the spiral spin structure in BFO, but these are expected to be limited, owing to the long period of the modulation. Within this model, two exchange constants, and , describe a gapless spin-wave dispersion, with acoustic and optic modes that meet at the magnetic zone boundaries. This behavior can be seen in the large patch of scattering intensity in the ARCS K data near 65 meV (Fig. 3-a). The [] exchange constant corresponds to coupled moments with spin-spin distances of 3.968[5.613] Å. Assuming Fe3+ moments, and comparing the maximum energy of the measured and model spin-wave spectra, we are able to place limits on the values of and . We find that and where there is a linear dependence on these parameters within these bounds . The calculated magnetic DOS for and meV agrees well with the phonon subtracted K data shown in Fig. 5-b.
There is a clear softening and broadening of the spin-wave spectrum with increasing temperature from K to K. Magnon-magnon and magnon-phonon interactions are likely both responsible for this softening Singh2008-Raman ; lovesey_vol2 . It is possible that the strong softening of in this range is related to the an anomalous magnetization below Lu-SpecificHeat . Above , we observe Lorentzian scattering intensity centered at meV, typical of paramagnetic behavior (the dip below meV is a result of imperfect phonon subtraction).
III.2 Phonons
In both Figs. 3 and 4, the horizontal bands of intensity increasing as are orientation-averaged phonon dispersions. In the DCS data, three main horizontal bands are clearly observed at meV, corresponding to the top of acoustic phonon branches and low- optical branches, which mainly involve Bi vibrations (see below). The acoustic branches are seen dispersing out of a nuclear Bragg peak at . The phonon cutoff corresponding to the top of oxygen-dominated optic branches is seen at meV in Fig. 3-a. A strong broadening of the phonon modes with increasing temperature can be seen in both Figs. 3 and 4. This broadening indicates a strong damping of phonons, over the full spectrum. The range over which this occurs is in agreement with prior Raman measurements Singh2011-Raman , and points to a spin-phonon coupling effect.
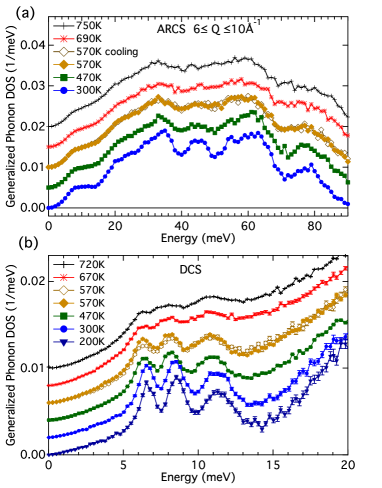
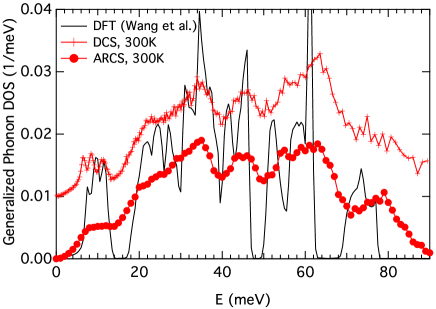
The data were analyzed to extract the generalized phonon DOS, , in the incoherent scattering approximation. The data from ARCS were integrated over , which minimizes any contribution from magnetic scattering, and the elastic peak was subtracted, and extrapolated with a quadratic dependence for meV. A correction for multiphonon scattering was performed at all DANSE-ref ; Kresch-Ni . The gDOS from the DCS data was obtained by integrating over the full range of (no multiphonon correction) dave . The measured signal from the empty container was much weaker than from the sample, and was easily subtracted. The results are shown in Fig. 6(a) for the full gDOS (ARCS) and panel (b) for meV (DCS). Although the DCS data include a magnetic contribution, this effect is limited, and the DOSs form ARCS and DCS are in excellent agreement, considering the difference in instrument resolution (see Fig. 7). The coarser energy resolution in ARCS data washes out the three Bi-dominated peaks at meV, but the two DOS curves are otherwise very similar. In BFO, the different elements have different ratios of cross-section over mass, , resulting in a weighted phonon DOS (gDOS). The values of for (Bi, Fe, O) are (0.044, 0.208, 0.265), in units of barns/amu, respectively. Thus, the modes involving primarily Bi motions are under-emphasized in and (but there is relatively little weighting of Fe modes compared to O modes).
While the energy-range of the spectrum is comparable with other Fe perovskites JieMa_phd , what is striking is the severe broadening of the spectrum with increasing . The gDOS measured at K is in good agreement overall with the first-principles calculation of Wang et al. within spin-polarized DFT+U Wang-DFT , as can be seen in Fig. 7. This agreement allows for a clear identification of the main features in the DOS. The three peaks at meV (Fig. 6(b)) arise from the top of acoustic branches and the lowest- optic modes, and they are dominated by Bi motions. The lower two Bi peaks (meV and meV) are softer than predicted by DFT by about 10% Wang-DFT . These Bi modes are responsible for the peak in around K reported in Ref. Lu-SpecificHeat . The phonon spectrum for meV is mainly comprised of oxygen vibrations, and is stiffer in the measured DOS than in the DFT calculation Wang-DFT . While the agreement is generally good between the DFT calculation of Wang et al. and the phonon DOS measured at low temperature, the dependence of the DOS is strongly affected by anharmonicity and spin-phonon coupling, as we discuss in the next section.
IV Discussion
As already pointed out above, the phonon DOS exhibits a severe broadening with increasing , which affects the whole spectrum. In particular, the broadening of Bi modes at low- is obvious in the DCS data, shown in Fig. 6-b. It is particularly strong between K and K, with little additional broadening observed further above . This indicates a coupling between anharmonicity and the loss of the AF order. These results are consistent with the reported observations of strong broadening of Raman phonon modes Singh2011-Raman . The oxygen modes, dominating the DOS between meV and meV, are also strongly broadened in this -range.
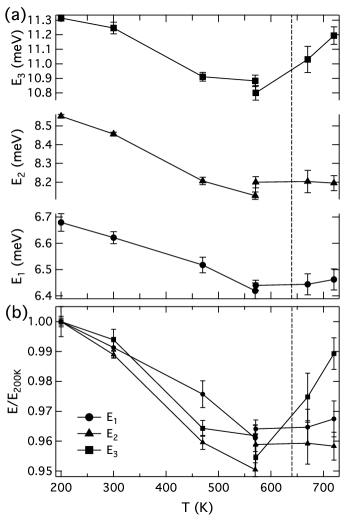
We now analyze in more detail the temperature dependence of the three peaks at , , meV (resp. , , ). The peaks were fitted with Gaussians, and the resulting peak centers are plotted as a function of temperature in Fig. 8. As may be seen on this figure, all three peaks undergo a pronounced but gradual softening between K and K, besides the strong broadening. However, this softening stops around . This is compatible with the recently reported behavior of Raman modes Singh2011-Raman . actually appears to stiffen above , but this may partly be due to the influence of broadening and softening of modes at meV, causing a skewed contribution to the peak.
The change in phonon softening behavior around is further evidence of the influence of spin-phonon coupling. The softening of phonon modes with increasing , as observed here for K, can generally be related to the thermal expansion of the system through the quasiharmonic approximation , with the Grüneisen parameter Grimvall-TPM99 . We determined the relative change in volume to be about 1.4% between K and K from our diffraction measurements (this was linearly extrapolated over the range K, since our diffraction data were limited to K). The average relative decrease of , , and is % over the same range, yielding a Grüneisen parameter . Such a large value of is a further corroboration of the anharmonicity of these Bi-dominated modes. The lack of softening above K indicates that an increase in interatomic force-constants associated with the loss of magnetic order compensates for the effect of thermal expansion.
We note that Bi and O atoms undergo large amplitude vibrations, according to both our measurements and reports of others Palewicz-neutron ; Palewicz-synchrotron . Since the Bi and O modes are sharp at K, the large displacements observed in diffraction data are dynamic in nature, rather than associated with static disorder. These large amplitudes of vibration for Bi and O are related to the anharmonic scattering of phonons, which leads to the broadening and softening of features in the DOS. We have also performed measurements of the Fe-partial phonon DOS with nuclear-resonant inelastic x-ray scattering (NRIXS) on 57Fe-enriched samples, and observed a more limited broadening of Fe modes, in agreement with the smaller thermal displacements of these atoms Delaire-BFO-NRIXS .
We suggest that the large thermal displacements and anharmonicity of Bi and O modes lead to structural fluctuations, such as variations in Fe-O-Fe bond lengths and bond angles (tuning the superexchange interaction) through tilts and rotations of FeO6 octahedra, that could lead to fluctuations in magnetic coupling. The magnitude of O thermal motions perpendicular to Fe-O bonds actually leads to fluctuations in the Fe-O-Fe bond angle that are larger () than the variation of average angle with . Reciprocally, the loss of magnetic order induces a change in interatomic force-constants, stiffening the Bi vibration modes at low . The motion of Bi atoms is also directly related to the ferroelectricity. The large-amplitude structural fluctuations could thus lead to steric effects between Bi motions and the rotations of oxygen octahedra, yielding a complex coupling between ferroelectric and AF magnetic orders.
V Summary
We have systematically investigated the temperature dependence of the magnetic excitation spectrum and phonon density of states of BiFeO3 over the range , using inelastic neutron scattering. In addition, we performed neutron diffraction measurements and refined the lattice parameters and thermal displacement parameters over . We separated the magnon and phonon contributions in the data, and observed a strong resemblance of the magnon spectrum with that of related compounds LaFeO3 and YFeO3. The magnon spectrum was fit satisfactorily with a simple collinear Heisenberg model for a G-type antiferromagnet, indicating the limited role of the cycloid on the spin dynamics, as expected from the long period of the cycloid modulation. The phonon DOS obtained from the high- part of the data is in good agreement at low temperatures with the first-principles calculation of Wang et al. Wang-DFT . However, the phonon DOS shows a strong temperature dependence, with in particular a pronounced broadening. Also, both the softening and broadening of features in the DOS correlate with the loss of antiferromagnetic order around K, indicating the presence of significant spin-phonon coupling, in agreement with recently reported Raman measurements Singh2011-Raman . The potential influence of large atomic displacements on the modulation of the superexchange interaction, and the concomitant effect of the change in force-constants from the loss of magnetic order were pointed out.
VI Acknowledgements
The Research at Oak Ridge National Laboratory’s Spallation Neutron Source was sponsored by the Scientific User Facilities Division, Office of Basic Energy Sciences, US DOE. This work utilized facilities supported in part by the National Science Foundation under Agreement No. DMR-0944772. The work performed at Boston College is funded by the US Department of Energy under contract number DOE DE-FG02-00ER45805 (ZFR).
References
- (1) K.F. Wang, J.-M. Liu, and Z.F. Ren, Adv. Phys. 58, 321 (2009).
- (2) G. Catalan and J. F. Scott, Adv. Mater. 21, 2463 (2009).
- (3) D. Lebeugle, D. Colson, A. Forget, M. Viret, P. Bonville, J. F. Marucco, and S. Fusil, Phys. Rev. B 76, 024116 (2007).
- (4) F. Kubel and H. Schmid, Acta Cryst. B46, 698 (1990).
- (5) A. Palewicz, T. Szumiata, R. Przenioslo, I. Sosnowska, I. Margiolaki, Solid State Commun. 140, 359–363 (2006).
- (6) A. Palewicz, R. Przenioslo, I. Sosnowska, and A. W. Hewat, Acta Cryst. B63, 537 (2007).
- (7) I.M. Sosnowska, J. Microsc. 236, 109 (2009).
- (8) I Sosnowska, T P Neumaier and E Steichele, J. Phys. C: Solid State Phys. 15, 4835 (1982).
- (9) M. Ramazanoglu, W. Ratcliff II, Y. J. Choi, Seongsu Lee, S.-W. Cheong, and V. Kiryukhin, Phys. Rev. B 83, 174434 (2011).
- (10) R. Haumont, J. Kreisel, P. Bouvier, and F. Hippert, Phys. Rev. B 73, 132101 (2006).
- (11) M. Cazayous, Y. Gallais, A. Sacuto, R. de Sousa, D. Lebeugle and D. Colson, Phys. Rev. Lett. 101, 037601 (2008).
- (12) P. Rovillain, M. Cazayous, Y. Gallais, A. Sacuto, R. P. S. M. Lobo, D. Lebeugle and D. Colson, Phys. Rev. B 79, 180411(R) (2009).
- (13) M. K. Singh, R. S. Katiyar, and J. F. Scott, J. Phys.:Condens. Matter 20, 252203 (2008).
- (14) M. K. Singh and R. S. Katiyar, J. Appl. Phys. 109, 07D916 (2011).
- (15) T. Shimizu, T. Era, H. Taniguchi, D. Fu, T. Taniyama, and M. Itoh, Ferroelectrics 403, 187-190 (2010).
- (16) J. Hlinka, J. Pokorny, S. Karimi, and I. M. Reaney, Phys. Rev. B 83, 020101(R) (2011).
- (17) A.A. Porporati, K. Tsuji, M. Valant, A.-K. Axelssond and G. Pezzottia, J. Raman Spectrosc. 41, 84–87 (2010).
- (18) H. Fukumura, S. Matsui, H. Harima, T. Takahashi, T. Itoh, K. Kisoda, M. Tamada, Y. Noguchi and M. Miyayama, J. Phys.: Condens. Matter 19, 365224 (2007).
- (19) H. Fukumura, H. Harima, K. Kisoda, M. Tamada, Y. Noguchi, M. Miyayama, J. Magn. Magn. Mater. 310, e367 (2007).
- (20) R. Palai, J. F. Scott, and R. S. Katiyar, Phys. Rev. B 81, 024115 (2010).
- (21) M. Loewenhaupt, Physica B 163, 479 (1990).
- (22) Identification of commercial equipment or products in the text is not intended to imply any recommendation or endorsement by the National Institute of Standards and Technology.
- (23) A. C. Larson and R. B. VonDreele, Los Alamos National Laboratory Report LAUR 86-748 (2004).
- (24) B.T.M. Willis and A.W. Pryor, “Thermal Vibrations in Crystallography”, (Cambridge University Press, Cambridge, 1975).
- (25) Y.K. Jeong, C.W. Bark, S. Ryu, J.-H. Lee and H. M. Jang, J. Korean Phys. Soc. 58, 817-820 (2011).
- (26) D. L. Abernathy, M. B. Stone, M. J. Loguillo, M. S. Lucas, O. Delaire, X. Tang, J. Y. Y. Lin, and B. Fultz, Rev. Sci. Inst. (in review) (2011).
- (27) J.R.D. Copley and J.C. Cook, Chem. Phys. 292, 477 (2003).
- (28) S. M. Shapiro, J. D. Axe and J. P. Remeika, Phys. Rev. B 10, 2014, (1974).
- (29) R.J. McQueeney, J.-Q. Yan, S. Chang, and J. Ma, Phys. Rev. B 78, 184417 (2008).
- (30) J. Ma, Ph.D. thesis, Iowa State University (2010).
- (31) J. Lu, A. Günther, F. Schrettle, F. Mayr, S. Krohns, P. Lunkenheimer, A. Pimenov, V.D. Travkin, A.A. Mukhin, and A. Loidl, Eur. Phys. J. B 75, 451–460 (2010).
- (32) S. W. Lovesey, Theory of Neutron Scattering from Condensed Matter: Volume 2 (Clarendon Press, Oxford, UK 1987).
- (33) DANSE software project. http://danse.us
- (34) M.G. Kresch, O. Delaire, R. Stevens, J.Y.Y. Lin and B. Fultz, Phys. Rev. B, 75, 104301 (2007).
- (35) R.T. Azuah, L.R. Kneller, Y. Qiu, P.L.W. Tregenna-Piggott, C.M. Brown, J.R.D. Copley, and R.M. Dimeo, J. Res. Natl. Inst. Stan. Technol. 114, 341 (2009).
- (36) Y. Wang, J.E. Saal, P. Wu, J. Wang, S. Shang, Z.-K. Liu, L.-Q. Chen, Acta Materialia 59, 4229–4234 (2011).
- (37) G. Grimvall, Thermophysical Properties of Materials (North Holland, Amsterdam, 1999).
- (38) O. Delaire et al., to be published.