CANDELS OBSERVATIONS OF THE STRUCTURAL PROPERTIES OF CLUSTER GALAXIES AT =1.62
Abstract
We discuss the structural and morphological properties of galaxies in a proto-cluster using near–IR imaging data from Hubble Space Telescope Wide Field Camera 3 data of the Cosmic Assembly Near-IR Deep Extragalactic Legacy Survey (CANDELS). The cluster galaxies exhibit a clear color–morphology relation: galaxies with colors of quiescent stellar populations generally have morphologies consistent with spheroids, and galaxies with colors consistent with ongoing star formation have disk–like and irregular morphologies. The size distribution of the quiescent cluster galaxies shows a deficit of compact ( kpc), massive galaxies compared to CANDELS field galaxies at . As a result the cluster quiescent galaxies have larger average effective sizes compared to field galaxies at fixed mass at greater than 90% significance. Combined with data from the literature, the size evolution of quiescent cluster galaxies is relatively slow from to the present, growing as . If this result is generalizable, then it implies that physical processes associated with the denser cluster region seems to have caused accelerated size growth in quiescent galaxies prior to and slower subsequent growth at compared to galaxies in the lower density field. The quiescent cluster galaxies at have higher ellipticities compared to lower redshift samples at fixed mass, and their surface-brightness profiles suggest that they contain extended stellar disks. We argue the cluster galaxies require dissipationless (i.e., gas–poor or “dry”) mergers to reorganize the disk material and to match the relations for ellipticity, stellar mass, size, and color of early-type galaxies in clusters.
Subject headings:
galaxies: clusters: general — galaxies: clusters: individual (XMM-LSS 02182-05102) — galaxies: evolution — galaxies: elliptical and lenticular, cD — galaxies: high-redshift — galaxies: structure1. INTRODUCTION
Massive elliptical and early–type galaxies dominate regions of high density such as those of galaxy clusters in the present Universe (e.g., Dressler 1980; Postman & Geller 1984). By , Hubble Space Telescope (HST) observations show that these passive cluster galaxies have elliptical and lenticular morphologies, with a strong color-density relationship (e.g., van Dokkum & Franx 2001; Blakeslee et al. 2003; Postman et al. 2005; Mei et al. 2006; Blakeslee et al. 2006; Hilton et al. 2009). The emerging picture for formation and evolution of the massive, red, early-type cluster galaxies is one in which these galaxies formed their stars at , with subsequent passive evolution (e.g., Stanford et al. 1998; Eisenhardt et al. 2008; Whiley et al. 2008). These galaxies continue to grow by mergers and secular processes, with negligible additional star-formation in order for their color evolution to be consistent with observations.
The details of this evolution is unclear, yet these cluster galaxies must assemble sometime. It may be that the formation of cluster galaxies is related to the cluster assembly process itself (e.g., Dubinski 1998). Observations show that the intracluster galaxy velocity dispersion is lower in forming clusters and groups, and therefore galaxy–galaxy interactions are more frequent (see, van Dokkum et al. 1999; Lidman et al. 2008; McIntosh et al. 2008; Tran et al. 2008; McGee et al. 2009; Wilman et al. 2009). Therefore, one may expect strong morphological evolution as a result of increased mergers, which lead to a population of spherical, elliptical galaxies (Navarro 1990). Out to , ellipticals dominate the galaxy populations of massive clusters (Desai et al. 2007; Holden et al. 2009; Vulcani et al. 2011), while lenticular and early-type spiral galaxies dominate the cores of some lower density groups (Wilman et al. 2009; Just et al. 2010). If lower mass groups are common precursors to galaxy clusters, then their galaxies must undergo morphological evolution to early-type galaxies as the groups merge to form larger clusters. This is expected based on some semianalytic models, which predict that processes associated with the cluster formation are expected to influence galaxy evolution at (Dubinski 1998; Lin & Mohr 2004; De Lucia et al. 2007; Ruszkowski & Springel 2009) where the main progenitors of clusters collapse (e.g., Boylan-Kolchin et al. 2009). Therefore, if this hypothesis is correct, then as we encroach on the formation epochs of today’s massive clusters, , we should expect to see rapid evolution in the properties of the cluster galaxies.
In addition, observations show quiescent galaxies (not only those in clusters), with apparent early-type morphologies, undergo strong size evolution with redshift out to (e.g., Daddi et al. 2005; Papovich et al. 2005; Trujillo et al. 2006, 2007; Longhetti et al. 2007; Zirm et al. 2007; Toft et al. 2007; Buitrago et al. 2008; Cimatti et al. 2008; van der Wel et al. 2008; van Dokkum et al. 2008; Damjanov et al. 2009; Cassata et al. 2010; Saracco et al. 2010). One explanation for this size evolution is that these galaxies grow by frequent dissipationless (i.e., gas–poor or “dry”) minor mergers (e.g., Loeb & Peebles 2003; van Dokkum 2005; Bell et al. 2006; Naab et al. 2006a, b, 2007; Khochfar & Silk 2006a, b; Lotz et al. 2008; Masjedi et al. 2008; Hopkins et al. 2009b, 2010; van der Wel et al. 2009a, 2011) Minor mergers would cause the galaxies to add mass at larger radii, increasing their effective sizes substantially with a relatively small increase in stellar mass (Oser et al. 2010). Some recent observations support this interpretation (Bezanson et al. 2009; Hopkins et al. 2009a; van Dokkum et al. 2010), although this explanation would not explain the substantially larger central densities of high–redshift ellipticals compared to galaxies at lower redshift (see e.g., Stockton et al. 2010). Alternatively, Graham (2011) notes that many of these compact objects share sizes, masses, and mass densities of present-day bulges, suggesting some of these objects are the precursors to the spheroidal components of present-day disk galaxies.
It is unclear how the assembly of ellipticals in high density cluster (and forming cluster) regions differs from that in the lower density the field. If the size growth of ellipticals is driven by minor mergers and galaxies experience more mergers in forming clusters, then it follows that the size and morphological evolution of cluster ellipticals should be accelerated during the cluster formation stage. Stott et al. (2011) report that the sizes of the most massive galaxies in clusters increase by at most 30% during the period of to 0.2. Cooper et al. (2011) find a correlation between the sizes and local galaxy overdensity for early-type galaxies at , suggesting accelerated morphological evolution in regions in higher density. Zirm et al. (2011) find a hint of evidence that massive quiescent galaxies in the vicinity radio galaxy MRC 1138262 at have larger sizes at fixed mass compared to galaxies in the field at this redshift. These observations support the hypothesis that cluster ellipticals experience accelerated structural evolution. However, other observations at higher redshift () find no evidence that the sizes or morphologies of galaxies differ in high–density regions compared to those of low–density regions (e.g. Peter et al. 2007; Overzier et al. 2008), suggesting that any environmental effects are not yet present at these epochs.
Here, we compare the properties of galaxies in the high density region of a forming cluster at , XMM–LSS J02182-05102 (Papovich et al. 2010; Tanaka et al. 2010), and we compare them to similarly selected galaxies in the lower density field. This galaxy cluster was identified as an overdensity of sources with Spitzer/IRAC colors indicative of high–redshift galaxies (Papovich 2008). The cluster shows a dominant population of red galaxies, which form a strong “red sequence” population, with an estimate of the last major star–formation epoch of (Papovich et al. 2010). In addition, this cluster shows a significant fraction of star–forming galaxies as evidenced by their Spitzer/24 µm emission (Tran et al. 2010). There are currently 13 redshifts for galaxies with within a physical projected radius on the sky of 1 Mpc of the cluster center (10 of these galaxies have ; Papovich et al. 2010, Tanaka et al. 2010, I. Momcheva et al., in prep, C. N. A. Willmer et al., in prep). These redshifts provide an estimate of the velocity dispersion and total cluster mass assuming the cluster is virialized, km s-1 and , although there is evidence to suggest the assumption of virialization is unlikely (see Papovich et al. 2010; Pierre et al. 2011), which is entirely consistent with the expected assembly histories of a present-day massive cluster observed at (e.g., Boylan-Kolchin et al. 2009). While the reported velocity dispersion was consistent with the weak () XMM X–ray detection (Papovich et al. 2010), recent Chandra data show that several point sources dominate the X-ray emission with very faint extended emission, supporting the interpretation that this cluster is in the act of collapsing (Pierre et al. 2011).
In terms of semantics, throughout this paper we refer to XMM–LSS J02182-05102 as a “cluster” even though it is unlikely to fully satisfy the classical definition of a virialized object. The distinction “proto-cluster” or “forming cluster” is strictly more apt as it seems likely that this structure is in the process of collapse and assembly. Regardless, because this object corresponds to a clear high surface density of galaxies at (20 as defined by Papovich et al. 2010), we have the ability to compare and contrast the morphological evolution of galaxies in a high density region compared to that in the lower density field.
The outline for this paper is the following. In § 2 we describe the properties of the imaging datasets and we describe our analysis. In § 3 we discuss the color–morphology relation in this cluster. In § 4, we discuss the size–mass relation for quiescent galaxies associated with the cluster and compare it to a similarly-selected sample in the field. In § 5 we discuss the distributions of ellipticities and surface–brightness profiles for the quiescent galaxies in both the cluster and field. In § 6 we consider possible evolutionary scenarios for the quiescent galaxy population, and we discuss how environmental processes affect the galaxies’ evolution. In § 7 we summarize our conclusions. Throughout this paper we report magnitudes measured relative to the AB system (Oke & Gunn 1983). We denote photometric magnitudes measured in the WFC3 F125W and F160W passbands as and , respectively. Throughout we assume a cosmology with , , and km s-1 Mpc-1.
2. Data and Analysis
The cluster XMM–LSS J02182-05102 is located in the UKIRT IR Deep Sky Survey (UKIDSS; Lawrence et al. 2007) Ultradeep survey (UDS). This cluster received partial HST/WFC3 imaging in the F110W and F160W bands as part of the Cosmic Assembly Near–IR Deep Extragalactic Legacy Survey (CANDELS) program (PIs: S. Faber, H. Ferguson)111http://candels.ucolick.org/. The CANDELS strategy, data acquisition, and data reduction are described fully in Grogin et al. (2011) and Koekemoer et al. (2011). The CANDELS imaging achieves limiting magnitudes of mag ( for apertures of 04 diameter). Owing to the CANDELS field placement, the HST/WFC3 imaging covers slightly more than 50% of the galaxies associated with the cluster (see below), including 6 galaxies with spectroscopic redshifts within a physical projected radius of 1 Mpc of the cluster center. The CANDELS imaging does cover most of the cluster core including its most massive, quiescent galaxies.
In addition to the HST imaging, this field has deep imaging from the Subaru–XMM Deep Survey (SXDF; Furusawa et al. 2008), imaging from UKIDSS (e.g., Williams et al. 2009), Spitzer IRAC data in four bands probing to µm, and MIPS data at 24 µm.222http://irsa.ipac.caltech.edu/data/SPITZER/SpUDS
2.1. Merged Catalogs, Photometric Redshifts, and Sample Selection
As in Papovich et al. (2010), we used the –band selected, SXDF and UDS catalogs from Williams et al. (2009) and merged these with the Spitzer/IRAC data. Following Papovich et al., we used the muliwavelength photometry to derive photometric redshift probability distribution functions, , for each source using EAZY (Brammer et al. 2008). Here we considered a sample with mag, which is an approximate limit for the UKIDSS data. As in Papovich et al. (2010), we define a likelihood that galaxies are associated with the cluster redshift,
| (1) |
integrated over the redshift range given by with and , approximately the 68% confidence range on the photometric redshifts for the red, quiescent galaxies.
We consider all galaxies with and projected distances Mpc to be associated with the cluster. Galaxies with well–established spectral features, such as the 4000Å/Balmer break, have sharp and thus higher , which includes red galaxies with lower implied specific star–formation rates. Galaxies that are actively star–forming have weaker 4000Å/Balmer breaks, have more broad , and have lower . Therefore, choosing ensures that we do not bias ourselves away from the (bluer) star-forming objects (see discussion in Papovich et al. 2010).
However, in the sections § 4 and 5, we focus on the properties of a sample of quiescent galaxies in the cluster to those in the field. For this sample of quiescent galaxies we increase our selection criterion to . We do this because the quiescent galaxies have tighter functions, and will have higher . Our tests have shown that a criterion provides a cleaner sample as the samples would otherwise include galaxies with more than 50% of their outside the desired redshift range. From this subsample we define quiescent galaxies associated with the cluster as those with Mpc, and those in the field as Mpc.
Table 1 lists the properties of the objects in the CANDELS cluster and field samples including the astrometric coordinates, magnitudes, colors, and photometric redshift information. The table includes all galaxies at satisfying as defined above.
2.2. Stellar Masses
We fitted the 10–band galaxy photometry covering 0.4–8 µm with model spectral energy distributions to estimate the stellar masses for the galaxies in the sample using the method of Papovich et al. (2001). We used models for a range of stellar population properties from the Bruzual & Charlot (2003) stellar population synthesis models allowing for a range of extinction using the Calzetti et al. (2000) law. We opt to use the 2003 version of the Bruzual & Charlot models to facilitate the comparison to other studies, including Shen et al. (2003). Our tests showed that using the 2007 updated version of the Bruzual & Charlot models yields stellar masses systematically lower by a 0.2-0.3 dex, but this does not affect our conclusions. We assumed models with solar metallicity and a Chabrier initial mass function (IMF; using a Salpeter IMF would to first order increase systematically the stellar masses by 0.27 dex). Given that most of the galaxies associated with the cluster are quite massive (Tran et al. 2010), the solar–metallicity assumption is reasonable (see, e.g., van Dokkum et al. 2004). Using different assumptions for the stellar population metallicities will affect the derived stellar masses by 0.2 dex (Papovich et al. 2001; Marchesini et al. 2009). We generate a multi-parameter probability distribution function for each galaxy from this modeling. We then compute the mean and 68% confidence region on the stellar mass for each galaxy by marginalizing over the other model parameters (see discussion in Papovich et al. 2006). Our analysis of the spectral energy distributions of galaxies provides an estimate of the instantaneous SFR, which we measure as the SFR averaged over the prior 100 Myr using the best-fit stellar-population model. Table 1 lists the derived stellar masses and SFRs for each object in the sample.
2.3. Galaxy Morphologies and Sizes
We used GALFIT (Peng et al. 2002) to fit models to galaxies in the CANDELS WFC3 F125W imaging, from which we determined effective radii, , and Sérsic indices, . The models assume the surface brightness of the galaxies is proportional to (Sérsic 1968), where is the angular radius from the galaxy center and where the Sérsic index is a concentration parameter. An exponential disk has , and a de Vaucouleurs (1948) profile has . GALFIT convolves the models by the image PSF before fitting them to the data. We generated model PSFs for each dither position and orientation for the two WFC3 imaging epochs using TinyTim v7.2 (Krist 1995). The PSF models were dithered and combined in the same way as the CANDELS data.
We fitted each galaxy with GALFIT, keeping the position, background, orientation, effective semimajor axis, Sérsic index, and ellipticity as free parameters. We used the WFC3 F125W image for this analysis as this bandpass corresponds approximately to the rest–frame -band at , facilitating the comparison to other datasets. Our tests show that none of our conclusions would be strongly affected if we instead used the WFC3 F160W image. During the analysis we required because higher values of usually do not improve the fit, and the covariance between and the effective radius leads to an overestimate of for larger . Only three objects in our samples had best fits with , and we refit those objects forcing . In what follows, we analyze the galaxies’ ellipticities, defined as , where is the ratio of the semiminor to semimajor axes calculated by GALFIT. Table 1 lists the GALFIT measurements for all objects in the samples.
The effective sizes we report in this paper are the circularized effective radii, , where is the effective semimajor axis measured by GALFIT and other values are as above. The circularized effective radius is smaller than the effective semimajor axis, but it is commonly used in the literature, and we use it here for comparison. The effective semimajor axes can be computed using the information in Table 1. Furthermore, we have checked that the circularized effective radii from GALFIT are in good agreement with independent, non-parametric measurements of the galaxy half–light radii computed following the methods in Lotz et al. (2008).
We performed a series of simulations to estimate the errors in the GALFIT parameters. We inserted model galaxies of known effective radius, Sérsic index, and magnitude into the WFC3 F125W data, and we recovered their parameters using GALFIT as described above. As with other studies (e.g., Häussler et al. 2007), we find that the errors in effective radius and Sérsic index are correlated strongly, with larger uncertainties on effective radius for objects with larger Sérsic indices. Quantitatively, our simulations show that the measured effective radii are accurate to better than 40% for simulated compact objects (measured and arcsec) with magnitudes typical of the faintest objects in our samples, =23 mag. Similarly, the measured Sérsic indices are accurate to better than 20% for these objects. The uncertainties are substantially lower for brighter and less compact () objects (similar to the findings of Häussler et al. 2007). In practice, the errors on the Sérsic index have no substantive impact on our conclusions.
3. The Color–Morphology Relation in a Cluster
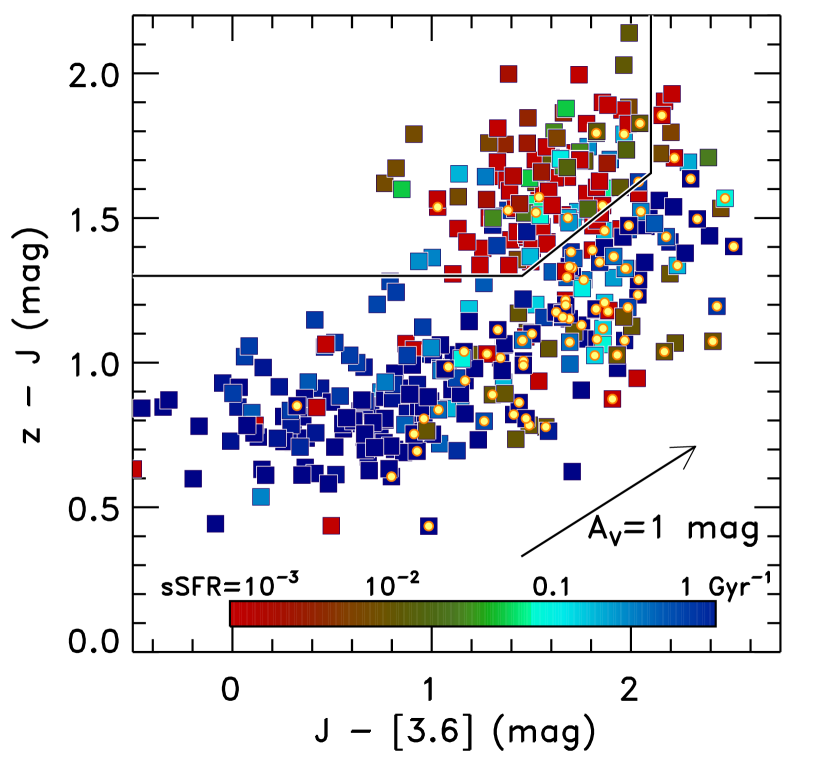
We select quiescent galaxies using a and color–color selection. At these colors correspond approximately to rest-frame versus at , which Williams et al. (2009) showed effectively separates quiescent galaxies from star-forming galaxies (see also Wuyts et al. 2009; Patel et al. 2011; Quadri et al. 2011). Figure 1 shows the versus diagram for all galaxies in the CANDELS UDS field with with . The symbol colors denote the specific SFR (sSFR: the SFR per unit stellar mass). Star–forming galaxies form a sequence below the quiescent galaxies where the slope of the sequence roughly follows the expected change in color associated with dust extinction.
Quiescent galaxies lie in the upper left region of figure 1, as indicated by the polygon defined by
| (2) | |||||
We define samples of quiescent galaxies as satisfying all the color criteria of equation 3. Based on the analysis of the galaxies’ spectral energy distributions (§ 2.2), galaxies selected using the color selection above in the CANDELS sample have low specific SFRs. We find that 69/78 (88%) of the quiescent galaxies have specific SFRs Gyr (including all but one of the quiescent galaxies associated with the cluster). Therefore, the quiescent galaxies selected by the color selection above have spectral energy distributions indicative of highly “suppressed” SFRs (Kriek et al. 2006). The MIPS 24 µm data give an independent measure of star formation or the presence of an AGN. Few of the quiescent galaxies are detected at 24 µm: only 3 out of 24 cluster galaxies and 6 out of 72 field galaxies have Jy. We do not reject these sources from the quiescent sample because the source of the 24 µm emission in these galaxies is uncertain. However, given the small number of 24 µm sources, our tests show that none of our conclusions would change if we did remove these sources.
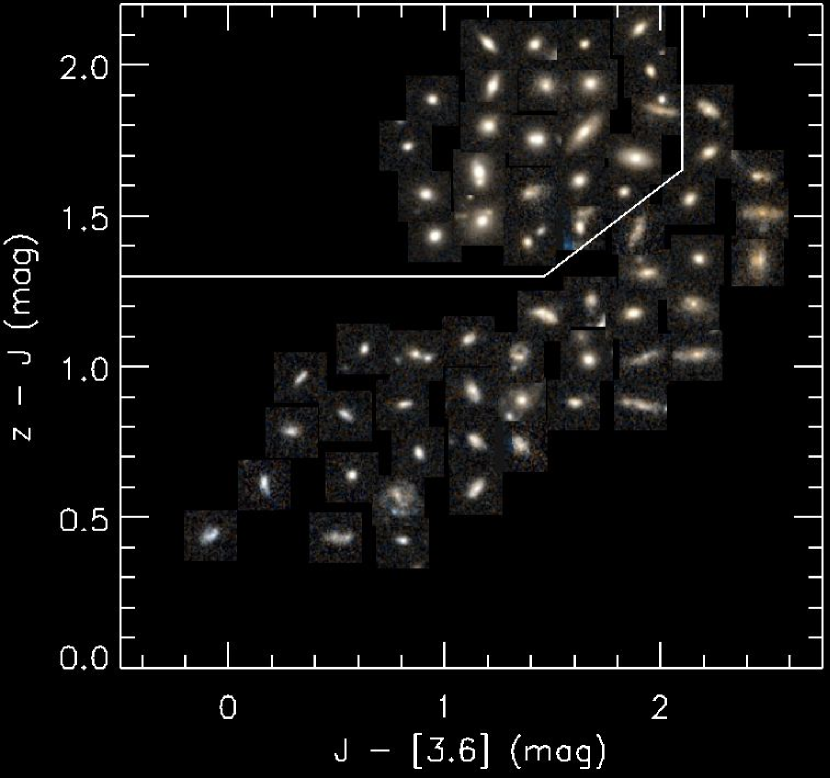
The galaxies associated with the cluster exhibit a clear color–morphology relation. Figure 2 shows the HST WFC3 (F125 and F160W) color images for the cluster galaxies with and projected distances Mpc from the cluster center. Spheroids dominate the morphologies of the cluster galaxies with colors of quiescent stellar populations defined by equation 3. In most cases these galaxies are highly symmetric with elliptical and lenticular morphologies and a range of sizes. Galaxies with colors consistent with ongoing star formation have disk–like and irregular morphologies. In several cases galaxies in the star–forming region show evidence for multiple components, including apparent bulge and disk morphologies. This is especially visible in the star–forming galaxies with redder colors, and these galaxies appear to have large effective sizes compared to the bluer star–forming galaxies.
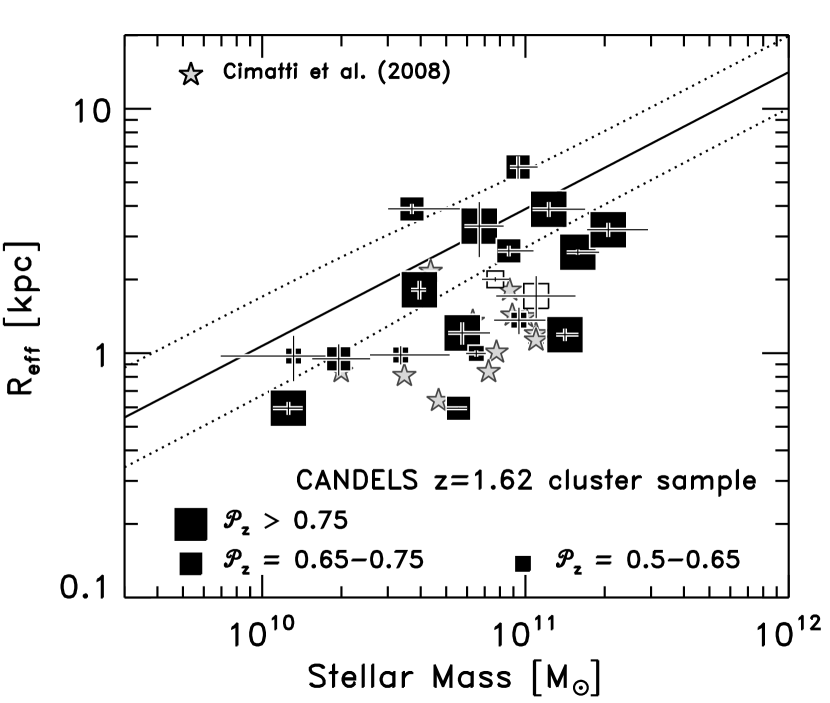
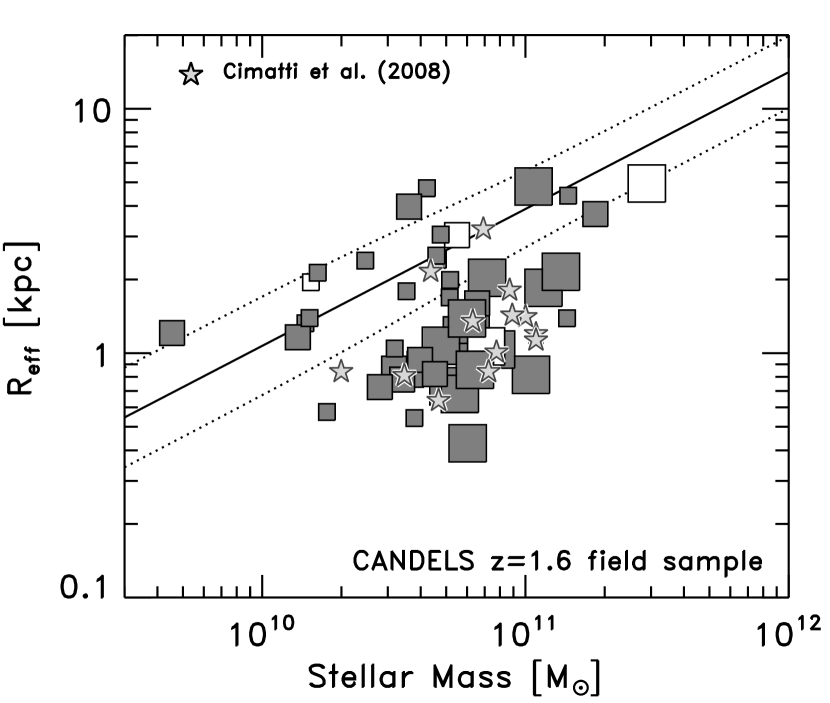
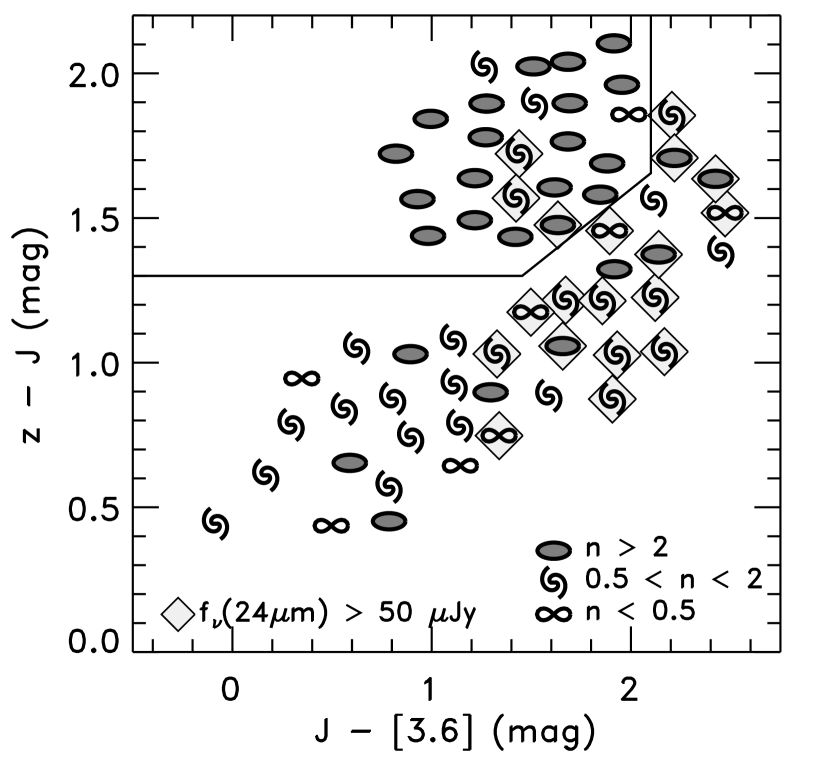
Figure 3 shows the same versus color–color plot as in figure 2 with the galaxies denoted by symbols based on their Sérsic indices as measured by GALFIT. Motivated by Hogg et al. (2004), we classify galaxies with high Sérsic index, , low Sérsic index, , and very low Sérsic index . Galaxies show a relation between their Sérsic indices and their location in the color–color plot of figure 3. Most of the galaxies with high Sérsic indices fall in the region of the plot occupied by quiescent galaxies: the quiescent galaxies have surface-brightness profiles dominated by spheroids. Galaxies with low and very low Sérsic indices fall primarily in the region of the plot occupied by star–forming galaxies: they have surface-brightness profiles dominated by disks. Quantifying these statements, we find that of the 24 cluster galaxies with and colors of quiescent galaxies, 19 (79%) have , suggesting a high early–type galaxy fraction among the passive galaxies in the cluster. Of the galaxies in the star–forming region of figure 3, 28 of 38 galaxies (74%) have , implying they are dominated by objects with disk–like or irregular morphologies. Furthermore, based on the simulations in § 2.3 the errors on the Sérsic index have no substantive impact on our conclusions. Therefore, the color–morphology relation exists in this cluster, with high Sérsicindex (spheroid-dominated) galaxies populating the quiescent region of the color–color plot, and with low Sérsicindex galaxies populating the star–forming region. This extends a similar result observed for field galaxies (Wuyts et al. 2011) and (Bell et al. 2011) to higher density regions associated with the cluster at these redshifts.
4. The Size–Mass Relation for Quiescent Galaxies at
4.1. Comparison between Cluster and Field Quiescent Galaxies
Figure 4 shows the (circularized) effective radii of the the quiescent galaxy samples from CANDELS in both the cluster and the field as a function of their stellar mass. At fixed stellar mass, the quiescent field galaxies at in the CANDELS data generally have effective radii smaller by about a factor of 3 compared to the distribution of low redshift early-type galaxies from SDSS (Shen et al. 2003; Guo et al. 2009), consistent with previous results (see, Cimatti et al. 2008; Cassata et al. 2010, and references therein).
In contrast, the quiescent galaxies associated with the cluster show a relative lack of compact galaxies compared to the quiescent field galaxies at at fixed mass. Quantitatively, the quiescent cluster galaxies with masses and have an interquartile (25–75%-tile) range of kpc with a median of 2.0 kpc, whereas the field galaxies have an interquartile range, kpc with a median of 1.3 kpc. The size of a typical massive, quiescent galaxy in the cluster is larger compared to field galaxies. This trend is consistent qualitatively with recent findings by Cooper et al. (2011) and Zirm et al. (2011). We note, however, that the difference between the sizes of the cluster and field quiescent galaxies declines at higher masses, as many of the galaxies with in both the field and cluster samples have larger effective radii ( kpc; similar to the findings of Rettura et al. 2010). We note that recent work from Raichoor et al. (2012) concludes an opposite trend such that early-type galaxies in higher density regions are smaller. However, the significance of this result is likely a consequence of sample selection and analysis method, as discussed in Cooper et al. (2011).
The relative lack of compact quiescent galaxies in the cluster is unlikely a result of selection effects. There are inherent biases and systematics in the measurement of both the effective sizes and stellar masses (see, e.g., Papovich et al. 2001, 2006; Häussler et al. 2007). However, these mostly affect comparisons between samples of galaxies taken from different datasets and at different redshifts. In the case here, both the cluster and field galaxy samples are selected at the same redshift and using the identical CANDELS dataset. Therefore, the same systematics and biases affect both samples equally. As a result, the relative comparison between the galaxies in the cluster and field is robust.
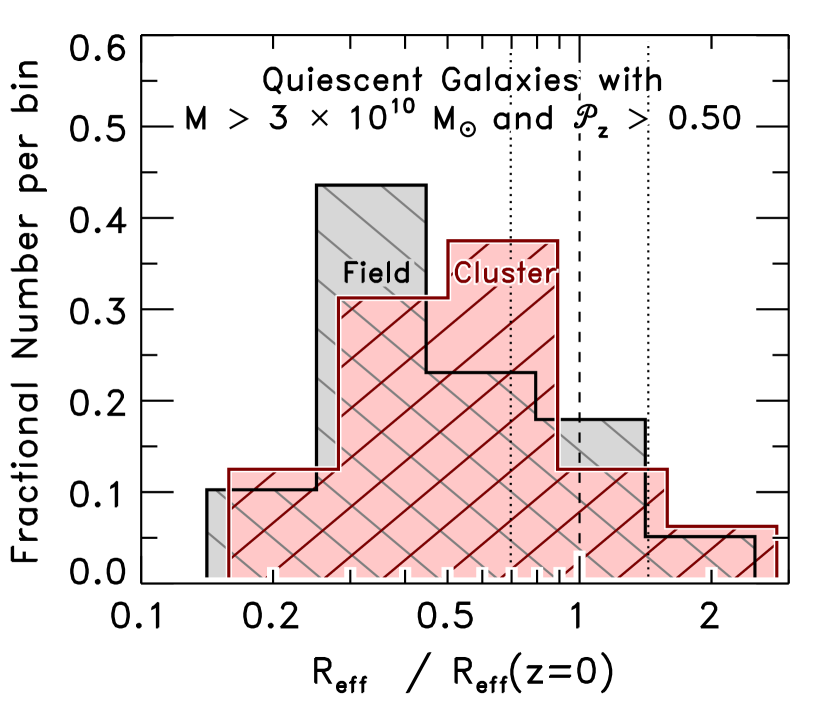
Figure 5 shows the distribution of effective radii for the cluster and field quiescent galaxies relative to the low-redshift relation for early-type galaxies from Shen et al. (2003). The CANDELS UDS samples include quiescent galaxies with stellar masses and . The main difference in the samples is that the cluster galaxies at have a relative lack of quiescent galaxies with low effective sizes compared to the field sample, as discussed above. Formally, a Mann-Whitney-Wilcoxon rank-sum test (Mann & Whitney 1947) gives a 12% likelihood () that both the CANDELS cluster and field samples are drawn from the same parent sample. The significance increases to if we consider a higher fidelity sample of cluster and field galaxies with integrated photometric redshift probability distribution .
There is strong evidence that the size distribution evolves from to , as inferred from other studies. We test this by computing a likelihood that the effective sizes of quiescent field galaxies at and quiescent cluster galaxies at have the same mean sizes as the local sample of early-type galaxies from Shen et al. (2003). A Student’s -statistic gives likelihoods of and , for the field and cluster samples respectively, where the higher likelihood for the cluster is a result of the fact that the mean size of the cluster galaxies is larger than that of the field galaxies. Regardless, based on these tests both the quiescent galaxies in the cluster and field at show strong size evolution compared to the field.
4.2. The Evolution of the Size-Mass Relation in Clusters
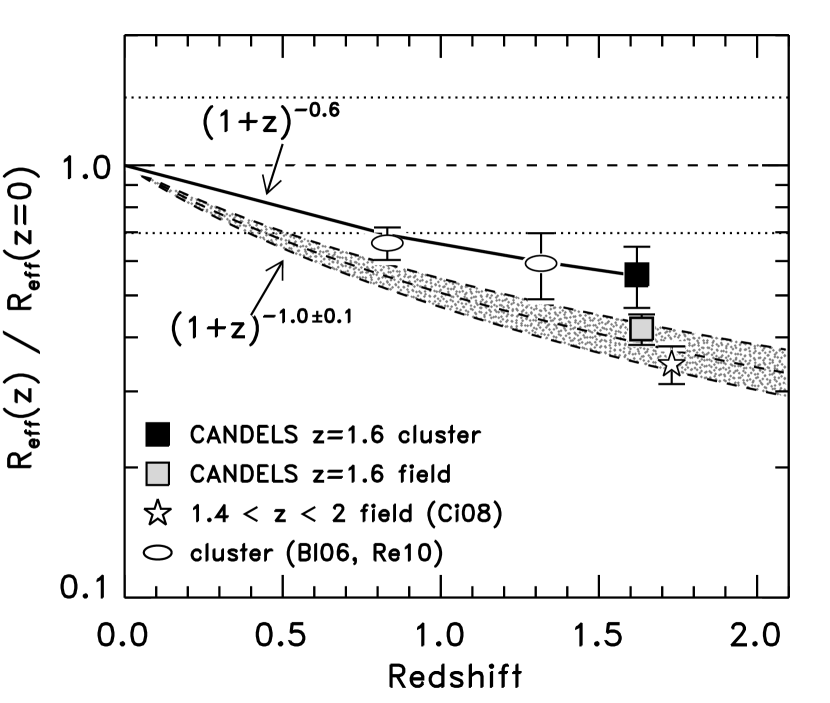
Figure 6 shows the evolution of the relative mean sizes for quiescent galaxies for CANDELS in the cluster and in the field from the compared to other samples in the literature. In all cases we measure the size relative to the low-redshift relation from SDSS Shen et al. (2003). The figure includes the mean relative sizes of early–type galaxies in other high-redshift cluster samples, including MS 1054-03 at and RX J0152.7-1357 at from Blakeslee et al. (2006) and Holden et al. (2009), and RDCS 1252.9-2927 at from Rettura et al. (2010). In addition, the figure shows the mean relative sizes for the field sample of early-type galaxies of Cimatti et al. (2008) at . The shaded curve shows the best-fit relation to the evolution of quiescent galaxies from van der Wel et al. (2008).
We parametrize the size evolution in figure 6 for the cluster samples as . Fitting the data points for the clusters of (Blakeslee et al. 2006) and Rettura et al. (2010), and the cluster from the CANDELS data, we find . This is highly consistent with the 30% increase in the sizes of brightest cluster galaxies at to 0.25 measured by Stott et al. (2011). In comparison, van der Wel et al. (2008) derived a steeper exponent, considering samples of field and cluster early-type galaxies, and this rapid evolution seems required to match the mean sizes of the very compact, passive galaxies at (see also, Damjanov et al. 2011). The data for the quiescent galaxies in the cluster suggest that quiescent galaxies in the high density region of clusters experience slower size evolution from to compared to the field.
5. Evidence for Stellar Disks in Quiescent Cluster Galaxies
5.1. Ellipticity Distributions
As discussed in § 3, the quiescent galaxies in the cluster have concentrated, spheroid-dominated morphologies (Sérsic indices ). In addition, many of the quiescent galaxies have low axial ratios, corresponding to high ellipticities ( where is the ratio of the semi-minor to semi-major axes from GALFIT, see § 2.3). Indeed, many of the quiescent galaxies in figure 2 show elongated morphologies with significant ellipticity.
van der Wel et al. (2011) recently cited the high ellipticities of a majority of field quiescent galaxies at as evidence that these galaxies have prominent disk components, consistent with other studies (McGrath et al. 2008; Weinzirl et al. 2011). This is similar to the observation for both the cluster and field galaxies at here.
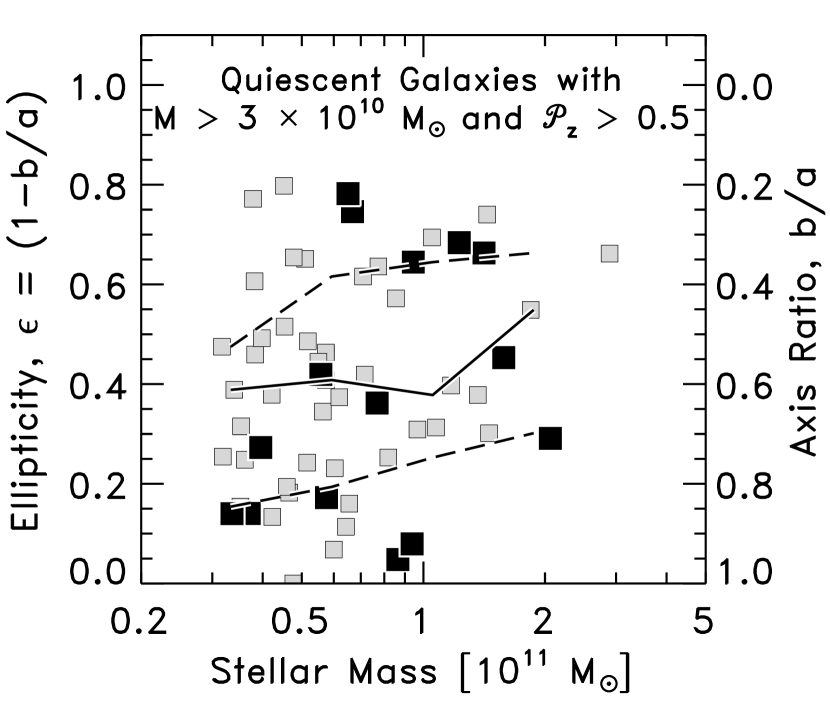
Figure 7 shows the measured ellipticities for the quiescent galaxies in the field and the cluster as a function of stellar mass. Both the quiescent galaxies in the cluster and field in the CANDELS data have relatively high measured ellipticities. The median ellipticity for both samples . As illustrated in figure 7, there is no strong evidence that the ellipticity distributions differ between the field and cluster samples. A Mann-Whitney-Wilcoxon rank-sum test finds no statistically significant difference between the ellipticity distributions for the two samples: we are unable to reject the hypothesis that they are drawn from the same parent sample.
The measured ellipticities of the quiescent galaxies at are comparable to the ellipticities measured for lenticulars and early-type spirals in clusters at , which have (e.g., Vulcani et al. 2011). In contrast, massive cluster ellipticals at low redshift have lower ellipticities, (Holden et al. 2009, 2011) with no indications of evolution (e.g., Vulcani et al. 2011).
However, unlike galaxy samples at lower redshifts (e.g., Holden et al. 2009; van der Wel et al. 2009b), we find no evidence for a trend between the ellipticity and stellar mass in the field and cluster samples. As illustrated in figure 7 the ellipticities of the higher mass () galaxies in both the field and cluster remains high, with a median and with an interquartile range spanning . In contrast, van der Wel et al. (2009b) find a median ellipticity of for non-star-forming galaxies at with , with no apparent evolution to (Holden et al. 2011). Therefore, the massive ( ) quiescent galaxies in both the cluster and field have higher ellipticities than lower redshift () counterparts.
5.2. Surface Brightness Profiles of Quiescent Cluster Galaxies
These ellipticities may indicate flattened disk–like structures viewed in projection. Roughly 50% of the cluster sample, and 30% of the field sample have (see figure 7). Assuming inclination angles are distributed randomly, this implies that a large portion of the massive quiescent galaxies have disk components (Lambas et al. 1992). We investigate the presence of disk components by studying the surface brightness profiles of the four most massive quiescent galaxies associated with the cluster, IDs 39716, 40170, 40640, and 42952 (see Table 1). These four galaxies all have stellar masses (see figure 4) with low levels of star formation.333 We find from the analysis of their spectral energy distributions (§ 2.2 and 3) limits on the SFRs of yr-1, with the exception of 42952 which is consistent with yr-1. These SFRs are consistent with the limits from their (lack of) detected Spitzer 24 µm emission, Jy, implying yr-1. Including both the constraints from the 24µm data and analysis of spectral energy distribution, the specific SFRs for these galaxies are very low, Gyr-1. Three of these four most massive galaxies (39716, 40640, 42952) have .
Figure 8 shows the one–dimensional surface brightness profiles for these galaxies. We fit each galaxy using three models. These include a best–fit GALFIT model using a single component with the Sérsic index, , as a free parameter. We also considered a model with a single component with the Sérsic index fixed at . Lastly, we considered a model with two components, where the Sérsic index is fixed at for one component and at for the other component. In addition, objects 39716 and 40170 show indications of faint companions with angular separations of less than one arcsecond. For the analysis here, we masked the light from these objects to prevent them from affecting these surface brightness fits. However, we find that masking these faint objects changes the derived effective sizes and ellipticities by 15%.
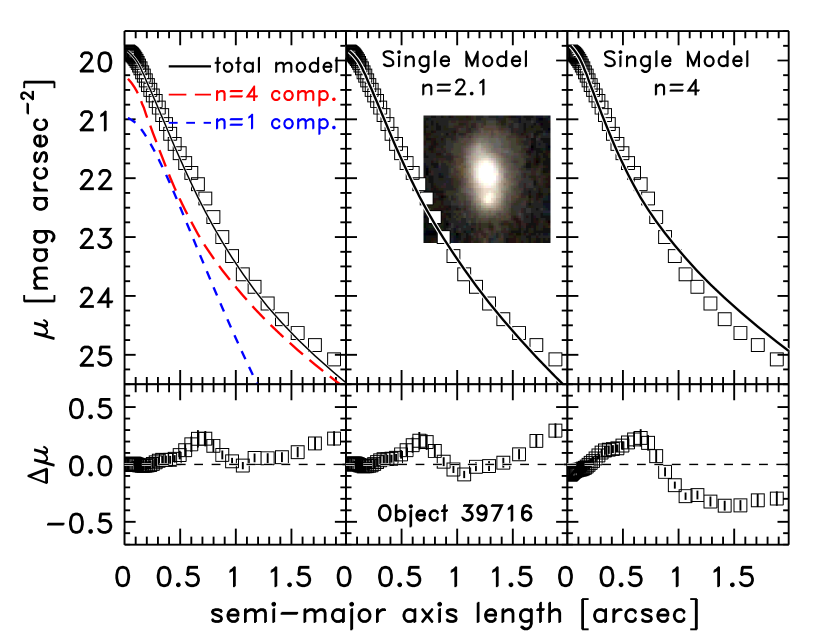
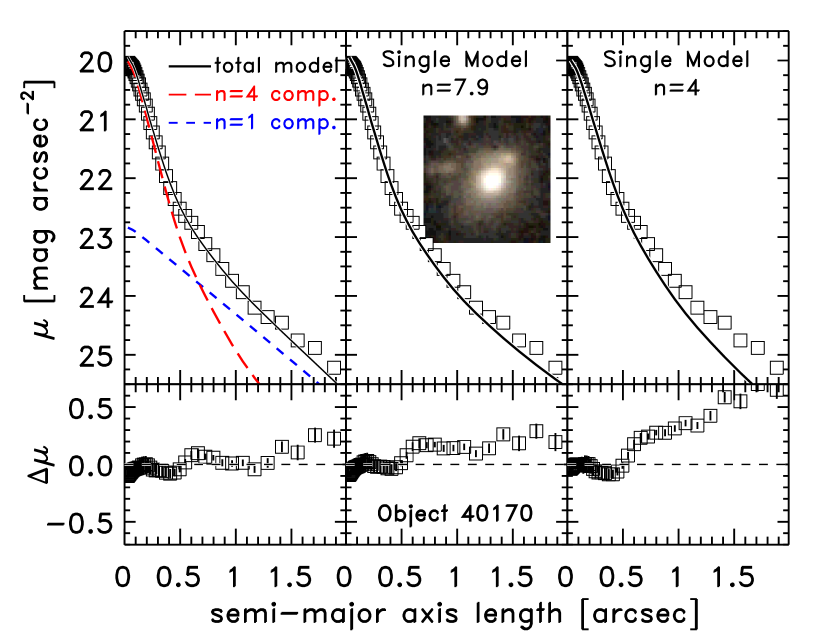
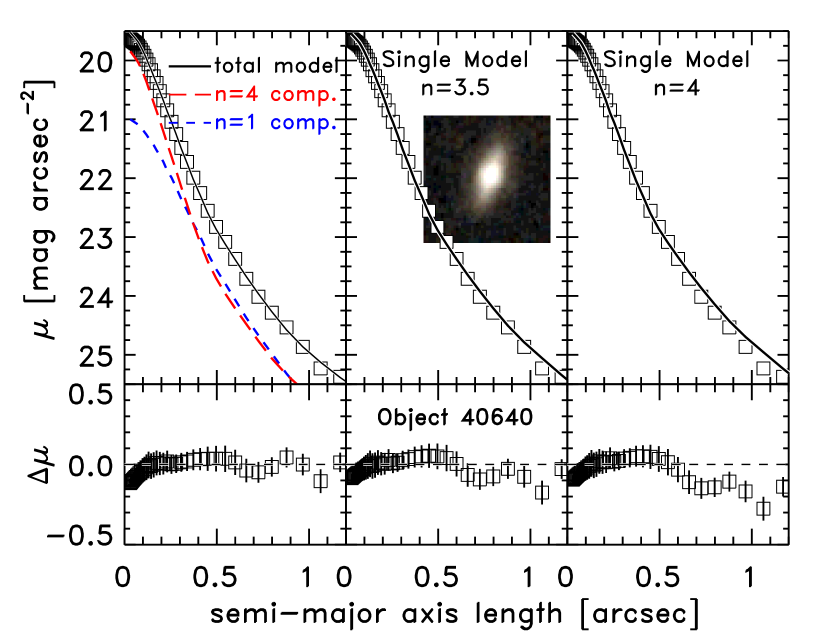
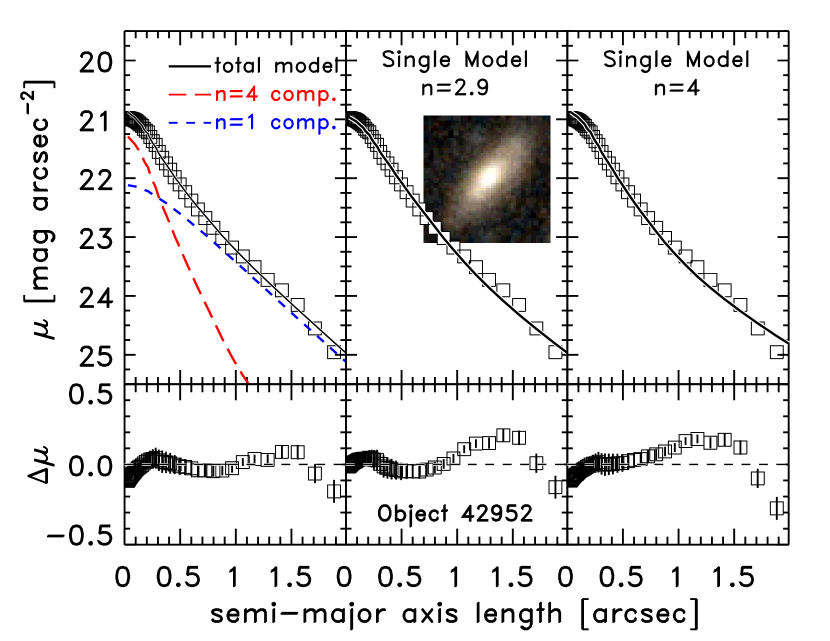
In all cases the single component fits require Sérsic indices for these objects. They are spheroid dominated. Generally, the two component models have lower residuals between the model and the data, particularly at larger radii (see the bottom panels for each galaxy in figure 8). The disk exponential scale length for the components range from 2–5 kpc, consistent with the disk scale lengths for low redshift galaxies of comparable stellar mass in SDSS (Fathi et al. 2010). In all cases the components have ellipticities that are in within 20% of the ellipticity from the fits for each object with single-components. The implication is that the light profiles of these massive cluster galaxies are inconsistent with a model of constant Sérsic index, and they instead favor a model with a radially dependent Sérsic index to describe their structure, with high Sérsic indices at small radii changing to lower Sérsic indices at larger radii.
We use the two-component models to estimate crudely the “bulge–to–total” () ratio for each galaxy, defined as the ratio of the flux in the component to the total flux. Objects 39716, 40170, and 40640 are bulge–dominated, with , consistent with those of lenticular galaxies and ellipticals (Simien & de Vaucouleurs 1986; Graham & Worley 2008). Object 42592 has a lower ratio, . The disk component dominates the light in this galaxy, similar to middle-to-early–type spirals (Simien & de Vaucouleurs 1986; Graham & Worley 2008). Assuming the stellar mass traces the light, the derived imply that 30-50% of the stellar mass lies in the disk component for most of these galaxies, although the disk in 42592 may contain as much of 70% of the stellar mass. Interestingly, unlike the other three objects (39716, 40170, 40640) with all reside within 0.5 Mpc of the luster, object 42952 sits at a projected distance 1.2 Mpc, and there is some evidence quiescent galaxies at this distance exhibit more disk-dominated morphology (R. Bassett et al. 2012, in prep).
We conclude that these massive quiescent galaxies associated with the cluster show evidence for prominent stellar disk components in their surface brightness profiles. The lack of significant star formation in these galaxies suggests that these disks are primarily stellar systems. However, it may also be the case that the spheroids form through the migration of stars formed from violent instabilities in the disk, which stabilizes the gas in the disk against further instabilities that would otherwise form stars (e.g., Dekel et al. 2009a; Martig et al. 2009). Currently, the only HST–quality data (FWHM ) for these galaxies is the CANDELS F125W and F160W imaging used here, and we are unable to test for surface-brightness gradients indicative of variations in the stellar populations of these possible bulge and disk components. However, we see no measurable color gradients in WFC3 images. While this is consistent with McGrath et al. (2008) who find negligible ACS - NICMOS color gradients of early–type galaxies at , Guo et al. (2011) and Szomoru et al. (2011) find evidence that some quiescent galaxies at have negative color gradients with bluer cores and redder outer regions. To test for color-gradients in the galaxies here will require data into the rest-frame near-UV using, e.g., HST/ACS observations.
If this result generalizes to the full sample of quiescent cluster galaxies, the ellipticity distribution in figure 7 provides evidence that a large fraction of these galaxies host stellar disks. The lack of color gradients in WFC3 images suggests the stellar populations in the disk and spheroid components are fairly homogeneous (see, e.g., Papovich et al. 2005; McGrath et al. 2008). However, given that massive cluster galaxies at low redshift are dominated by spheroids with and show no evidence for disks (Postman et al. 2005; Holden et al. 2009), these disk structures must be destroyed at some later time. We discuss the implications of this evidence below.
6. Discussion
6.1. Accelerated Evolution in High Density Regions
The quiescent galaxies in the cluster and the field share many common properties. Their morphologies show dominant spheroidal components. However, both the field and cluster samples have broad ellipticity distributions (figure 7 and § 5), suggesting the presence of disks. Based on the modeling of the galaxies spectral energy distributions and (lack of) IR emission, these quiescent galaxies have low levels of star formation (see § 2.2 and 3), implying they either have low cold–gas fractions, or that the cold gas in the galaxies is stable against instabilities, perhaps as a result of the dominant spheroids (Dekel et al. 2009a; Martig et al. 2009), or the dominance of a stellar component in the disk (Cacciato et al. 2011).
The main difference between the cluster and field quiescent galaxies at is the relative lack of compact, massive quiescent galaxies in this cluster compared to those in the field (figure 4), and this is significant at the level (§ 4.1). If correct, then this result implies that the quiescent galaxies in the cluster have experienced accelerated size growth relative to the quiescent galaxies in the field at .
One possibility is that prior to the quiescent galaxies in the cluster experience accelerated spheroid growth associated with the migration of stellar clumps originally formed in the galaxy disks. Theoretical considerations and cosmological hydrodynamical simulations predict that galaxies at form stars from gravitational instabilities in the disks fed by cold gas accreted in streams and minor mergers along filaments (Dekel et al. 2009b; Ceverino et al. 2010). Over Gyr the instabilities and clumps in the disk migrate inwards and merge and form a passive spheroid (Dekel et al. 2009a; Bournaud et al. 2011). The spheroid stabilizes the disk (leaving it intact) against instabilities, which suppresses star formation. One feature of this model is that spheroid-dominated galaxies at should show disk components with a scale length comparable to that of the spheroid (Martig et al. 2009). This is qualitatively consistent with our CANDELS observations of quiescent galaxies in both the cluster and the field. Nevertheless, because the sizes of the quiescent galaxies in the cluster are larger on average compared to those in the field, this would imply that processes of star-formation in the disk and the migration of stars into a central spheroid happen earlier and/or occur at an accelerated rate for the cluster galaxies, possibly as a result of enhanced gas accretion associated with the higher density region.
Parenthetically, these simulations predict that a small fraction of the gas that flows into the spheroids fuels the growth of supermassive black holes (SMBH). Bournaud et al. (2011) predict that at a galaxy with will have a SMBH with an accretion rate that corresponds to an X-ray luminosity of erg s-1. One of the most massive quiescent galaxies in the cluster, ID 39716 (see Table 1 and § 5.2), has a stellar mass and has an X–ray luminosity erg s-1 (Pierre et al. 2011). Neither the near-IR spectrum (Tanaka et al. 2010) nor IRAC colors of this galaxy show any indication of an AGN. Nevertheless, if this X-ray flux stems from accretion onto a SMBH, then it is consistent with the model predictions.
There are also effects associated with the higher density region of the cluster that could influence the galaxies’ morphological evolution. Interactions between the galaxies and the intracluster medium (ICM) play a significant role in massive clusters (e.g., McCarthy et al. 2008; Balogh et al. 2009). However, it seems doubtful that these influence galaxy evolution in this cluster, as observations of its X-ray emission show that the hot ICM gas has not developed fully (Pierre et al. 2011). Therefore, effects associated with interactions with the ICM are likely less important drivers of galaxy evolution in this cluster (see further discussion in McGee et al. 2009).
Galaxies associated with the cluster likely experience an accelerated merger rate for the reason that this cluster is still forming and has a high density of galaxies. Galaxy assembly via mergers is most effective in small groups and forming clusters at lower redshifts, because these systems have lower velocity dispersions (see, Tran et al. 2008; McIntosh et al. 2008; McGee et al. 2009; Wilman et al. 2009). For example, McIntosh et al. (2008) find evidence that near–equal mass (“major”) mergers between red galaxies are more common in groups than in massive clusters. It follows that mergers are also an important assembly mechanism in forming clusters at higher redshift, and that this process is accelerated in the higher density regions.
Mergers are expected to be an important assembly mechanism for massive, morphologically early-type galaxies. Models show that at late times () these galaxies grow primarily through dissipationless minor mergers and through the steady accretion of smaller stellar systems formed outside the galaxies’ virial radii (Loeb & Peebles 2003; Ciotti et al. 2007; Naab et al. 2009; Oser et al. 2010). These events increase the galaxies’ effective radii with a relatively mild increase in stellar mass. Measurements of the galaxy merger rate in high density regions (such as clusters) show that these mergers occur mainly without star formation (Ellison et al. 2010). (Mergers involving even small amounts of star formation are disfavored by the measured evolution of the colors of cluster galaxies down to lower redshift, van Dokkum & van der Marel 2007). A higher incidence of these dry mergers is expected to play a dominant role in the evolution of quiescent galaxies at (see, e.g., discussion in van der Wel et al. 2011).
Our observation that quiescent galaxies in the cluster have larger sizes could be related to an accelerated dry merger rate associated with the forming cluster. There is some evidence to support this as the massive quiescent galaxies in the cluster appear to show a higher frequency of companions than those in the field, which implies a higher current rate of mass growth from merging (Lotz et al. 2011). This is consistent with the models of Shankar et al. (2011), which predict that at fixed stellar mass central galaxies in larger mass halos have large effective sizes compared to central galaxies in lower-mass haloes. In the Shankar et al. (2012) models, galaxies in different halos masses undergo different types and numbers of mergers, consistent with the results here.
While the observations suggest that cluster galaxies have experienced an accelerated history at redshifts greater than , there is evidence that additional evolution is also required. First, the most massive galaxies in the cluster are still only 10-50% as massive as the brightest galaxies in low redshift clusters (Blakeslee et al. 2006; Holden et al. 2009; Valentinuzzi et al. 2010). These galaxies need to increase both their stellar masses and their effective sizes by at least a factor of 2. Simulations predict that the growth of massive cluster galaxies at “late” times () should occur more through the dissipationless mergers of relatively massive progenitors (e.g., De Lucia & Blaizot 2007; Ruszkowski & Springel 2009). Ruszkowski & Springel (2009) predict that dry major mergers are an important growth mechanism for galaxies at , and that the number of major mergers declines strongly with galaxy mass. If this is the case, then we may expect that the more massive quiescent galaxies ( ) associated with this cluster will experience 1–4 additional major dissipationless mergers (see also § 6.2). This is similar to the findings of van Dokkum et al. (1999) that 50% of massive early-type massive galaxies in the cluster MS 1054+03 will undergo a dry major merger at .
Second, the ellipticity distributions of the quiescent galaxies in the cluster are shifted to relative high values, and these galaxies show evidence for extended disks. Both facts contrast strongly with observations of early-type cluster galaxies at (see § 5). Mergers would account both for the required evolution in size, ellipticity, and mass as they transform the surface brightness profiles toward higher Sérsic indices (see, e.g., Navarro 1990).
Lastly, measurements of the luminosity function of red-sequence cluster galaxies show that the bright (massive) end is consistent with passive evolution since (Rudnick et al. 2009). However, a preliminary analysis shows that in the cluster here the bright end of the red-sequence-galaxy luminosity function is not fully formed, and the massive galaxies require additional mass growth mostly through dry mergers without substantial star formation Rudnick et al. (2012).
Therefore, we conclude that the quiescent galaxies associated with the cluster require additional growth through dry mergers to match the properties of early-type massive galaxies in lower redshift clusters. This is consistent with the findings of McGrath et al. (2008) and van der Wel et al. (2011) for quiescent field galaxies at . However, as discussed in § 4.2, the quiescent galaxies in the cluster appear to require less size growth from to compared to field galaxies in order to them to be consistent with the size-mass relation for quiescent galaxies in the field and clusters (Weinmann et al. 2009; Valentinuzzi et al. 2010). Because dissipationless mergers of low-mass companions (“minor” mergers) produce more size growth relative to stellar-mass growth. If quiescent galaxies grow primarily through this mechanism, then it seems to follow that the quiescent galaxies in the cluster will experience additional mergers weighted toward more massive progenitors (i.e., they will experience more major mergers), compared to quiescent galaxies in the lower density field.
6.2. The formation of the brightest cluster galaxy?
One interesting possibility is that the most massive quiescent galaxies in the cluster could merge into the brightest cluster galaxy (BCG). Valentinuzzi et al. (2010) show that while early–type galaxies in local clusters follow the size–mass relation of other (field) early–type galaxies (see also Weinmann et al. 2009), BCGs are often outliers, having significantly larger effective radii for their stellar mass (Bernardi et al. 2007; Ruszkowski & Springel 2009), although see Lauer et al. (2007) and Guo et al. (2009) for alternative interpretations. The most massive galaxies in the cluster have stellar masses , and these would require at least a factor of 2 growth (and as much as a factor of 5) to achieve the stellar mass of the BCGs in lower redshift clusters measured by Valentinuzzi et al. (2010).
The two most massive galaxies in the cluster, ID 39716 and 40170 (see figure 8), are both near the core of the cluster (each within a physical distance of 70 kpc), and they have a projected physical separation of 126 kpc. Assuming these galaxies have relative velocities of km s-1 (about one third the estimated velocity dispersion), they would experience a first pass encounter in Gyr. It therefore seems entirely likely that these galaxies will merge by . This is consistent with simulations that predict the progenitor of the BCG should experience major mergers between and (e.g., De Lucia & Blaizot 2007; Ruszkowski & Springel 2009). These galaxies currently have stellar masses and , and effective radii, 2.6 and 3.2 kpc, respectively. Assuming they will merge with no additional star formation, the remnant will have a stellar mass , with a more compact morphology (Sérsic index ), and grow in effective radius to 6 kpc, based on arguments from the virial theorem (see Nipoti et al. 2003). Additional growth through mergers and accretion (including accretion through dynamical friction of other galaxies in the cluster potential) would increase the size and mass further, shifting the new galaxy along (or even above) the size–mass relationship in figure 4 (consistent with some low redshift BCGs, see Valentinuzzi et al. 2010). Therefore, it seems we are witnessing the progenitors of the BCG in this cluster before they merge.
7. Summary
In this paper we discussed morphological properties of galaxies in a cluster XMM–LSS J02182-05102 using partial near-IR coverage from HST/WFC3 as part of CANDELS. The cluster shows a prominent red sequence dominated by galaxies with colors consistent with passive evolution (Papovich et al. 2010), although there is a population of star-forming galaxies in this cluster with high SFRs (Tran et al. 2010). Recent Chandra data for this cluster show that the X-ray emission is mostly attributed to point sources, suggesting that this cluster is still in the process of collapse (Pierre et al. 2011). Therefore, we are able to study galaxy evolution in the high density region of a forming cluster at high redshift.
The HST/WFC3 images show that the cluster galaxies exhibit a clear color–morphology relation, where galaxies with colors of quiescent stellar populations have dominant spheroids, and galaxies with colors consistent with ongoing star formation have disk–like and irregular morphologies.
The quiescent cluster galaxies follow a size–mass relationship, but the cluster is deficient in quiescent galaxies with compact effective radii compared to quiescent galaxies in the field at . The average effective radii of the quiescent galaxies in the cluster are larger compared to quiescent galaxies in the field at fixed stellar mass (% significance).
If the difference in effective radii between the cluster and field galaxies is generalizable, then it implies that the quiescent cluster galaxies experience accelerated size evolution at redshifts greater than 1.6 compared to similarly selected field galaxies. Because other mechanisms associated with interactions between the galaxies and the cluster ICM are not yet operating, we argue that to explain the observations quiescent cluster galaxies have had accelerated spheroid formation, possibly as a result of the migration of stars formed in disks, and/or merger histories associated with the formation of this cluster. This gives rise to an accelerated size growth compared to galaxies in the field.
The morphologies of quiescent galaxies in the field and cluster are dominated by spheroids. However, their ellipticity distributions are broad, with median values , with no trend between ellipticity and mass, in contrast to lower redshift samples. Both the ellipticity distributions and the surface-brightness profiles of the massive cluster galaxies suggest these galaxies host stellar disk components. Because the quiescent galaxies have low estimated SFRs, these disks are likely composed of stellar material with low gas fractions available for star formation, either because they have depleted their gas supplies, or that the dominant spheroids stabilize the gas in the disks, hindering the formation of instabilities. This is true even for the massive quiescent cluster galaxies ( ), which show no indications of star formation, are spheroid–dominated, yet show extended emission consistent with disks of scale lengths, 2–5 kpc. The implication is that these galaxies have significant stellar disks, similar to the interpretation of data for passive galaxies in the field at (McGrath et al. 2008; van der Wel et al. 2011). These extended disks are not present in quiescent galaxies in clusters at lower redshifts () (Holden et al. 2009). Therefore, some mechanism must transform or destroy these disks in the few billion years from to .
The quiescent galaxies in the cluster at require additional growth to match the observed properties of massive galaxies in clusters at lower redshift. Several lines of evidence suggest this additional growth occurs via dissipationless (dry) mergers. These mergers will increase the sizes and stellar masses of the quiescent galaxies, and affect the morphological transformation to more compact surface–brightness profiles (). However, because the quiescent galaxies associated with the cluster at have larger sizes, they appear to require slower size growth at later times () compared to galaxies in the field. The evidence for this is a result of comparing the data here with results from the literature. The size evolution of massive cluster galaxies is relatively slow from to the present, with sizes evolving as compared to for field galaxies (van der Wel et al. 2008).
To summarize, the data provide evidence that the morphology and size evolution in the quiescent cluster galaxies is accelerated compared to field galaxies prior to to account for the larger average sizes of the quiescent cluster galaxies at this redshift. In addition, we conclude that additional growth is necessary for these galaxies and that most of the growth occurs via dry mergers without significant star formation. Furthermore, in the case of the quiescent cluster galaxies at , much of this merger activity must occur between such that these galaxies have the morphological properties (Sérsic indices and ellipticities) of cluster galaxies at lower redshift. This merger scenario appears consistent with semianalytic model predictions, which predict that dissipationless mergers dominate the mass growth of massive galaxies at (e.g., De Lucia & Blaizot 2007; Ruszkowski & Springel 2009).
One caveat to these conclusions is that our analysis is based on only a single cluster at , which currently has HST/WFC3 imaging for quiescent cluster galaxies. Clearly, extending this analysis to galaxies in other clusters at is required to determine if the results here are generalized to quiescent galaxies in other high density environments.
References
- Balogh et al. (2009) Balogh, M. L., et al. 2009, MNRAS, 398, 754
- Bell et al. (2006) Bell, E. F., et al. 2006, ApJ, 640, 241
- Bell et al. (2011) —. 2011, ApJ, submitted, arXiv:1110.3786
- Bernardi et al. (2007) Bernardi, M., Hyde, J. B., Sheth, R. K., Miller, C. J., & Nichol, R. C. 2007, AJ, 133, 1741
- Bezanson et al. (2009) Bezanson, R., van Dokkum, P. G., Tal, T., Marchesini, D., Kriek, M., Franx, M., & Coppi, P. 2009, ApJ, 697, 1290
- Blakeslee et al. (2003) Blakeslee, J. P., et al. 2003, ApJ, 596, L143
- Blakeslee et al. (2006) —. 2006, ApJ, 644, 30
- Bournaud et al. (2011) Bournaud, F., Dekel, A., Teyssier, R., Cacciato, M., Daddi, E., Juneau, S., & Shankar, F. 2011, ArXiv e-prints
- Boylan-Kolchin et al. (2009) Boylan-Kolchin, M., Springel, V., White, S. D. M., Jenkins, A., & Lemson, G. 2009, MNRAS, 398, 1150
- Brammer et al. (2008) Brammer, G. B., van Dokkum, P. G., & Coppi, P. 2008, ApJ, 686, 1503
- Bruzual & Charlot (2003) Bruzual, G., & Charlot, S. 2003, MNRAS, 344, 1000
- Buitrago et al. (2008) Buitrago, F., Trujillo, I., Conselice, C. J., Bouwens, R. J., Dickinson, M., & Yan, H. 2008, ApJ, 687, L61
- Cacciato et al. (2011) Cacciato, M., Dekel, A., & Genel, S. 2011, ArXiv e-prints
- Calzetti et al. (2000) Calzetti, D., Armus, L., Bohlin, R. C., Kinney, A. L., Koornneef, J., & Storchi-Bergmann, T. 2000, ApJ, 533, 682
- Cassata et al. (2010) Cassata, P., et al. 2010, ApJ, 714, L79
- Ceverino et al. (2010) Ceverino, D., Dekel, A., & Bournaud, F. 2010, MNRAS, 404, 2151
- Cimatti et al. (2008) Cimatti, A., et al. 2008, A&A, 482, 21
- Ciotti et al. (2007) Ciotti, L., Lanzoni, B., & Volonteri, M. 2007, ApJ, 658, 65
- Cooper et al. (2011) Cooper, M. C., et al. 2011, MNRAS, submitted, arXiv:1109.5698
- Daddi et al. (2005) Daddi, E., et al. 2005, ApJ, 626, 680
- Damjanov et al. (2009) Damjanov, I., et al. 2009, ApJ, 695, 101
- Damjanov et al. (2011) —. 2011, ArXiv e-prints
- De Lucia & Blaizot (2007) De Lucia, G., & Blaizot, J. 2007, MNRAS, 375, 2
- De Lucia et al. (2007) De Lucia, G., et al. 2007, MNRAS, 374, 809
- de Vaucouleurs (1948) de Vaucouleurs, G. 1948, Annales d’Astrophysique, 11, 247
- Dekel et al. (2009a) Dekel, A., Sari, R., & Ceverino, D. 2009a, ApJ, 703, 785
- Dekel et al. (2009b) Dekel, A., et al. 2009b, Nature, 457, 451
- Desai et al. (2007) Desai, V., et al. 2007, ApJ, 660, 1151
- Dressler (1980) Dressler, A. 1980, ApJ, 236, 351
- Dubinski (1998) Dubinski, J. 1998, ApJ, 502, 141
- Eisenhardt et al. (2008) Eisenhardt, P. R. M., et al. 2008, ApJ, 684, 905
- Ellison et al. (2010) Ellison, S. L., Patton, D. R., Simard, L., McConnachie, A. W., Baldry, I. K., & Mendel, J. T. 2010, MNRAS, 407, 1514
- Fathi et al. (2010) Fathi, K., Allen, M., Boch, T., Hatziminaoglou, E., & Peletier, R. F. 2010, MNRAS, 406, 1595
- Furusawa et al. (2008) Furusawa, H., et al. 2008, ApJS, 176, 1
- Graham (2011) Graham, A. W. 2011, Planets, Stars and Stellar Systems (Berlin: Springer), in press (arXiv:1108.0997)
- Graham & Worley (2008) Graham, A. W., & Worley, C. C. 2008, MNRAS, 388, 1708
- Grogin et al. (2011) Grogin, N. A., et al. 2011, ArXiv e-prints
- Guo et al. (2009) Guo, Y., et al. 2009, MNRAS, 398, 1129
- Guo et al. (2011) —. 2011, ApJ, 735, 18
- Häussler et al. (2007) Häussler, B., et al. 2007, ApJS, 172, 615
- Hilton et al. (2009) Hilton, M., et al. 2009, ApJ, 697, 436
- Hogg et al. (2004) Hogg, D. W., et al. 2004, ApJ, 601, L29
- Holden et al. (2011) Holden, B., van der Wel, A., Rix, H.-W., & Franx, M. 2011, ApJ, submitted, arXiv:1108.6086
- Holden et al. (2009) Holden, B. P., et al. 2009, ApJ, 693, 617
- Hopkins et al. (2010) Hopkins, P. F., Bundy, K., Hernquist, L., Wuyts, S., & Cox, T. J. 2010, MNRAS, 401, 1099
- Hopkins et al. (2009a) Hopkins, P. F., Bundy, K., Murray, N., Quataert, E., Lauer, T. R., & Ma, C.-P. 2009a, MNRAS, 398, 898
- Hopkins et al. (2009b) Hopkins, P. F., Hernquist, L., Cox, T. J., Keres, D., & Wuyts, S. 2009b, ApJ, 691, 1424
- Just et al. (2010) Just, D. W., Zaritsky, D., Sand, D. J., Desai, V., & Rudnick, G. 2010, ApJ, 711, 192
- Khochfar & Silk (2006a) Khochfar, S., & Silk, J. 2006a, ApJ, 648, L21
- Khochfar & Silk (2006b) —. 2006b, MNRAS, 370, 902
- Koekemoer et al. (2011) Koekemoer, A. M., et al. 2011, ArXiv e-prints
- Kriek et al. (2006) Kriek, M., et al. 2006, ApJ, 649, L71
- Krist (1995) Krist, J. 1995, in Astronomical Society of the Pacific Conference Series, Vol. 77, Astronomical Data Analysis Software and Systems IV, ed. R. A. Shaw, H. E. Payne, & J. J. E. Hayes, 349–+
- Lambas et al. (1992) Lambas, D. G., Maddox, S. J., & Loveday, J. 1992, MNRAS, 258, 404
- Lauer et al. (2007) Lauer, T. R., et al. 2007, ApJ, 662, 808
- Lawrence et al. (2007) Lawrence, A., et al. 2007, MNRAS, 379, 1599
- Lidman et al. (2008) Lidman, C., et al. 2008, A&A, 489, 981
- Lin & Mohr (2004) Lin, Y.-T., & Mohr, J. J. 2004, ApJ, 617, 879
- Loeb & Peebles (2003) Loeb, A., & Peebles, P. J. E. 2003, ApJ, 589, 29
- Longhetti et al. (2007) Longhetti, M., et al. 2007, MNRAS, 374, 614
- Lotz et al. (2008) Lotz, J. M., et al. 2008, ApJ, 672, 177
- Lotz et al. (2011) —. 2011, ApJ, submitted, arXiv:1110.3821
- Mann & Whitney (1947) Mann, H. B., & Whitney, D. R. 1947, The Annals of Mathematical Statistics, 18, 50
- Marchesini et al. (2009) Marchesini, D., van Dokkum, P. G., Förster Schreiber, N. M., Franx, M., Labbé, I., & Wuyts, S. 2009, ApJ, 701, 1765
- Martig et al. (2009) Martig, M., Bournaud, F., Teyssier, R., & Dekel, A. 2009, ApJ, 707, 250
- Masjedi et al. (2008) Masjedi, M., Hogg, D. W., & Blanton, M. R. 2008, ApJ, 679, 260
- McCarthy et al. (2008) McCarthy, I. G., Frenk, C. S., Font, A. S., Lacey, C. G., Bower, R. G., Mitchell, N. L., Balogh, M. L., & Theuns, T. 2008, MNRAS, 383, 593
- McGee et al. (2009) McGee, S. L., Balogh, M. L., Bower, R. G., Font, A. S., & McCarthy, I. G. 2009, MNRAS, 400, 937
- McGrath et al. (2008) McGrath, E. J., Stockton, A., Canalizo, G., Iye, M., & Maihara, T. 2008, ApJ, 682, 303
- McIntosh et al. (2008) McIntosh, D. H., Guo, Y., Hertzberg, J., Katz, N., Mo, H. J., van den Bosch, F. C., & Yang, X. 2008, MNRAS, 388, 1537
- Mei et al. (2006) Mei, S., et al. 2006, ApJ, 644, 759
- Naab et al. (2006a) Naab, T., Jesseit, R., & Burkert, A. 2006a, MNRAS, 372, 839
- Naab et al. (2009) Naab, T., Johansson, P. H., & Ostriker, J. P. 2009, ApJ, 699, L178
- Naab et al. (2007) Naab, T., Johansson, P. H., Ostriker, J. P., & Efstathiou, G. 2007, ApJ, 658, 710
- Naab et al. (2006b) Naab, T., Khochfar, S., & Burkert, A. 2006b, ApJ, 636, L81
- Navarro (1990) Navarro, J. F. 1990, MNRAS, 242, 311
- Nipoti et al. (2003) Nipoti, C., Stiavelli, M., Ciotti, L., Treu, T., & Rosati, P. 2003, MNRAS, 344, 748
- Oke & Gunn (1983) Oke, J. B., & Gunn, J. E. 1983, ApJ, 266, 713
- Oser et al. (2010) Oser, L., Ostriker, J. P., Naab, T., Johansson, P. H., & Burkert, A. 2010, ApJ, 725, 2312
- Overzier et al. (2008) Overzier, R. A., et al. 2008, ApJ, 673, 143
- Papovich (2008) Papovich, C. 2008, ApJ, 676, 206
- Papovich et al. (2001) Papovich, C., Dickinson, M., & Ferguson, H. C. 2001, ApJ, 559, 620
- Papovich et al. (2005) Papovich, C., Dickinson, M., Giavalisco, M., Conselice, C. J., & Ferguson, H. C. 2005, ApJ, 631, 101
- Papovich et al. (2006) Papovich, C., et al. 2006, ApJ, 640, 92
- Papovich et al. (2010) —. 2010, ApJ, 716, 1503
- Patel et al. (2011) Patel, S. G., Kelson, D. D., Holden, B. P., Franx, M., & Illingworth, G. D. 2011, ApJ, submitted, arXiv:1104.0934
- Peng et al. (2002) Peng, C. Y., Ho, L. C., Impey, C. D., & Rix, H. 2002, AJ, 124, 266
- Peter et al. (2007) Peter, A. H. G., Shapley, A. E., Law, D. R., Steidel, C. C., Erb, D. K., Reddy, N. A., & Pettini, M. 2007, ApJ, 668, 23
- Pierre et al. (2011) Pierre, M., Clerc, N., Maughan, B., Pacaud, F., Papovich, C., & Willmer, C. N. A. 2011, ArXiv e-prints
- Postman & Geller (1984) Postman, M., & Geller, M. J. 1984, ApJ, 281, 95
- Postman et al. (2005) Postman, M., et al. 2005, ApJ, 623, 721
- Quadri et al. (2011) Quadri, R. F., Williams, R. J., Franx, M., & Hildebrandt, H. 2011, ArXiv e-prints
- Raichoor et al. (2012) Raichoor, A., et al. 2012, ApJ, 745, 130
- Rettura et al. (2010) Rettura, A., et al. 2010, ApJ, 709, 512
- Rudnick et al. (2012) Rudnick, G., Tran, K.-V., Papovich, C., Momcheva, I., & Willmer, C. N. A. 2012, ApJ, submitted
- Rudnick et al. (2009) Rudnick, G., et al. 2009, ApJ, 700, 1559
- Ruszkowski & Springel (2009) Ruszkowski, M., & Springel, V. 2009, ApJ, 696, 1094
- Saracco et al. (2010) Saracco, P., Longhetti, M., & Gargiulo, A. 2010, MNRAS, 408, L21
- Sérsic (1968) Sérsic, J. L. 1968, Atlas de galaxias australes (Cordoba, Argentina: Observatorio Astronomico, 1968)
- Shankar et al. (2011) Shankar, F., Marulli, F., Bernardi, M., Mei, S., Meert, A., & Vikram, V. 2011, MNRAS, submitted, arXiv:1105.6043
- Shen et al. (2003) Shen, S., Mo, H. J., White, S. D. M., Blanton, M. R., Kauffmann, G., Voges, W., Brinkmann, J., & Csabai, I. 2003, MNRAS, 343, 978
- Simien & de Vaucouleurs (1986) Simien, F., & de Vaucouleurs, G. 1986, ApJ, 302, 564
- Stanford et al. (1998) Stanford, S. A., Eisenhardt, P. R., & Dickinson, M. 1998, ApJ, 492, 461
- Stockton et al. (2010) Stockton, A., Shih, H.-Y., & Larson, K. 2010, ApJ, 709, L58
- Stott et al. (2011) Stott, J. P., Collins, C. A., Burke, C., Hamilton-Morris, V., & Smith, G. P. 2011, MNRAS, 414, 445
- Szomoru et al. (2011) Szomoru, D., Franx, M., Bouwens, R. J., van Dokkum, P. G., Labbé, I., Illingworth, G. D., & Trenti, M. 2011, ApJ, 735, L22+
- Tanaka et al. (2010) Tanaka, M., Finoguenov, A., & Ueda, Y. 2010, ApJ, 716, L152
- Toft et al. (2007) Toft, S., et al. 2007, ApJ, 671, 285
- Tran et al. (2008) Tran, K., Moustakas, J., Gonzalez, A. H., Bai, L., Zaritsky, D., & Kautsch, S. J. 2008, ApJ, 683, L17
- Tran et al. (2010) Tran, K., et al. 2010, ApJ, 719, L126
- Trujillo et al. (2007) Trujillo, I., Conselice, C. J., Bundy, K., Cooper, M. C., Eisenhardt, P., & Ellis, R. S. 2007, MNRAS, 382, 109
- Trujillo et al. (2006) Trujillo, I., et al. 2006, ApJ, 650, 18
- Valentinuzzi et al. (2010) Valentinuzzi, T., et al. 2010, ApJ, 712, 226
- van der Wel et al. (2009a) van der Wel, A., Bell, E. F., van den Bosch, F. C., Gallazzi, A., & Rix, H. 2009a, ApJ, 698, 1232
- van der Wel et al. (2008) van der Wel, A., Holden, B. P., Zirm, A. W., Franx, M., Rettura, A., Illingworth, G. D., & Ford, H. C. 2008, ApJ, 688, 48
- van der Wel et al. (2009b) van der Wel, A., Rix, H.-W., Holden, B. P., Bell, E. F., & Robaina, A. R. 2009b, ApJ, 706, L120
- van der Wel et al. (2011) van der Wel, A., et al. 2011, ApJ, 730, 38
- van Dokkum (2005) van Dokkum, P. G. 2005, AJ, 130, 2647
- van Dokkum & Franx (2001) van Dokkum, P. G., & Franx, M. 2001, ApJ, 553, 90
- van Dokkum et al. (1999) van Dokkum, P. G., Franx, M., Fabricant, D., Kelson, D. D., & Illingworth, G. D. 1999, ApJ, 520, L95
- van Dokkum & van der Marel (2007) van Dokkum, P. G., & van der Marel, R. P. 2007, ApJ, 655, 30
- van Dokkum et al. (2004) van Dokkum, P. G., et al. 2004, ApJ, 611, 703
- van Dokkum et al. (2008) —. 2008, ApJ, 677, L5
- van Dokkum et al. (2010) —. 2010, ApJ, 709, 1018
- Vulcani et al. (2011) Vulcani, B., et al. 2011, MNRAS, 413, 921
- Weinmann et al. (2009) Weinmann, S. M., Kauffmann, G., van den Bosch, F. C., Pasquali, A., McIntosh, D. H., Mo, H., Yang, X., & Guo, Y. 2009, MNRAS, 394, 1213
- Weinzirl et al. (2011) Weinzirl, T., et al. 2011, ApJ, submitted
- Whiley et al. (2008) Whiley, I. M., et al. 2008, MNRAS, 387, 1253
- Williams et al. (2009) Williams, R. J., Quadri, R. F., Franx, M., van Dokkum, P., & Labbé, I. 2009, ApJ, 691, 1879
- Wilman et al. (2009) Wilman, D. J., Oemler, A., Mulchaey, J. S., McGee, S. L., Balogh, M. L., & Bower, R. G. 2009, ApJ, 692, 298
- Wuyts et al. (2009) Wuyts, S., et al. 2009, ApJ, 700, 799
- Wuyts et al. (2011) —. 2011, ApJ, in press, arXiv:1107.0317
- Zirm et al. (2011) Zirm, A. W., Toft, S., & Tanaka, M. 2011, ApJ, in press, arXiv:1110.0327
- Zirm et al. (2007) Zirm, A. W., et al. 2007, ApJ, 656, 66
| ID | R.A. | Decl. | yr-1 | ||||||||||
|---|---|---|---|---|---|---|---|---|---|---|---|---|---|
| (deg) | (deg) | (mag) | (mag) | (mag) | (kpc) | (Mpc) | |||||||
| (1) | (2) | (3) | (4) | (5) | (6) | (7) | (8) | (9) | (10) | (11) | (12) | (13) | (14) |
| 39681 | 34.58987 | 1.78 | 0.38 | 23.85 | 0.61 | 0.04 | |||||||
| 39716 | 34.58789 | 1.62 | 0.88 | 20.96 | 0.45 | 0.06 | |||||||
| 40170 | 34.58979 | 1.56 | 0.77 | 21.19 | 0.29 | 0.07 | |||||||
| 39988 | 34.58759 | 1.69 | 0.69 | 22.88 | 0.22 | 0.07 | |||||||
| 39513 | 34.58626 | 1.64 | 0.55 | 23.92 | 0.14 | 0.09 | |||||||
| 39770 | 34.59290 | 1.67 | 0.51 | 22.95 | 0.15 | 0.13 | |||||||
| 39462 | 34.59291 | 1.64 | 0.50 | 23.11 | 0.70 | 0.14 | |||||||
| 39218 | 34.58884 | 1.65 | 0.86 | 22.83 | 0.52 | 0.14 | |||||||
| 40387 | 34.59092 | 1.73 | 0.52 | 22.32 | 0.46 | 0.15 | |||||||
| 40249 | 34.58516 | 1.58 | 0.74 | 22.19 | 0.18 | 0.15 | |||||||
| 39062 | 34.59174 | 1.68 | 0.53 | 23.47 | 0.14 | 0.19 | |||||||
| 40299 | 34.59352 | 1.58 | 0.45 | 35.36 | 0.36 | 0.20 | |||||||
| 40449 | 34.58736 | 1.69 | 0.44 | 23.95 | 0.48 | 0.21 | |||||||
| 39858 | 34.58199 | 1.60 | 0.54 | 22.90 | 0.57 | 0.21 | |||||||
| 39230 | 34.59285 | 1.63 | 0.69 | 22.27 | 0.63 | 0.21 | |||||||
| 40422 | 34.58407 | 1.84 | 0.36 | 23.59 | 0.83 | 0.22 | |||||||
| 39395 | 34.58038 | 1.67 | 0.77 | 22.48 | 0.17 | 0.27 | |||||||
| 40238 | 34.58054 | 1.73 | 0.50 | 22.27 | 0.78 | 0.28 | |||||||
| 40728 | 34.58487 | 1.77 | 0.42 | 23.42 | 0.40 | 0.29 | |||||||
| 40164 | 34.57984 | 1.68 | 0.47 | 22.69 | 0.40 | 0.29 | |||||||
| 40730 | 34.59290 | 1.74 | 0.43 | 23.86 | 0.52 | 0.30 | |||||||
| 40748 | 34.58281 | 1.65 | 0.88 | 21.96 | 0.27 | 0.31 | |||||||
| 39175 | 34.57958 | 1.69 | 0.53 | 23.21 | 0.25 | 0.31 | |||||||
| 40567 | 34.58071 | 1.77 | 0.40 | 23.50 | 0.62 | 0.33 | |||||||
| 40456 | 34.57959 | 1.58 | 0.49 | 23.49 | 0.36 | 0.34 | |||||||
| 39600 | 34.57702 | 1.63 | 0.63 | 23.19 | 0.47 | 0.36 | |||||||
| 38665 | 34.57904 | 1.65 | 0.59 | 22.74 | 0.49 | 0.42 | |||||||
| 38030 | 34.58667 | 1.49 | 0.38 | 22.95 | 0.80 | 0.45 | |||||||
| 40606 | 34.57457 | 1.55 | 0.58 | 22.62 | 0.31 | 0.48 | |||||||
| 40901 | 34.57618 | 1.80 | 0.30 | 23.32 | 0.50 | 0.49 | |||||||
| 41634 | 34.58741 | 1.74 | 0.46 | 23.20 | 0.51 | 0.50 | |||||||
| 40640 | 34.57339 | 1.61 | 0.89 | 21.37 | 0.66 | 0.51 | |||||||
| 40749 | 34.57211 | 1.60 | 0.79 | 23.35 | 0.51 | 0.56 | |||||||
| 40064 | 34.57000 | 1.57 | 0.42 | 23.78 | 0.58 | 0.58 | |||||||
| 41493 | 34.57659 | 1.84 | 0.30 | 23.36 | 0.30 | 0.58 | |||||||
| 41510 | 34.57689 | 1.87 | 0.30 | 24.26 | 0.04 | 0.59 | |||||||
| 41874 | 34.57900 | 1.65 | 0.69 | 21.63 | 0.08 | 0.61 | |||||||
| 40973 | 34.57127 | 1.68 | 0.72 | 21.89 | 0.05 | 0.61 | |||||||
| 38582 | 34.57168 | 1.71 | 0.61 | 21.81 | 0.36 | 0.61 | |||||||
| 40928 | 34.57100 | 1.68 | 0.48 | 24.12 | 0.51 | 0.62 | |||||||
| 39097 | 34.56828 | 1.65 | 0.41 | 24.34 | 0.59 | 0.64 | |||||||
| 37794 | 34.57487 | 1.85 | 0.31 | 23.41 | 0.37 | 0.66 | |||||||
| 42331 | 34.59231 | 1.72 | 0.53 | 22.90 | 0.56 | 0.68 | |||||||
| 37856 | 34.57019 | 1.81 | 0.35 | 23.19 | 0.66 | 0.76 | |||||||
| 41989 | 34.57235 | 1.69 | 0.50 | 23.15 | 0.49 | 0.78 | |||||||
| 38691 | 34.56440 | 1.68 | 0.32 | 23.79 | 0.75 | 0.79 | |||||||
| 42585 | 34.57853 | 1.77 | 0.42 | 23.21 | 0.36 | 0.81 | |||||||
| 42623 | 34.57957 | 1.74 | 0.44 | 23.79 | 0.73 | 0.83 | |||||||
| 42925 | 34.59246 | 1.51 | 0.32 | 23.50 | 0.37 | 0.86 | |||||||
| 37268 | 34.56874 | 1.63 | 0.45 | 23.14 | 0.50 | 0.90 |
Note. — A portion of the table is shown here. (1) Object ID, (2) right ascension (J2000), (3) declination (J2000), (4) photometric redshift, (5) integrated photometric redshift probability distribution function, see § 2.2, (6) Suprime , UKIDSS color, (7) UKIDSS , Spitzer/IRAC 3.6 µm color, (8) WFC3 F125 magnitude measured from GALFIT, (9) circularized effective radius, (10) Sérsic index, (11) ellipticity, , (12) stellar mass and (13) star formation rate from analysis of spectral energy distribution, (14) projected distance from center of the cluster XMM–LSS J02182-05102.