The 2008 outburst of EX Lup - Silicate crystals in motion
Abstract
EX Lup is the prototype of the EXor class of eruptive young stars. These objects show optical outbursts which are thought to be related to runaway accretion onto the star. In a previous study we observed in-situ crystal formation in the disk of EX Lup during its latest outburst in 2008, making the object an ideal laboratory to investigate circumstellar crystal formation and transport. This outburst was monitored by a campaign of ground-based and Spitzer Space Telescope observations. Here we modeled the spectral energy distribution of EX Lup in the outburst from optical to millimeter wavelengths with a 2D radiative transfer code. Our results showed that the shape of the SED at optical wavelengths was more consistent with a single temperature blackbody than a temperature distribution. We also found that this single temperature component emitted 80–100 % of the total accretion luminosity. We concluded that a thermal instability, the most widely accepted model of EXor outbursts, was likely not the triggering mechanism of the 2008 outburst of EX Lup. Our mid-infrared Spitzer spectra revealed that the strength of all crystalline bands between 8 and 30 µm increased right after the end of the outburst. Six months later, however, the crystallinity in the 10 µm silicate feature complex decreased. Our modeling of the mid-infrared spectral evolution of EX Lup showed that, although vertical mixing should be stronger during the outburst than in the quiescent phase, fast radial transport of crystals (e.g., by stellar/disk wind) was required to reproduce the observed mid-infrared spectra.
1 Introduction
The EXor class of young eruptive stars, named after the prototype EX Lup, was established on the basis of the peculiar optical behaviour of these sources (Herbig, 1977). EXors are known to show repetitive optical brightenings separated by faint quiescent periods. Typical time-scales of the bright states range from several months to few years. The time between two subsequent outbursts is typically several years. During the outbursts the brightness of the source increases by 2–5 mag in the V-band. In the quiescent phase the optical spectra of these stars resemble that of typical low-mass T Tauri stars with a spectral type of late K to early M. In the bright state, however, the optical spectra are dominated by broad emission lines usually seen in very early-type stars (Herbig, 2008). The excess emission above the stellar photosphere at infrared wavelengths is also a characteristics of the class which is attributed to a protoplanetary accretion disk (Hartmann & Kenyon, 1996).
In general, optical outbursts of EXors are thought to be related to runaway accretion from the disk onto the young star (Hartmann & Kenyon, 1996). This scenario is supported by observations of accretion tracers (e.g. spectral lines, veiling) which indicate higher mass accretion rate in the high phase compared to the quiescent periods (e.g. Lorenzetti et al. 2007). Little is known, however, on the details of the mechanism(s) leading to the increase of the accretion rate. It is generally believed that EXor outbursts are caused by the same kind of disk instabilities as those driving the eruptions in FU Ori type objects (EXors are sometimes also called sub-FUors) (Herbig, 2008).
FUor and EXor outbursts can also play an important role in the thermal processing of protoplanetary dust. During outbursts, the enhanced accretion and irradiation luminosity in the central regions of the system should lead to a strong increase of the dust temperature in the disk. Wherever the temperature exceeds a threshold value, the initially amorphous silicate grains crystallize rapidly. Crystalline silicates are not present in the interstellar medium (Kemper et al., 2005), from where the dust content of protoplanetary disks originates. Sharp features of silicate crystals at mid-infrared wavelengths are, however, frequently observed towards young stars with various spectral types (e.g., van Boekel et al. (2005); Bouwman et al. (2008); Watson et al. (2009); Meeus et al. (2009) or see, Henning & Meeus (2010) for a review), as well as solar system comets (e.g., Wooden et al. (2007) and references therein). Although these observations provide evidence for crystal formation in protoplanetary disks, the process itself was not actually observed until Ábrahám et al. (2009) reported the first observation of in-situ crystal formation in its recent outburst of EX Lup.
Crystalline silicates are also observed in the cold (T300 K) outer disk, where the temperature is too low for crystallization (e.g., Bouwman et al. 2008; Watson et al. 2009; Meeus et al. 2009). Cometary bodies, which can contain high abundance of crystalline silicates, are also formed in this cold part of protoplanetary disks. An important question is whether crystals were formed in situ in the outer disk (e.g. Desch et al. 2005) or were formed in the central region of the system at high temperature and subsequently transported outwards (e.g. Gail 2004). In the lack of time-resolved observations it is hard to distinguish between the two scenarios. In the case of EX Lup, however, we know that the crystals are formed in the hot (T K) inner regions of the system (Ábrahám et al., 2009). Thus, the recent outburst of EX Lup provides the unique opportunity to use the silicate crystals to trace the transport mechanisms in the disk of EX Lup.
EX Lup is a young (3 Myr) low-mass (0.6 M⊙) M0 star (Gras-Velázquez & Ray, 2005) located in the Lupus cloud complex. In the 1950s, EX Lup had a large outburst (5 mag), but only smaller amplitude brightenings, separated by few years of quiescent periods, were observed ever since. EX Lup has an infrared excess above the stellar photosphere longwards of about 2 µm, which originates in a protoplanetary disk. So far no evidence for an envelope has been found and indeed Sipos et al. (2009) successfully modeled the quiescent SED of EX Lup using a protoplanetary disk model only. Apart from a large inner hole in the dust disk, no other observational difference has been found which would distinguish EX Lup from other T Tauri stars. The 2008 outburst of EX Lup was observed with various ground-based instruments as well as with the Spitzer Space Telescope. In this paper we analyze these data in order to constrain dust processing and the outburst mechanism.
2 Observations
In our observation campaign we used a variety of ground- and space-based telescopes/instruments. We attempted to collect as co-temporary measurements as possible to build the SED of EX Lup in the outburst. In the following we will describe the details of the data reduction for each used instrument, while the log of our observations as well as the resulting flux densities are listed in Tab. 1.
2.1 Optical light curve
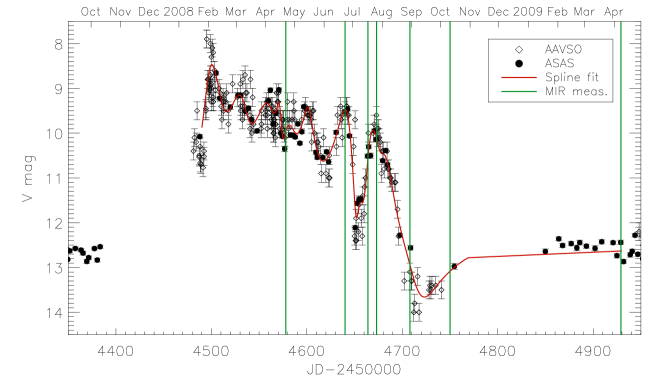
The optical brightness variations during the course of the outburst were monitored by amateur and professional astronomers. We collected visual brightness estimations from Albert Jones, the AAVSO111www.aavso.org database and V-band CCD observations from the ASAS-3 database (Pojmanski, 2002). For the visual magnitude estimation we used an uncertainty of 0.3 mag, which was the average difference between EX Lup and the comparison stars. From the ASAS-3 database we used only the highest quality measurements (quality flag ’A’), for which the uncertainty of the measured V-band magnitude was less than 0.1 mag. The optical light curve is bpresented in Fig. 1.
2.2 GROND
We observed EX Lup with the Gamma-Ray Burst Optical and Near Infrared Detector (GROND), which is a 7-channel simultaneous optical-infrared imager at the ESO 2.2 m telescope, on 20 April 2008. Optical images, covering a field of view of , were obtained in the bands. The total observing sequenced consisted of 4 dithered exposures with 1 s integration time. At near-infrared wavelengths (JHKS) images were obtained in 4 (JH) or 24 (KS) dither positions, with a total of 40 sec exposure time. The field-of view was . The optical images were reduced with standard IRAF tasks, and the final magnitudes were determined with aperture photometry and adopting the nominal zeropoint of each optical band from (Greiner et al., 2008). Near-IR magnitudes were determined by averaging the photometric zeropoints derived for several stars in the field using the 2MASS catalog. Because the near-infrared images were defocused, a large aperture was adopted in order to include all flux. The estimated photometric accuracy is 2.5, 2.5 and 5% in the J, H, and KS band, respectively, while in the optical the uncertainty is significantly larger (15 %) due to the lack of dedicated calibration measurements.
2.3 WFI
EX Lup was observed with the Wide Field Imager (WFI) on the 2.2m telescope in La Silla on 20 April 2008, with about one hour difference with respect to the GROND observations. The field of view of WFI spans 3334′ with small holes between the 8 CCD detectors. EX Lup was observed using standard Johnson UBV filters. A total of 3 exposures were taken with each filter, with individual exposure times of 4 s for U and 0.5 s for BV. The data was reduced using standard IRAF procedures.
The photometry was done as standard aperture photometry with a 15 pixel aperture. The calibration and aperture corrections were obtained from observations of the Landolt fields SA107 and SA110 (Landolt 1992) observed at 6 different airmasses, resulting in zeropoint errors 0.01 mag.
Optical photometries corrected for emission line contamination are also listed in Tab. 1. Correction was done by convolving optical spectra (Sicilia-Aguilar et al., in prep) with the WFI and the GROND filter curves and calculating the ratio of the total observed emission over the continuum. The emission line corrected photometries were used during the SED fitting, since our model did not include optical emission lines.
2.4 NTT SOFI
EX Lup was observed on 20 April 2008 using SOFI at the ESO 3.5 m New Technology Telescope (NTT). We obtained near infrared images using the narrow band filters NB1.215, NB1.71 and NB2.195. The observations were performed using the template img_obs_AutoJitter, taking five offsets, and repeating the exposure several times at each jitter position. The high brightness of the target prevents to use commom broad band filters. Individual frames were taken using the minimum possible exposure time of 1.2s. The total exposure time per filter was 30s in all cases. The data were reduced using the SOFI pipeline provided by ESO together with the Gasgano file manager. Photometric calibration was obtained by comparison with field of view stars included in the 2MASS catalog. The zero points were derived using between 6 to 8 stars with accurate 2MASS magnitudes, the standard deviation was about 0.03 mag in all cases.
In addition, SOFI was used to obtain a spectrum using the high resolution grism covering the K band with a slit width of 1”. A total exposure time of 560 s was dedicated to the EX Lup spectrum, split into 8 individual frames of 70s each. A close solar type star (HIP78466) was observed to correct for telluric absorption. The data were also reduced using the SOFI pipeline.
The SOFI and the GROND near-infrared photometries agree with each other within the uncertainties in the H and K bands. In the J band the difference is about 3.8 , which indicate real difference, however with low significance. Such difference can be caused by short time-scale (several hours) low amplitude intrinsic photometric variability.
The total spectral line contamination in EXors is usually weaker at near-infrared wavelengths compared to the optical (see also e.g. Lorenzetti et al. 2007). To verify this in the case of EX Lup we used the SOFI K-band spectrum for the NB2.195 filter. Since for the remaining two filters we did not have simultaneous spectroscopic data we used the spectra from (Kóspál et al., 2011) for the NB1.71 and NB1.215 filters, respectively. Although the data in (Kóspál et al., 2011) were taken three months later than our photometry, the optical brightness of the source was about the same at both epochs and we assumed that the strength of the line emission was also similar on these dates. Since the observed line contamination was less than 1% in all three filters, which is significantly less than the photometric accuracy, we did not correct the photometries for line contamination.
2.5 SPITZER IRS
EX Lup was observed with the Infrared Spectrograph (IRS; Houck et al. 2004) onboard the Spitzer Space Telescope at four epochs; 18 March 2005 (PID: 3716), 21 April 2008 (PID: 477), 10 October 2008 (PID: 524) and 7 April 2009 (PID: 524). The data of the first two epochs were published in Ábrahám et al. (2009) and we refer to that paper for the details of the data reduction procedure of those spectra.
At the last two epochs EX Lup was measured using only the low-resolution modules (R=60-120). Our spectra are based on the droopres products processed through the S15.3.0 version of the Spitzer data pipeline. First, the background has been subtracted using associated pairs of imaged spectra from the two nod positions, also eliminating stray light contamination and anomalous dark currents. Pixels flagged by the data pipeline as being ”bad” were replaced with a value interpolated from an 8 pixel perimeter surrounding the flagged pixel. The spectra were extracted using a 6.0 pixel and 5.0 pixel fixed-width aperture in the spatial dimension for the Short Low and the Long Low modules, respectively. The low-level fringing at wavelengths 20 µm was removed using the irsfringe package (Lahuis & Boogert, 2003). The spectra were calibrated with a spectral response function derived from IRS spectra and MARCS stellar models for a suite of calibrators provided by the Spitzer Science Centre. To remove any effect of pointing offsets, we matched orders based on the point spread function of the IRS instrument, correcting for possible flux losses.
2.6 SPITZER MIPS
We obtained photometry at 70 µm and a low resolution spectrum of EX Lup, using the Multiband Imaging Photometer for Spitzer (MIPS; Rieke et al. 2004). The 70 µm imaging was performed in photometry mode. The data reduction was started with the Basic Calibrated Data (BCD) products generated by the pipeline (version S17.2) developed at the Spitzer Science Center. We performed column spatial filtering and time median filtering on the BCD images following Gordon et al. (2007). The filtered BCD data were coadded and corrected for array distortions with the SSC MOPEX (MOsaicking and Point source Extraction, Makovoz & Marleau 2005) software. Outlier pixels were rejected using a 3 clipping threshold. The output mosaic was resampled to 4″pixel-1.
We used a modified version of the IDLPHOT routines to detect the source on the final image and to obtain aperture photometry with an aperture radius of 16″ and with sky annulus between 18″ and 39″. The aperture correction, appropriate for a 60 K blackbody, was taken from Gordon et al. (2007). The final uncertainties were computed by quadratically adding the internal error and the absolute calibration uncertainty for which we adopted 7% (see MIPS Data Handbook).
The low-resolution far-IR (55–95m; R 15–25 ) spectrum of EX Lup was obtained in the spectral energy distribution (SED) mode of MIPS. Six observing cycles were performed, each consisting of 10 s long on- and off-source exposures. The on-source and the background positions were separated by 1″. We began our data reduction with the BCD images (pipeline version S17.2) and MOPEX was used to perform further processing steps (combination of data, background removal, application of the dispersion solution). The spectrum was extracted in an 5 pixel wide aperture. The aperture correction factors were taken from Lu et al. (2008).
2.7 VLTI MIDI
EX Lup was observed with MIDI (Leinert et al., 2003), the N-band instrument on the VLTI interferometer (Glindemann et al., 2000). Spectrally resolved interferometric visibilities were obtained between 8 and 13 m with a spectral resolution of 35. Observations were performed at two epochs, during the nights starting 21 June 2008 (baseline U2U3, projected length 37.4 m, position angle 57.6∘ E of N) and 16 July 2008 (baseline U1U4, projected length 121.1 m, position angle 73.4∘ E of N). Data were obtained in ”high sense” mode, i.e. each interferometric observation in which the beams coming from both telescopes are combined coherently is followed by photometric observations in which first only the light coming from telescope A, then from telescope B, is measured, and the intensities of the individual beams are determined.
Calibration stars were observed to determine the system response and atmospheric transparency. During the night of 21 June 2008 the calibrator HD 149447 (K6III, =4.680.05 mas, Cohen et al. 1999) was observed immediately following the EX Lup observation. During the night of 16 July 2008 the same calibrator was observed immediately before and after the EX Lup observations. We used the EWS package to reduce the data, and verified that reductions using MIA yield consistent results.
2.8 VLT VISIR
Low-resolution (R250) N-band spectroscopy of EX Lup was performed with VISIR at the VLT. We observed the source during two epochs, first around 25 July 2008 (for which data from the nights of the 24, 25, and 27 of July were combined), and second in the night of 28 August 2008. Standard chopping and nodding techniques were applied to correct for the high celestial and instrumental background inherent to mid-IR observations.
During the July observations, HD 149447 was observed as telluric and flux calibrator immediately following each observation of EX Lup, at essentially identical airmass. During the observations in August we used HD 196171. Both calibrators are taken from the catalogue of Cohen et al. (1999), that provides spectral types and angular diameters for each star, which we used to compute Kurucz model spectra to calibrate the absolute flux levels.
2.9 APEX LABOCA
EX Lup was observed at 870µm using the 295-element LABOCA (Large Apex Bolometer Camera, Siringo et al. 2009) on the 12-m APEX radio telescope (Atacama Pathfinder Experiment, Güsten et al. 2006). The observation was performed on 21th of April 2008 in continuous integration mode using a spiral pattern. This observing mode provides a fully sampled map of the total field-of-view of LABOCA. The total on-source observing time was 2.2 h. The data processing was performed by the Bolometer array Analysis Software (BoA) package following the data reduction steps (correction for the atmospheric opacity, flux calibration, removal of correlated noise using an iterative method, removal of spikes) outlined in the BoA User Manual (version 3.1). For the flux calibration we used the sources IRAS16293, B13134, G34.3.The co-added final map had pixels with sizes of 6″. Aperture photometry was used to extract flux from the map using the position of EX Lup.
3 Results
3.1 Light curve
The brightest ever recorded outburst of EX Lup was announced in February 2008 (Jones, 2008). The light curve, composed from visual estimations and V-band observations, is presented in Fig. 1. Unfortunately the beginning of the outburst was not observed, one can only extrapolate for the starting date. The last optical measurement (ASAS) in the quiescent phase was on 10th Oct 2007 (110 days before the peak brightness), when brightness was V=12.7 mag. We estimated the total length of the outburst to be about 300 days, which is an average value within the class.
The brightness of EX Lup at the peak of the outburst was about V=8 mag. Taking the quiescent brightness to be V mag (Sipos et al., 2009) one gets a V-band amplitude of 5 mag for the outburst. With this value, the 2008 outburst of EX Lup belongs to the strongest ones observed in EXors. This is an unusually high value compared also to the historical record of EX Lup. The only comparable outburst was observed in the 1950s.
The shape of the light curve during the 2008 outburst of EX Lup showed some peculiar features. The observations began about three weeks before the peak of the outburst. The brightness of the source rose steeply until it achieved a peak brightness of V=8 mag. The star remained this bright only for a few days, then it faded to about 9.5 mag. Then the average brightness decreased by another 2 mag in the next 200 days. One of the most interesting properties of the light curve was the quasi-periodic brightness variation seen on top of the plateau-like slow fading. The amplitude of these fluctuations increased with time, while their period remained roughly constant, about 35 days.
3.2 Spectral Energy Distribution
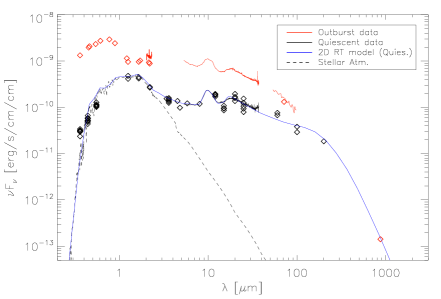
The SEDs of EX Lup on 21 April 2008 and in the quiescent phase are compared in Fig. 2. The outburst-to-quiescent flux ratio was the highest in the U-band and it decreased gradually with wavelength. Although EX Lup was already fainter on 21 Apr 2008 than at the peak of the outburst, at optical wavelengths it was still more than an order of magnitude brighter in the outburst compared to the quiescent phase. The shape of the SED in the optical domain is consistent with blackbody emission at K, which is far higher than the effective temperature of the star in quiescent phase (3800 K, Gras-Velázquez & Ray 2005). Although the absolute flux levels in the GROND i and z filters are somewhat higher than what would be expected for the aforementioned blackbody emission, the i-z color fits well to the modeled emission. The discrepancy in the absolute flux level can be explained by the relatively high calibration uncertainty in the GROND optical bands. In the near-infrared domain the flux increased only by a factor of about 2.5 in the outburst compared to the quiescent phase. Moving to longer wavelengths the ratio of the outburst-to-quiescent fluxes increased again to about an order of magnitude at 5.5 µm, which is the shortest wavelength of the Spitzer IRS spectra. Longwards of 5.5 µm the ratio of outburst-to-quiescent fluxes decreased with wavelength.
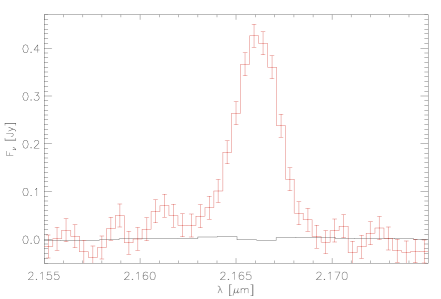
The brightening was certainly caused by the increased accretion rate onto the star during the outburst, indicated by the increasing luminosity in the accretion indicator lines. In Fig. 3 we compare the spectral region around the Br line in the outburst and in the quiescent phase from Sipos et al. (2009). It can be seen that the luminosity of the Br was far higher in the outburst than in the quiescent phase. Using the relationship of Muzerolle et al. (1998) we derived an accretion rate of M⊙/yr in the outburst222Note, that the hydrogen recombination lines are not only indicators for accretion, but also mass loss. Therefore, the derived accretion rates should be considered as upper limit. This is about three orders of magnitude higher than the value in the quiescent phase found by Sipos et al. (2009). We want to note, that different lines were used to derive the accretion rate in the outburst (Br ) and in the quiescent (Pa ), since none of the accretion indicator lines were measured both in the quiescent and in the outburst. The usage of different accretion indicators might introduce some additional uncertainty when a comparison of the accretion in the outburst and in the quiescent is done. This uncertainty, however, does not affect our conclusion that the 2008 brightening of EX Lup was certainly caused by the increased accretion rate onto the star during the outburst, indicated by the increasing luminosity in the accretion indicator lines.
3.3 Mid-infrared spectra
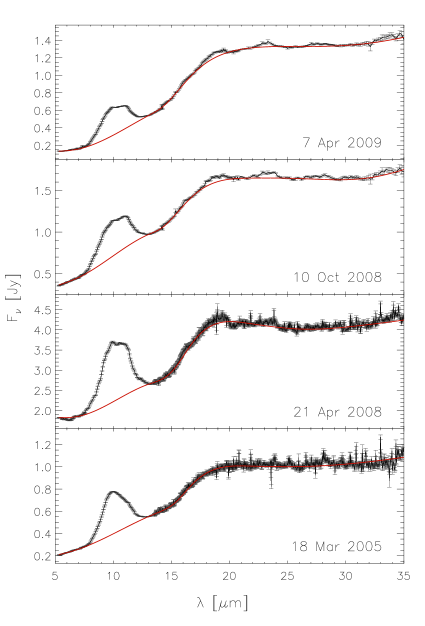
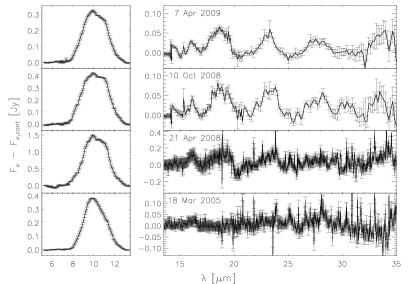
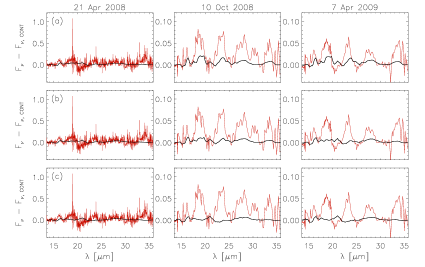
In this section we will describe the mid-infrared spectra measured towards EX Lup in our observing campaign. In order to avoid confusion, we will use the following naming convention. The ensemble of features between 8 and 13 µm will be called the ”10 µm feature complex”. The ”10 µm feature” term will be used for the forsterite band peaking at 9.9 µm. The Spitzer IRS spectra of EX Lup are presented in Fig. 4. In order to show also the weaker dust features, a spline continuum was fitted to and then subtracted from each spectrum. The continuum subtracted spectra are shown in Fig. 5.
The pre-outburst spectrum from March 2005 was already analyzed by Sipos et al. (2009). They showed that the dust in the disk atmosphere of EX Lup is dominated by small amorphous grains with a mass-weighted average grain size of 0.5 µm. They also showed that the abundance of crystalline silicates in the disk atmosphere is negligible.
The Spitzer IRS spectrum from the outburst, taken on 21 April 2008, showed remarkable changes. First of all, the absolute flux level increased by about an order of magnitude at the shortest wavelength of the spectra (5.5 µm) and by about a factor of five at the longest wavelength (35 µm). The amount of brightening decreased with wavelength shortwards of about 20 µm, but it was completely wavelength independent longwards of 20 µm. As reported by Ábrahám et al. (2009) the spectrum showed a small, but narrow and sharp feature at 10 µm on top of the 10 µm feature complex (see Fig. 5). A shoulder at 11.2 µm and another feature at 16 µm also appeared in the outburst spectrum which were not present in the pre-outburst spectrum. Ábrahám et al. (2009) identified the source of these new bands as crystalline forsterite. It was also reported that no crystalline feature was seen in the outburst spectrum longwards of 20 µm.
The third Spitzer IRS spectrum, taken on 10 October after the end of the outburst, showed further changes. As can be seen in Fig. 4, the absolute flux level decreased compared to the outburst spectrum. The flux level was still higher than in the quiescent spectrum by about a factor of 1.7, but this factor was wavelength independent in the whole Spitzer IRS wavelength domain. The shape of the spectral features between April 2008 and October 2008 also changed. In Fig. 5 it can be seen that the 10 micron feature complex became broader and the 11.2 µm shoulder became stronger, relative to the underlying broad amorphous feature, in October compared to the April spectrum. The most remarkable changes occured, however, at longer wavelengths. Apart from the narrow 16 µm band of forsterite, new bands appeared in the October 2008 spectrum at approximately 23 µm, 28 µm and 33 µm. These wavelengths correspond to the peak wavelengths of the strongest forsterite bands in this wavelength interval (see e.g. Koike et al. 2003 for a list of forsterite band positions). Thus we identified the source of these bands to be crystalline forsterite.
The last Spitzer IRS spectrum was taken on 7 April 2009. The absolute flux level decreased further compared to the first post-outburst spectrum from about five months earlier. Longwards of 20 µm the flux decrease was independent of the the wavelength. The flux variation showed, however, clear wavelength dependence shortwards of approximately 20 µm, where the brightness decreased the most. The flux at 5.5 µm decreased to about half of the pre-outburst value, while longwards of 20 µm the flux in the last IRS spectrum was approximately 30 % above the pre-outburst value. The shape of the spectral features longwards of 13 µm remained unchanged within the uncertainties (see Fig. 5), while the 10 µm silicate feature complex clearly changed compared to the previous epoch. It can be seen in Fig. 5, that the 10 m forsterite feature on top of the broad amorphous feature was still present, but the shoulder at 11.2 µm became much weaker in April 2009 than it was in October 2008. The general shape of the 10 µm feature seems to be somewhere between the outburst and pre-outburst spectra.
Due to the difference in the noise levels between the outburst and the post-outburst spectra, we cannot exclude the possibility from the Spitzer IRS spectra alone that weak crystalline features (of the same strength as in the post outburst spectra) longwards of 20um were already present in the outburst spectrum. In the post-outburst spectra the peak of the 24 and 28 um features is 9 and 6 times the corresponding flux uncertainty above the underlying continuum, respectively. The absolute noise level of the outburst spectrum is, however, worse than the post outburst spectra by a factor of about 3.4. If we measured the post-outburst spectra with the same noise level as we had in the outburst spectrum, the detection of the 24 and 28 um features would be about 2.6 and 1.8 times the corresponding flux uncertainty, respectively, i.e. they could be hidden by the noise. We will further discuss this question in Sec. 4.2.1
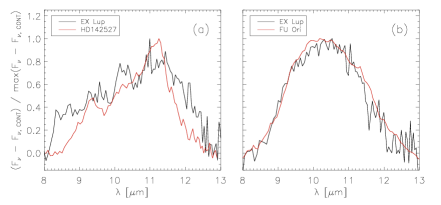
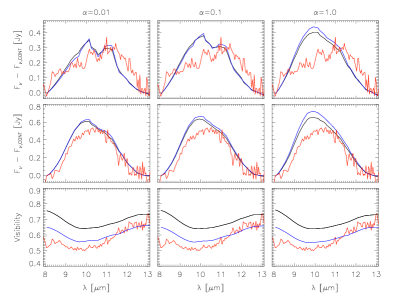
In the Spitzer IRS spectra, the disk of EX Lup remains unresolved allowing us to investigate the integrated spectrum of the disk as a whole only. To obtain information about the spatial distribution of the newly formed crystals we used MIDI on the VLTI. In our first measurement in the U2U3 configuration (22 Jun 2008) with a projected baseline length of 37.4 m EX Lup remained spatially unresolved. The second measurement in the U1U4 configuration on 16 July 2008 (projected baseline length 121.2 m), however, resolved the source. In the following we will use the naming convention of van Boekel et al. (2004) and we will refer to the correlated spectrum as ”inner disk spectrum”. We also subtracted the correlated spectrum from the total spectrum and the resulting uncorrelated emission will be called the ”outer disk spectrum”. In Fig. 6 Left we present the inner disk spectrum of EX Lup. The spectrum peaks at 11.3 µm which corresponds to the wavelength of the strongest forsterite peak in the 8–13 µm region. The inner disk spectrum of EX Lup resembles that of HD 142527 which is known to originate in regions with crystallinity (van Boekel et al., 2004), suggesting also very high crystallinity in the EX Lup inner disk spectrum. The outer disk spectrum of EX Lup is shown in Fig. 6 Right. It is broader compared to the pre-outburst total spectrum and peaks at about 10.2 µm. The feature is smooth and lacks any substructure, which would be the signature of crystalline silicates. Interestingly, the outer disk spectrum of EX Lup is very similar to the 10 µm feature complex of FU Ori (Quanz et al., 2007). Quanz et al. (2007) have shown that the 10 µm feature of FU Ori is known to emerge from a region where significant grain growth has taken place, indicating also the presence of large (few µm) grains in the outer disk atmosphere of EX Lup.
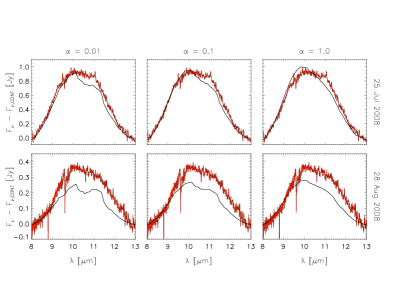
Two spatially unresolved spectra were taken with the VISIR instrument on VLT on 25 Jul 2008 and on 28 Aug 2008 (see Fig. 11). Although the VISIR spectra have better signal-to-noise ratio than those taken by the MIDI instrument, the quality of the spectra is not as good as that of Spitzer IRS, allowing only moderate analysis of the spectral features. In July 2008, at the epoch of the first VISIR measurement the source was at about the same brightness level as in Apr 2008, when the outburst Spitzer IRS spectra was taken. The absolute flux level of the two spectra agrees well with each other, but the peak-to-continuum ratio is lower in the VISIR spectrum than than in the Spitzer IRS (1.6 vs. 1.4). The 10 µm feature complex seems to be broader in the VISIR spectrum, too. The broader and shallower features are usually interpreted as indication for the presence of larger, micron-sized grains. Similar to the MIDI data the VISIR spectrum points towards the presence of large grains, too. The Aug 2008 VISIR spectrum was taken at about the same optical brightness level as the first Spitzer IRS post-spectrum. Due to the lower signal-to-noise ratio of the VISIR spectrum no significant difference can be found in the shape or the strength of the Spitzer and VISIR spectra above the noise level.
4 Discussion
4.1 Crystal formation
Ábrahám et al. (2009) reported the in situ formation of forsterite crystals via annealing in the disk atmosphere of EX Lup during its 2008 outburst. The crystalline features we found in the 20–35 µm wavelength interval are also associated with crystalline forsterite, supporting the conclusion of Ábrahám et al. (2009). It is interesting that no features of other crystalline dust species, apart from forsterite, can be seen in the mid-infrared spectra. For instance, enstatite (the magnesium-end member of the pyroxene solid solution series), which is frequently observed in protoplanetary disks (see e.g., van Boekel et al. 2005, Watson et al. 2009, Juhász et al. 2010), is not present in the spectra of EX Lup. Laboratory annealing experiments of amorphous silicates show that forsterite will form independently of the starting stoichiometry if the grains are small () and porous (Fabian et al., 2000). For larger (few µm) and compact particles, annealing of amorphous grains with pyroxene stoichiometry results in the formation of enstatite. Using the activation energies from (Fabian et al., 2000) the annealing time of enstatite in the 1000-1300 K temperature interval is about an order of magnitude longer than that of forsterite, but it decreases rapidly with increasing temperature. At 1200 K the calculated annealing time of enstatite is on the order of a minute. It is unlikely that dust grains in the outburst are heated up to 1200 K then cooled down below 1000 K on a one-minute time-scale to prevent the formation of enstatite. The only possibility for the formation of forsterite without enstatite production is that the parent amorphous grains were sub-micron sized porous grains. Indeed, the analysis of the Spitzer IRS spectrum of EX Lup from the quiescent phase show the presence of amorhphous grains with a mass-averaged grain size of 0.5 µm (Sipos et al., 2009).
All crystalline silicate features, so far identified in protoplanetary disks, were associated with iron-poor, magnesium rich crystals (see e.g. van Boekel et al. 2005; Bouwman et al. 2008; Sargent et al. 2009 or Henning & Meeus 2006 for a review). An important consequence of the absence of iron is the dramatic decrease of the optical and near-infrared opacity of the grains. Iron-poor silicates are, therefore, cooler than ferromagnesian silicates at the same distance from the central star. Comparing the positions of the observed forterite features in the spectrum of EX Lup with those of synthetic and natural olivines from Koike et al. (2003), we estimated the iron content of the lattice to be less than 10 % with respect to magnesium. Such iron-poor crystals can be formed from iron-poor amorphous silicates, but also from ferromagnesian silicates if the annealing occurred under reducing conditions. Laboratory experiments showed that in the latter case the reduced iron will remain in thermal contact with the resulting crystals in the form of metallic inclusions (Davoisne et al., 2006). Such iron inclusions do not affect the positions of the forsterite bands while the grain as a whole will have higher optical to near-infrared opacity than that of isolated, pure forsterite crystals (see e.g. Ossenkopf et al. 1992).
Besides iron, amorphous carbon is the other important opacity source in protoplanetary disks. Carbon, as well as iron, has a featureless opacity curve and high optical to near-infrared opacity (Jaeger et al., 1998). Sipos et al. (2009) used amorphous carbon (20 % in terms of the total dust mass) in their radiative transfer modeling of the quiescent phase SED of EX Lup. Amorphous carbon, however, is not stable above 1000 K as it oxidizes quickly and forms CO (Gail, 2001). Since annealing is expected to occur above 1000 K, we do not expect amorphous carbon to be in thermal contact with silicate crystals.
Based on the above constraints, we propose two scenarios to be tested for the formation of forsterite crystals in the disk of EX Lup. In scenario A the parent grains were porous ferromagnesian silicates in thermal contact with carbon. As the outburst set in and the temperature rose above 1000 K, the silicate grains crystallized. The formation of CO from amorphous carbon lowered the partial pressure of oxygen providing reducing conditions under which iron-poor crystals can form from ferromagnesian silicates. To explain the observed variations of the strength of forsterite features an additional mechanism, e.g. radial/vertical mixing is required.
In scenario B the parent amorphous silicate grains were iron-poor sub-micron sized porous grains in thermal contact with carbon. As the temperature rose above 1000 K at the beginning of the outburst, the silicate grains were annealed to crystalline forsterite, while the amorphous carbon oxidized and formed CO. Due to the low opacity of the crystals (in the absence of carbon) their temperature decreased. This resulted in the weakening of the forsterite features in the 10 µm region while in the same time the features in the 20–35 µm region became stronger, which might explain the observed spectral variations.
4.2 Modelling
We modeled the SED, the mid-infrared spectra and the interferometric visibilities simultaneously using the 2D radiative transfer (RT) code RADMC (Dullemond & Dominik, 2004a) and a 1+1D turbulent mixing code (Dullemond & Dominik, 2004b). The goal of our modeling was to find answers to the following three questions. Are the freshly produced crystals isolated iron-free particles or are they in thermal contact with iron? Which physical process was responsible for the observed variation of the mid-infrared solid-state features? What kind of constraints can we put on the mechanism of the outburst? We calculated, therefore, seven series of models to simulate the two crystal formation scenarios (series A-, and B-), with (-AD-) and without (-NAD-) an optically thick accretion disk and with different strength of the vertical turbulent mixing (-0.01, -0.1, -1.0). Details of the modeling procedure are described in Appendix A. We now briefly describe the modeling strategy in the different model series.
-
Series A-AD-1.0, A-AD-0.1, A-AD-0.01. First, we started with a disk containing only amorphous silicates and amorphous carbon. The parameters of the starting disk model were taken from Sipos et al. (2009) and are summarized in Tab. 2. The inner radius of the disk was taken to be 0.3 AU (instead of 0.2 AU as in Sipos et al. 2009) to get a better agreement between the model and the quiescent phase Spitzer IRS spectrum in the 5–10 µm wavelength interval. After the accretion rate has been set, we ran the RT code to obtain the temperature structure at the beginning of the outburst. Amorphous dust grains were replaced by forsterite grains with iron inclusions wherever the temperature in the disk exceeded 1000 K. Then the turbulent mixing code was run to simulate vertical mixing over a 10-day period. Turbulent mixing was treated as a diffusion process using the prescription (Shakura & Sunyaev 1973, see also Appendix A) for the diffusion coefficient. The strength of the turbulence was controlled via the value of , for which we used 0.01, 0.1 and 1.0. The last step was to update the density structure according to the results of the mixing code. The whole modeling cycle was then repeated. Accretion heating was simulated with an optically thick accretion disk as well as a hot spot on the stellar surface.
-
Series A-NAD-1.0, A-NAD-0.1, A-NAD-0.01. Same as the A-AD- models, but no accretion disk was present in the models. The total accretion luminosity was assumed to be radiated away from the hot spot.
-
Series B-AD. We started the modeling in the same way as in the A-AD- models. Amorphous dust grains were replaced with isolated iron-free forsterite crystals wherever the temperature in the disk exceeded 1000 K. Amorphous carbon was also removed from the dust phase above 1000 K. In this model series we did not use the vertical mixing code, we only updated the accretion rate and calculated models on each 10th day.
For the amorphous grains we applied the dust model of Sipos et al. (2009), which was used to model the quiescent phase SED. During the modeling we used two grain models for forsterite crystals. For isolated iron-free forsterite crystals we used mass absorption coefficients calculated from the optical constants using Distribution of Hollow Spheres (DHS, Min et al. 2003) scattering theory. We used the optical constants of Sogawa et al. (2006) longwards of 2 µm and supplemented them with that of Scott & Duley (1996) shortwards of 2 µm. For composite grains, where forsterite and iron are in thermal contact with each other, we calculated the optical constants of the aggregate from those of the constituents first, using effective medium theory (APMR mixing rule, Min et al. 2008). For the constituents of the aggregate we used the DHS polarizability. Finally Mie theory was applied to calculate the mass absorption coefficient of the aggregate. The same optical constants were used for forsterite and for the isolated crystals, while for iron we used the optical constants of Ordal et al. (1988) between 0.66 µm and 285 µm and extended it with the optical constants of Pollack et al. (1994) shortwards of 0.66 µm and longwards of 285 µm.
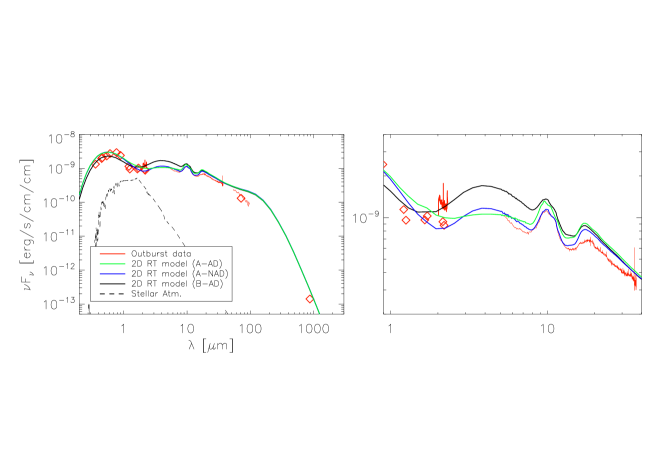
In Fig. 7 we compared the observed SED of EX Lup in the outburst to model calculations. Although our models reproduced the general shape of the observed SED, there were quantitative differences. The largest differences between our models and the observations occured in the 1–8 µm wavelength interval (A-AD models) and in longwards of 60 µm. The former is related to the presence or absence of an optically thick accretion disk inwards of 0.3 AU. We will discuss this problem in Sec. 4.2.2.
The most likely explanation why our models overestimated the observed fluxes longwards of 60 µm is that the disk of EX Lup was not in an equilibrium state. RADMC, as well as other RT codes used to model protoplanetary disks, calculates the temperature structure of the disk in radiative equilibrium. The emission longwards of 60 µm is dominated by the disk interior which is optically thick to the heating radiation of the star and the disk atmosphere above it. The high optical thickness prevents the disk interior to react to the variable irradiation luminosity quickly. Since the optical depth in the far-infrared to millimeter wavelengths is lower than at shorter wavelengths the observer can see deeper into the disk observing those regions, that are still not accommodated to the changed irradiation luminosity. The optically thin, upper layers of the disk can, however, react to the variable irradiation luminosity almost immediately.
4.2.1 Radial and vertical mixing of solids
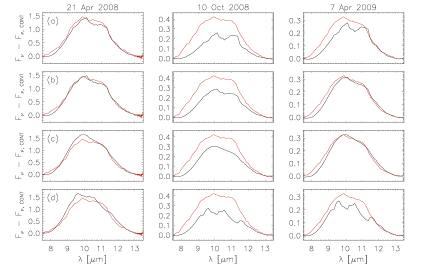
The first question we tried to answer with our modeling was which of the two crystal formation scenarios, outlined in Sec. 4.1, was at work in the disk of EX Lup. In Fig. 8 we compared the calculated mid-infrared spectra of models A-AD333The spectra of models A-AD and A-NAD are very similar to each other, therefore, to avoid confusion we show only the spectra of models A-AD. and B-AD. As can be seen in Fig. 8a-c, the positions of forsterite bands in the observed and modelled spectra matched very well in models A-AD. The strengths of the forsterite peaks are dependent, however, on the strength of the vertical mixing. The positions of the forsterite peaks in the B-AD models were shifted systematically towards shorter wavelengths compared to the observations (see Fig. 8d). The shift of the peak position was certainly related to temperature/radiative transfer effects since in the mass absorption coefficients there was no difference in the peak positions of isolated forsterite crystals and forsterite-iron aggregates. Moreover spectra of B-AD models showed also stronger forsterite features, especially in the post outburst epochs, compared to the observed spectra. Thus, our modeling suggests that the freshly produced forsterite crystals had to be in thermal contact with iron, which excludes scenario B as a crystal formation mechanism.
The next question we addressed was whether vertical mixing can explain the observed variation in the shape of the mid-infrared solid-state emission features. Without considering vertical mixing, the apparent crystallinity in spatially unresolved spectra depends on the ratio between the size of the crystallized region and the total (crystalline + amorphous) silicate emission zone seen at 10 µm. The former depends on the irradiation luminosity at the peak of the outburst and does not change with time. The total silicate emission zone, however, scales linearly with the actual irradiation luminosity (see, e.g., Kessler-Silacci et al. 2007). If the irradiation decreases, the total silicate emission would shrink accordingly. Since the size of the crystalline region remains unchanged, the apparent crystallinity increases. So far we assumed that in the crystalline region the value of crystallinity is 1.0, i.e., every dust grain is in crystalline form and this does not change with time. The effect of vertical mixing is to decrease the crystallinity with time in the crystalline zone by stirring up amorphous grains from deeper layers of the disk and, at the same time, mixing down crystals. In this way vertical mixing might compensate the effect of the shrinking total silicate emission zone.
In Fig. 8a-c we compared the observed spectra in the 7.5–13.5 µm region with those of models A-AD with different values of . In our weakest mixing case (, Fig. 8a), our models predicted stronger forsterite features than observed. In contrast, models with the strongest possible mixing (, Fig. 8a), predicted too weak crystalline features compared to our observations. The best agreement between our models and the observed spectral features in the 7.5–13.5 µm was achieved using . The strength of the 10 µm feature complex is well reproduced for the outburst (Apr 2008) and the second post-outburst spectra (Apr 2009), but our model overestimates the feature strength compared to the spectrum taken in Oct 2008. The disagreement between the model and the observed spectra is about 35%. Since the emission at the 10 µm is optically thin it reacts to the changing irradiation immediately and the infrared radiation is proportional to the irradiation flux. This means that the 35% difference between our models and the observed flux level translates to a difference of 0.3 mag difference in the optical. Since we had no optical photometry at the time when the Spitzer IRS spectrum was taken, only a few days after, the difference could be caused by the extrapolation to the optical brightness used in our modeling. In Fig 9a-c we compared our models to the observed spectra in the 13.5–36 µm wavelength interval. Although our models with matched the observed spectra in the 7.5-13.5 µm region well, the observed forsterite features longwards of 20 µm are far stronger than in any of our models independently of the value of (see Fig. 9).
Two explanations could be used to solve the discrepancy between the observed and modeled crystalline features longwards of 20 . A solution could be that, in reality, the size of the crystallized region was higher than in our models. This can be due to a higher peak luminosity of EX Lup in the outburst or due to a lower crystallization temperature. In this case, the outburst spectrum could have contained some weak forsterite emission features longwards of 20 µm, which were hidden by the noise in the measured spectra. The uncorrelated MIDI spectrum, however, excludes this possibility. We tested this scenario with our 2D RT model. If the crystallized region is larger than about 1.5–1.8 AU, the calculated uncorrelated spectra of our models show strong forsterite bands, which are not observed in the MIDI spectra. Moreover, models which reproduced the strength of the forsterite features longwards of 20 µm in the spatially unresolved post-outburst spectra, overestimated the strength of the crystalline features in the 10 µm region. Using our modeling framework with vertical mixing, we were not able to reproduce the strength of the crystalline features both shortwards and longwards of 20 µm in the post-outburst spectra, and the spatially resolved mid-infrared interferometry simultaneously.
The other explanation would be that forsterite crystals were not present in the disk atmosphere outwards of 1.5–1.8 AU in July 2008, but they were transported to a few AU by October 2008. The transport of crystals over a 2 AU distance within three months implies an average radial velocity of about 38 km/s. Radial mixing is far too slow for such a transport velocity. Instead, it is likely that in this scenario the crystals are transported by e.g. a wind driven transport mechanism. Indeed, optical and near-infrared spectroscopic observations suggest the presence of a wind during the outburst of EX Lup ( Aspin et al. 2010; Goto et al. 2011; Kóspál et al. 2011, Sicilia-Aguilar et al., in prep). The quantitative modeling of this scenario is, however, beyond the scope of this paper.
4.2.2 Outburst mechanism
EXor outbursts are usually considered to be a ’down-scaled’ version of FUor outbursts, suggesting the same triggering mechanism of the outbursts in the two classes (Hartmann & Kenyon, 1996). The most widely accepted model of FUor outbursts is the self-regulated thermal instability (TI, Bell & Lin 1994). Although being the most widely accepted model, even TI cannot explain all observational properties of FUors (see e.g. Zhu et al. 2007). In case of TI the released viscous energy in the disk midplane is trapped in the disk above a certain threshold surface density value. The radiative trapping is caused by the opacity of H- ions in the partially ionized disk regions. The effective viscosity as well as the mass transfer rate in the disk within the ionized radius increases. The ionization front propagates outwards in the disk up to a certain radius then retreats again. The gas inwards of the ionization front is accreted onto the central star.
In the following we will investigate the TI model in the context of our observations. TI requires an optically thick accretion disk (due to the presence of H- ions) which dominates the SED of FU Ori-type objects at optical and near infrared wavelengths (see e.g. Zhu et al. 2007). The comparison of our A-AD and A-NAD models to the observed SED of EX Lup showed that models without an optically thick accretion disk fit the SED better in the 1–8 µm wavelength range (Fig. 7). In order to quantify the goodness of the SED fit we calculated and compared the of the fit for all model series. The number of tuned parameters were only two, the value of (except for B-AD models) and whether or not an optically thick accretion disk was present within the inner hole of the dust disk.. The number of fitted data points were 1435. The values for the B-AD model was 3409. The A-AD-0.01, A-AD-0.1 and A-AD-1.0 models resulted in a of 1423, 1372,1290, respectively. Finally the A-NAD-0.01, A-NAD-0.1 and A-NAD-1.0 models provided a of 533, 470 and 492, respectively. It can be easily seen that the goodness of fit is very sensitive to the presence (or rather to the lack) of an optically thick accretion disk, while only marginal dependence is visible on the value of . Independently of the value of the viscosity parameter, the best fit model family is the A-NAD, while the absolute best fit model is A-NAD-0.1 Mid-infrared visibilities of models without an optically thick accretion disk gave also better agreement with the observations (see Fig. 10). This suggests that there was either no optically thick accretion disk present during the outburst of EX Lup, or the emission at optical wavelengths came from a narrow ring of hot gas in the inner edge of the gas disk.
One of the main differences between FUor and EXor outbursts is the time-scale over which the outburst occurs. The TI model alone, without any additional perturbation, is not able to reproduce the rise-time in the case of FU Ori and of V1515 Cygni (Clarke et al., 2005). In these cases the brightening happened over about a year, which is an order of magnitude longer than in the case of EX Lup (few weeks). The relatively short duration time of the outburst of EX Lup puts constraint also on the outer radius, from where gas can be accreted onto the star. The mass transfer in the disk occurs by viscous diffusion, the time-scale of which can be estimated using
| (1) |
where is the diffusion coefficient (), is the radius, is the pressure scale height of the gas and is the Kepler frequency. We used Eq. 1 to estimate the outer radius from which material can be accreted within 10 months. We assumed that and for we used the highest theoretically possible value, . The resulting radius is AU, which is well within the fitted inner radius of the dust disk (0.2–0.35 AU, Sipos et al. 2009). This implies that the reservoir of material for the 2008 outburst should have been present in the inner hole of the dust disk. This calculation implies that the hole in the disk, observed in the quiescent phase SED, should not be empty, but it is filled up with gas, which is optically thin in the continuum. On the other hand, if thermal instability takes place in the disk, the disk should be optically thick due to the presence of H- ions, which should be visible in the SED.
The mass of gas accreted onto the star during this outburst was about 10-7 M⊙, and the calculation above implies that all of this gas should be located within 0.12 AU from the central star. If we assume that such high amplitude outburst, like that in the 1950s or in 2008, consume all the available gas within 0.12 AU a mass transfer rate of M⊙/yr or higher is required to maintain the observed amplitude and frequency (one in every 50 years) of these large eruptions. The estimated mass transfer rate is a lower limit, as we neglected all the smaller amplitude outburst, which occurred since the 1950s, but it is more than an order of magnitude higher than what Sipos et al. (2009) estimated. The required mass transfer rate in the disk for TI to operate was found to be M⊙/yr or higher (Bell & Lin, 1994), which is far higher than the estimated accretion rate in the quiescent phase of EX Lup. If the outbursting region is fed with a lower rate, thermal instability does not occur, the accretion onto the star is stable and steady. The equilibrium curves calculated by Bell & Lin (1994) also suggests that between M⊙/yr and about M⊙/yr there is no stable solution for the accretion. If thermal instability sets in, the disk quickly flips to the outburst phase and the accretion rate increases to above M⊙/yr.
The mass transfer rate in the disk is, however, not necessarily the same as the accretion rate onto the star. The accretion rate onto the star can be lower than the mass transfer rate in the disk due to, e.g., interaction between the stellar magnetic field and the accreting gas (see, e.g., Romanova et al. 2002, 2004, D’Angelo et al. in prep), which causes the gas to pile up in the disk. The gas lines, used as accretion indicator, are formed in the funnel flow between the inner radius of the gas disk and the surface of the star (e.g. Muzerolle et al. 1998), therefore they only measure the accretion rate onto the star. Thus, the mass transfer rate in the disk can be significant even if the accretion rate derived from, e.g., the Br line is zero. In FUor outbursts, all gas piled up over 104 years (estimated time between two subsequent FUor outbursts) is accreted onto the star since the accretion onto the star is as high as M⊙/yr. In contrast, the accretion rate of EX Lup in the outburst was three orders of magnitude lower. If the mass transfer rate in the disk of EX Lup was M⊙/yr (required for the TI to operate), EXor outbursts cannot accrete all piled up mass from the disk onto the star. In this case gas accumulates continuously in the inner regions of the disk and at some points the system should go into a FUor-type outburst, meaning that EXors are in fact FUors in the ”quiescent” phase. Since EX Lup has a disk mass of 0.02 M⊙ and no evidence for a massive envelope has been found so far, the disk of EX Lup would be entirely consumed by only a very few FUor eruptions (assuming =10-4M⊙/yr and an outburst duration of 50 yr), which makes this scenario unlikely. Our study suggests that the 2008 outburst of EX Lup is caused by increased accretion onto the central star as indicated by the increase of the Br line luminosity in the outburst compared to the quiescent phase. On the basis of the observational data we conclude, however, that it is unlikely that the self-regulated thermal instability is the responsible mechanism triggering the outburst.
The recent work of D’Angelo & Spruit (2010) could provide an alternative explanation for the outburst mechanism of EX Lup. If the magnetic truncation radius of a strongly magnetized star is close to the co-rotation radius the accretion onto the star will not be continuous anymore, but becomes episodic. After the end of an outburst, in the quiescent phase, the inner radius of the disk is located just outside of the co-rotation radius. The accretion onto the star is low and material piles up at the inner edge of the disk. The inner radius of the disk moves inwards and when it crosses the co-rotation radius a burst of accretion occurs that empties the piled up reservoir of material and moves the inner edge of the disk outside of the co-rotation radius again. The interesting property of this model is the shape of the accretion rate vs. time curve (see e.g. Fig. 4 middle panel in D’Angelo & Spruit 2010). The outburst starts with a steep rise of the accretion rate which is followed by a slow plateau-like fading with quasi-periodic oscillations on top of the slow decline. This is very similar to what is observed in the optical light curve of EX Lup, which is thought to be closely related to the accretion rate (i.e. hot spot on the stellar surface). Not only the shape of the light curve, but also the predicted time-scales by these simulations are in qualitative agreement with the observations. For the parameters which are the closest to that of EX Lup (see Fig. 5 in D’Angelo & Spruit 2010) the simulations of D’Angelo & Spruit (2010) predict that the duration of the outbursts is less than the viscous time-scale at the co-rotation radius, while the time between two subsequent outburst is about ten times the viscous time-scale. To compare the observations to the simulation of D’Angelo & Spruit (2010) we estimated the viscous time-scale at the co-rotation radius for EX Lup. Sipos et al. (2009) measured of EX Lup to be 4.42 km/s. Using a stellar mass and radius of 0.6 M⊙ 1.6 R⊙ (Gras-Velázquez & Ray, 2005), respectively, and assuming 20∘ inclination and the resulting viscous time-scale is about three years. According to the models of D’Angelo & Spruit (2010) the duty cycle of the outbursts would be about thirty years while a single outburst would last less than three years. Although these numbers are close to the observed values, the agreement could only be considered qualitative, due to the large unceratainty in the value of and the unknown inclination angle. Despite of these uncertainties, the remarkable similarity of the observed light curve of EX Lup and the accretion rate curve predicted by D’Angelo & Spruit (2010) suggests that a further quantitative comparison between this model and observations of EXors should be done.
5 Summary and conclusions
Several studies tried to find special characteristics of EXors, apart from the optical outbursts, which would make them distinguishable from ’normal’ T Tauri stars (e.g., Herbig 2007, Sipos et al. 2009), but none were found so far. Thus, it was concluded that probably most, if not all T Tauri stars go through an eruptive phase during their evolution (Vorobyov & Basu, 2006). Despite the fact that studies of these objects provide information about young low-mass stars in general, little is known about this phase of stellar evolution. In this paper we studied the disk and dust properties around EX Lup in its most recent outburst, in order to learn about dust processing and put constraints on the outburst mechanism.
Our conclusions can be summarized as follows:
-
•
The accretion rate of EX Lup increased to about M⊙/yr on 21 Apr 2008. This is about three orders of magnitude higher than in the quiescent phase (Sipos et al., 2009), indicating that the outburst is caused by increased accretion onto the star.
-
•
Modeling of the SED and mid-infrared visibilities suggests that more than 90% of the total accretion luminosity is radiated away from a hot component which dominates the SED at optical wavelengths. This component can either be a hot spot on the stellar surface or a narrow ring of hot gas at the inner edge of the dust disk. Our observations exclude the presence of an extended (R AU) optically thick accretion disk during the outburst.
-
•
Calculation of the viscous time-scale in the disk shows that all material accreted in the 2008 outburst of EX Lup should have been located within 0.1 AU from the central star. This is well within the inner hole of the dust disk (inner radius: 0.3 AU), suggesting that the inner dust-free hole is filled with gas, optically thin in the continuum.
-
•
We compared accretion rates and time-scales as well as the SED of EX Lup and FUors. We concluded that, although the triggering mechanism of the outburst of EX Lup is certainly related to accretion, it is unlikely that it is the same thermal instability that is thought to operate in FUor systems.
-
•
The post-outburst Spitzer IRS spectra of EX Lup revealed the presence of several new crystalline features (19.5 µm, 24 µm, 28 µm and tentatively at 33 µm), which are associated with crystalline forsterite. The detection of these forsterite features supports the conclusion of Ábrahám et al. (2009) that crystals have formed in the disk atmosphere of EX Lup during the outburst.
-
•
On the basis of the position of the forsterite bands (especially the 16 m band) we conclude that the lattice of the new crystals is very iron-poor. On the other hand, the crystals should be in thermal contact with iron, otherwise their temperature would be too low. This suggests that the parent amorphous grains had to be also in thermal contact with iron either in the silicate network or as metallic inclusions.
-
•
Apart from forsterite, no other crystalline silicate species were identified in the mid-infrared spectra of EX Lup. In order to prevent the formation of crystalline enstatite the amorphous grains should be small (1 µm) and porous. The analysis of the quiescent phase Spitzer IRS spectrum of EX Lup indeed showed that the disk atmosphere contains small amorphous grains (Sipos et al., 2009).
-
•
The MIDI correlated spectrum of EX Lup shows very high crystallinity, while in the uncorrelated spectrum no crystalline features are seen. This indicates that crystals are highly concentrated towards the center, which is reproduced in our models as crystal formation occurs only within 1.1 AU from the central star.
-
•
The shape of the uncorrelated (outer disk) spectrum shows signatures of large grains (several µm) in the disk atmosphere, which were not present before. This can only be explained by active vertical mixing, which stirred up these grains from deeper layers. It also implies that the turbulence in the quiescent phase is probably weaker than in the outburst, to allow these grains to settle below the disk atmosphere.
-
•
Our model predicts far weaker forsterite bands longwards of 20 µm in the post-outburst spectra, than observed in the Spitzer spectra, indicating the presence of forsterite beyond 1.1 AU (i.e. lower temperatures). Crystals could not form in situ outwards of 1.1 AU in the disk atmosphere, otherwise their feature would be visible in the MIDI uncorrelated spectrum. We concluded, therefore, that they were transported outwards from within 1.1 AU by some wind-driven transport mechanism.
-
•
Our vertical mixing model could not reproduce the decrease in the strength of the forsterite bands in the 10 µm silicate complex between October 2008 and April 2009. An alternative explanation could be if a significant fraction of the crystal population in the innermost 1.1 AU was transported to larger radii.
Appendix A Modeling of the outburst
In order to obtain the temperature structure of the disk, we used 2D radiative transfer code RADMC (Dullemond & Dominik, 2004a) This code was extensively tested against other radiative transfer codes at low (Pascucci et al., 2004) and high optical depths (Pinte et al., 2009; Min et al., 2009). Originally, only passive heating of the dust grains by the central star was considered in RADMC. For this study we also include viscous heating by an accretion disk and also the emission from the hot spot on the stellar surface. Viscous heating was implemented as a one grid cell layer in the disk midplane, which radiates as a blackbody at the local effective temperature, assuming it is optically thick in the vertical direction. The effective temperature of the accretion disk at a given radius () is calculated according to Shakura & Sunyaev (1973):
| (A1) |
Here, is the gravitational constant, is the mass accretion rate, while and are the mass and radius of the star, respectively.
We also consider the radiation of the hot spot where the funnel flow of the accreting gas is thought to reach the stellar surface. Assuming that the spot radiates as a blackbody, the temperature of the spot is given by
| (A2) |
Here, is the effective temperature of the star and is the fraction of the stellar surface area covered by the hot spot. The quantity is the truncation radius from which the accreting gas is thought to move with free-fall velocity towards the surface of the star. For we assumed according to Gullbring et al. (1998). The surface area of the spot () was determined by fitting the outburst SED at optical wavelengths. This value is higher than usually found in T Tauri stars (0.01, Calvet & Gullbring (1998)). It was, however, also noted that the covering fraction of the hot spot can be as high as in strongly accreting systems (Calvet & Gullbring, 1998). To account for the change of the covering fraction with the accretion rate we use the following (ad hoc) relation for :
| (A3) |
for we fixed the value of and used .
After we obtained the temperature structure of the disk at any instant, the procedure in Dullemond & Dominik (2004b) was followed to investigate the turbulent mixing of solids in the disk time-dependently. The mixing of the solid is treated as a turbulent diffusion process and we also include dust settling. The conservation equation of dust grains we solve is
| (A4) |
Here, represents the number of dust grains per square centimeter of the disk, is the diffusion coefficient and is the settling speed. For the diffusion coefficient of the gas we used the standard prescription
| (A5) |
where is the local sound speed and is the pressure scale height of the gas. The diffusion coefficient of the dust () depends on how strongly the grains are coupled to the gas (i.e. the size of the grains), which is described by the Schmidt-number () as . The Schmidt number is unity if the dust particles are well coupled to the gas, while for larger grains sizes the decoupling is described by larger Schmidt numbers. During the simulation we assumed that . The dust particles, which contribute to the 10 micron emission feature of EX Lup, are mostly sub-micron sized for which the strong coupling is a good approximation. During the calculation we assume that the disk is vertically isothermal and we calculate the local sound speed from the temperature at the disk midplane. The sound speed scales with the square root of the temperature, therefore the error we made with the assumption of vertically isothermal disk is in the order of . At 1 AU this factor is less than 2, which is basically negligible compared to the uncertainty in the value of .
References
- Ábrahám et al. (2009) Ábrahám, P., Juhász, A., Dullemond, C. P., et al. 2009, Nature, 459, 224
- Aspin et al. (2010) Aspin, C., Reipurth, B., Herczeg, G., & Capak, P. 2010, ApJ, 719, L50
- Bell & Lin (1994) Bell, K. R. & Lin, D. N. C. 1994, ApJ, 427, 987
- Bouwman et al. (2008) Bouwman, J., Henning, T., Hillenbrand, L. A., et al. 2008, ApJ, 683, 479
- Calvet & Gullbring (1998) Calvet, N. & Gullbring, E. 1998, ApJ, 509, 802
- Clarke et al. (2005) Clarke, C., Lodato, G., Melnikov, S., & Ibrahimov, M. 2005, MNRAS, 361, 942
- Cohen et al. (1999) Cohen, M., Walker, R. G., Carter, B., et al. 1999, AJ, 117, 1864
- D’Angelo & Spruit (2010) D’Angelo, C. & Spruit, H. 2010, MNRAS, 1208, 406
- Davoisne et al. (2006) Davoisne, C., Djouadi, Z., Leroux, H., et al. 2006, A&A, 448, L1
- Desch et al. (2005) Desch, S. J., Ciesla, F. J., Hood, L. L., & Nakamoto, T. 2005, in Chondrites and the Protoplanetary Disk, ed. A. N. Krot, E. R. D. Scott, & B. Reipurth (San Fransisco: ASP), 849
- Dullemond & Dominik (2004a) Dullemond, C. P. & Dominik, C. 2004a, A&A, 417, 159
- Dullemond & Dominik (2004b) Dullemond, C. P. & Dominik, C. 2004b, A&A, 421, 1075
- Fabian et al. (2000) Fabian, D., Jäger, C., Henning, T., Dorschner, J., & Mutschke, H. 2000, A&A, 364, 282
- Gail (2001) Gail, H.-P. 2001, A&A, 378, 192
- Gail (2004) Gail, H.-P. 2004, A&A, 413, 571
- Glindemann et al. (2000) Glindemann, A., Abuter, R., Carbognani, F., et al. 2000, in Presented at the Society of Photo-Optical Instrumentation Engineers (SPIE) Conference, Vol. 4006, Proc. SPIE Vol. 4006, p. 2-12, Interferometry in Optical Astronomy, Pierre J. Lena; Andreas Quirrenbach; Eds., ed. P. J. Lena & A. Quirrenbach, 2–12
- Gordon et al. (2007) Gordon, K. D., Engelbracht, C. W., Fadda, D., et al. 2007, PASP, 119, 1019
- Goto et al. (2011) Goto, M., Regály, Z., Dullemond, C., et al. 2011, ApJ, 728, 5
- Gras-Velázquez & Ray (2005) Gras-Velázquez, A. & Ray, T. P. 2005, A&A, 443, 541
- Greiner et al. (2008) Greiner, J., Bornemann, W., Clemens, C., et al. 2008, PASP, 120, 405
- Gullbring et al. (1998) Gullbring, E., Hartmann, L., Briceno, C., & Calvet, N. 1998, ApJ, 492, 323
- Güsten et al. (2006) Güsten, R., Nyman, L., Schilke, P., et al. 2006, A&A, 454, L13
- Hartmann & Kenyon (1996) Hartmann, L. & Kenyon, S. J. 1996, ARAA, 34, 207
- Henning & Meeus (2006) Henning, T. & Meeus, G. 2006, ArXiv, arXiv:0911.1010
- Herbig (1977) Herbig, G. H. 1977, ApJ, 217, 693
- Herbig (2007) Herbig, G. H. 2007, AJ, 133, 2679
- Herbig (2008) Herbig, G. H. 2008, AJ, 135, 637
- Houck et al. (2004) Houck, J., Roellig, T., van Cleve, J., & et al. 2004, ApJS, 154, 18
- Jaeger et al. (1998) Jaeger, C., Mutschke, H., & Henning, T. 1998, A&A, 332, 291
- Jones (2008) Jones, A. 2008, Central Bureau Electronic Telegrams, 1217, 1
- Juhász et al. (2010) Juhász, A., Bouwman, J., Henning, T., et al. 2010, ApJ, 721, 431
- Kemper et al. (2005) Kemper, F., Vriend, W. J., & Tielens, A. G. G. M. 2005, ApJ, 633, 534
- Kessler-Silacci et al. (2007) Kessler-Silacci, J., Dullemond, C., Augereau, J.-C., et al. 2007, ApJ, 659, 680
- Koike et al. (2003) Koike, C., Chihara, H., Tsuchiyama, A., et al. 2003, A&A, 399, 1101
- Kóspál et al. (2011) Kóspál, A., P.Ábrahám, Goto, M., et al. 2011, ApJ, 736, 72
- Lahuis & Boogert (2003) Lahuis, F. & Boogert, A. 2003, in SFChem 2002: Chemistry as a Diagnostic of Star Formation, ed. C. L. Curry & M. Fich (NRC Press, Ottawa, Canada), 335
- Leinert et al. (2003) Leinert, C., Graser, U., Waters, L. B. F. M., et al. 2003, in Interferometry for Optical Astronomy II. Edited by Wesley A. Traub . Proceedings of the SPIE, Volume 4838, pp. 893-904 (2003)., ed. W. A. Traub, 893–904
- Lorenzetti et al. (2007) Lorenzetti, D., Giannini, T., Larionov, V., et al. 2007, ApJ, 665, 1182
- Lu et al. (2008) Lu, N., Smith, S. P., Engelbracht, C. W., et al. 2008, PASP, 120, 328
- Makovoz & Marleau (2005) Makovoz, D. & Marleau, F. R. 2005, PASP, 117, 1113
- Meeus et al. (2009) Meeus, G., Juhász, A., Henning, T., et al. 2009, A&A, 497, 379
- Min et al. (2003) Min, M., , Hovenier, J., & de Koter, A. 2003, A&A, 404, 35
- Min et al. (2008) Min, M., , Hovenier, J., Waters, L., & de Koter, A. 2008, A&A, 489, 135
- Min et al. (2009) Min, M., Dullemond, C. P., Dominik, C., de Koter, A., & Hovenier, J. W. 2009, A&A, 497, 155
- Muzerolle et al. (1998) Muzerolle, J., Calvet, N., & Hartmann, L. 1998, ApJ, 492, 743
- Ordal et al. (1988) Ordal, M., Bell, R., Alexander, R., Newquist, L., & Querry, M. 1988, Appl. Opt., 27, 1203
- Ossenkopf et al. (1992) Ossenkopf, V., Henning, T., & Mathis, J. 1992, A&A, 261, 567
- Pascucci et al. (2004) Pascucci, I., Wolf, S., Steinacker, J., et al. 2004, A&A, 417, 793
- Pinte et al. (2009) Pinte, C., Harries, T. J., Min, M., et al. 2009, A&A, 498, 967
- Pojmanski (2002) Pojmanski, G. 2002, Acta Astronomica, 52, 397
- Pollack et al. (1994) Pollack, J., Hollenbach, D., Beckwith, S., et al. 1994, ApJ, 421, 615
- Quanz et al. (2007) Quanz, S. P., Henning, T., Bouwman, J., et al. 2007, ApJ, 668, 359
- Rieke et al. (2004) Rieke, G. H., Young, E. T., Engelbracht, C. W., et al. 2004, ApJS, 154, 25
- Romanova et al. (2002) Romanova, M. M., Ustyugova, G. V., Koldoba, A. V., & Lovelace, R. V. E. 2002, ApJ, 578, 420
- Romanova et al. (2004) Romanova, M. M., Ustyugova, G. V., Koldoba, A. V., & Lovelace, R. V. E. 2004, ApJ, 616, L151
- Sargent et al. (2009) Sargent, B., Forrest, W., Tayrien, C., et al. 2009, ApJ, 690, 1193
- Scott & Duley (1996) Scott, A. & Duley, W. 1996, ApJS, 105, 401
- Shakura & Sunyaev (1973) Shakura, N. I. & Sunyaev, R. A. 1973, A&A, 24, 337
- Sipos et al. (2009) Sipos, N., Ábrahám, P., Acosta-Pulido, J., et al. 2009, astro-ph, [arXiv:0906.3168]
- Sogawa et al. (2006) Sogawa, H., Koike, C., Chihara, H., et al. 2006, A&A, 451, 357
- van Boekel et al. (2004) van Boekel, R., Min, M., Leinert, C., et al. 2004, Nature, 432, 479
- van Boekel et al. (2005) van Boekel, R., Min, M., Waters, L. B. F. M., et al. 2005, A&A, 437, 189
- Vorobyov & Basu (2006) Vorobyov, E. I. & Basu, S. 2006, ApJ, 650, 956
- Watson et al. (2009) Watson, D. M., Leisenring, J. M., Furlan, E., et al. 2009, ApJS, 180, 84
- Wooden et al. (2007) Wooden, D., Desch, S., Harker, D., Gail, H.-P., & Keller, L. 2007, in Protostars and Planets V, ed. B. Reipurth, D. Jewitt, & K. Keil (University of Arizona Press), 815
- Zhu et al. (2007) Zhu, Z., Hartmann, L., Calvet, N., et al. 2007, ApJ, 669, 483
| Instrument | Date | [µm] | Fν [mJy] | Fν,corr [mJy] |
|---|---|---|---|---|
| SPITZER IRS | 18 Mar 2005 | 5.5–38.0 | - | - |
| WFI | 20 Apr 2008 | 0.36 (U) | 1591.46 | 1591.46 |
| GROND | 20 Apr 2008 | 0.45 (g) | 45062 | 29362 |
| WFI | 20 Apr 2008 | 0.46 (B) | 4865 | 3195 |
| WFI | 20 Apr 2008 | 0.54 (V) | 5545 | 4195 |
| GROND | 20 Apr 2008 | 0.61 (r) | 67593 | 55793 |
| GROND | 20 Apr 2008 | 0.77 (i) | 825114 | 754114 |
| GROND | 20 Apr 2008 | 0.89 (z) | 1025141 | 721141 |
| SOFI | 20 Apr 2008 | 1.21 | 46213 | - |
| GROND | 20 Apr 2008 | 1.25 (J) | 4009 | - |
| GROND | 20 Apr 2008 | 1.65 (H) | 52913 | - |
| SOFI | 20 Apr 2008 | 1.71 | 58616 | - |
| GROND | 20 Apr 2008 | 2.15 (K) | 67031 | - |
| SOFI | 20 Apr 2008 | 2.19 | 64318 | - |
| SPITZER IRS | 21 Apr 2008 | 5.5–38.0 | - | - |
| MIPS | 21 Apr 2008 | 71.42 | 3130220 | - |
| LABOCA | 21 Apr 2008 | 870 | 4110 | - |
| VLTI MIDI | 22 Jun 2008 | 8.0–13.0 | - | - |
| VLTI MIDI | 16 Jul 2008 | 8.0–13.0 | - | - |
| VLT VISIR | 24 Jul 2008 | 8.0–13.0 | - | - |
| VLT VISIR | 25 Jul 2008 | 8.0–13.0 | - | - |
| VLT VISIR | 27 Jul 2008 | 8.0–13.0 | - | - |
| VLT VISIR | 28 Aug 2008 | 8.0–13.0 | - | - |
| VLT VISIR | 29 Aug 2008 | 8.0–13.0 | - | - |
| SPITZER IRS | 10 Oct 2008 | 5.5–38.0 | - | - |
| SPITZER IRS | 7 Apr 2009 | 5.5–38.0 | - | - |
| Parameter | Fitted value |
|---|---|
| Stellar temperature | 3800 K |
| Stellar radius | 1.6 R⊙ |
| Stellar mass | 0.6 M⊙ |
| Visual extinction | 0 mag |
| Distance | 155pc |
| Inner radius (dust disk) | 0.3 AU |
| Outer radius (dust disk) | 150 AU |
| Scale height (at the outer radius) | 18 AU |
| Flare index | 0.09 |
| Power exponent (surface density) | -1.0 |
| Total disk mass (gas + dust) | 0.025 M⊙ |
| Inclination angle | 20 ∘ |