The Circumstellar Environment of R Coronae Borealis: White Dwarf Merger or Final Helium Shell Flash? 111Based in part on observations with the NASA/ESA Hubble Space Telescope obtained at the Space Telescope Science Institute, and from the data archive at STScI, which are operated by the Association of Universities for Research in Astronomy, Inc., under NASA contract NAS5-26555
Abstract
In 2007, R Coronae Borealis (R CrB) went into an historically deep and long decline. In this state, the dust acts like a natural coronagraph at visible wavelengths, allowing faint nebulosity around the star to be seen. Imaging has been obtained from 0.5 to 500 µm with Gemini/GMOS, HST/WFPC2, Spitzer/MIPS, and Herschel/SPIRE. Several of the structures around R CrB are cometary globules caused by wind from the star streaming past dense blobs. The estimated dust mass of the knots is consistent with their being responsible for the R CrB declines if they form along the line of sight to the star. In addition, there is a large diffuse shell extending up to 4 pc away from the star containing cool 25 K dust that is detected all the way out to 500 µm. The SED of R CrB can be well fit by a 150 AU disk surrounded by a very large diffuse envelope which corresponds to the size of the observed nebulosity. The total masses of the disk and envelope are 10-4 and 2 M☉, respectively, assuming a gas-to-dust ratio of 100. The evidence pointing toward a white-dwarf merger or a final-helium-shell flash origin for R CrB is contradictory. The shell and the cometary knots are consistent with a fossil planetary nebula. Along with the fact that R CrB shows significant Lithium in its atmosphere, this supports the final-helium-shell flash. However, the relatively high inferred mass of R CrB and its high fluorine abundance support a white-dwarf merger.
1 Introduction
R Coronae Borealis (R CrB) was one of the first variable stars identified and its brightness variations have been monitored since its discovery over 200 years ago (Pigott & Englefield, 1797). The RCB stars form a small group of carbon-rich supergiants which are defined by extreme hydrogen deficiency, and unusual variability, characterized by large declines of 8 mag or more due to the formation of carbon dust at irregular intervals (Clayton, 1996). Two evolutionary scenarios have been suggested, a merger of a double-degenerate white dwarf merger, or a final helium shell flash (e.g., Webbink, 1984; Clayton et al., 2007). The unexpected discovery that some of the RCB stars have isotopic abundances of 18O which are up to 500 times those seen in other stars has increased the likelihood that these rare stars are the result of a white-dwarf merger (Clayton et al., 2005, 2007; García-Hernández et al., 2010).
RCB stars have long been known to show IR excesses due to warm circumstellar dust (Clayton, 1996; Feast et al., 1997, and references therein). Spectropolarimetry of R CrB obtained in a deep decline showed optical depth effects with wavelength that are consistent with a bipolar geometry with a thick disk or torus obscuring the star and additional more diffuse dust around the poles (Stanford et al., 1988; Clayton et al., 1997). Resolved nebulosity has been detected from the UV to the IR around several RCB stars, including R CrB itself, ranging in size from a few arcseconds (V854 Cen, UW Cen) to arcminutes (R CrB, RY Sgr, V CrA, UW Cen) (Walker, 1985; Rao & Nandy, 1986; Walker, 1986; Pollacco et al., 1991; Clayton et al., 1999; Clayton & Ayres, 2001), possibly linking these stars with final helium shell flash stars and the central stars of planetary nebulae (PNe). In particular, R CrB has a far-IR shell which is 20′ in diameter, corresponding to 8 pc at its assumed distance (Gillett et al., 1986). More recent observations have used interferometry and adaptive optics to obtain information about the distribution of dust around RCB stars on small spatial scales of tens of AU (Ohnaka et al., 2003; de Laverny & Mékarnia, 2004; Leão et al., 2007; Bright et al., 2011)
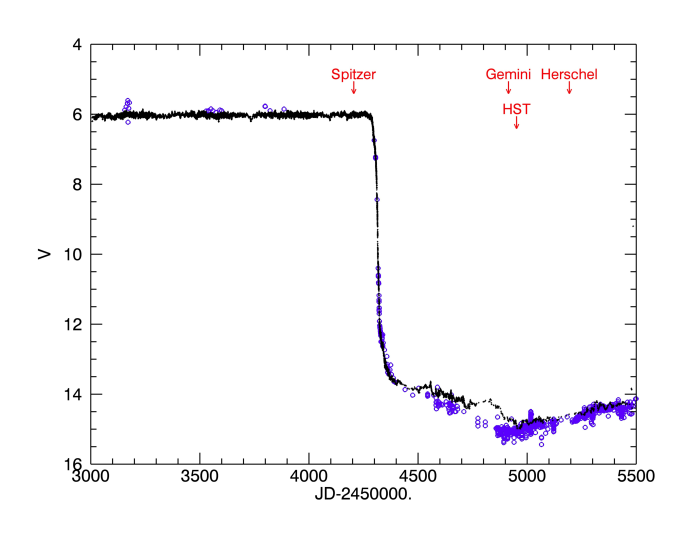
In 2007 July, R CrB went into a historically deep and long decline reaching V=15. In this state, R CrB acts as a natural coronagraph, as the thick dust cloud in front of the star eclipses its photosphere but not its circumstellar material. In this paper, we present new Gemini/GMOS, HST/WFPC2, Spitzer/MIPS, and Herschel/SPIRE images of R CrB obtained just before or during this decline, giving wavelength coverage from 0.5 to 500 µm. We will investigate the morphology and nature of the dust clouds seen near R CrB as well as its large far-IR shell.
2 Observations and Data Reduction
The new observations obtained for this study are summarized in Table 1. Figure 1 shows the recent AAVSO lightcurve of R CrB with the epochs of the various observations marked.
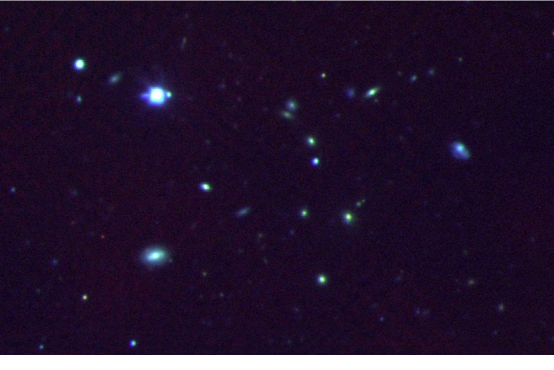
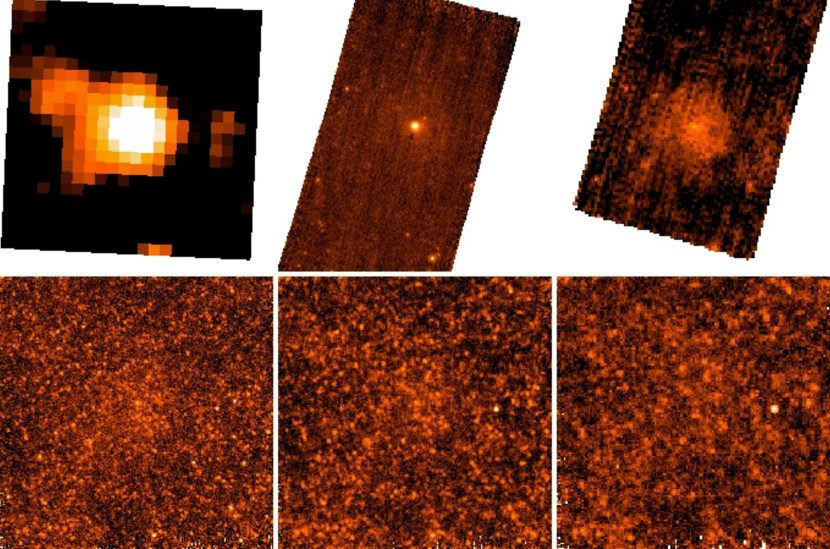
R CrB was observed with Gemini-S/GMOS on 2009 March 23. Images were obtained in the g′, r′, i′, z′, and CaT filters. We obtained 8 integrations of 30.5 s in each of the g′ and r′ filters for a total of 244s, and 14 integrations of 30.5 s each in the i′, z′, and CaT filters for a total of 427s. We used the 2x2 binning and slow readout mode. The field is 6′x 6′. The central part of the field is shown in Figure 2. All images have been geometrically registered to within 0.1 pix rms. A point spread function (PSF) centered on R CrB has been subtracted where the sky brightness has been ramped down to zero as one goes out 27 pixels in radius. The plate scale is 0146 per pixel. The seeing was 08. These PSF-subtracted images are shown in Figure 3.
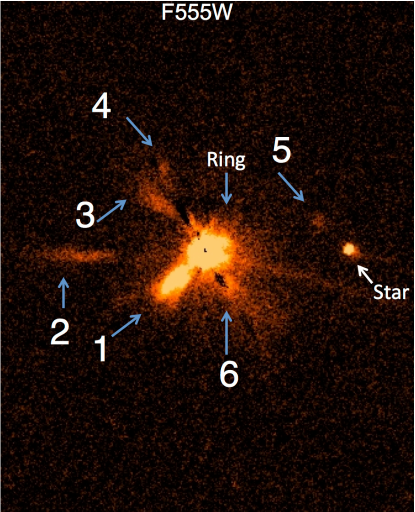
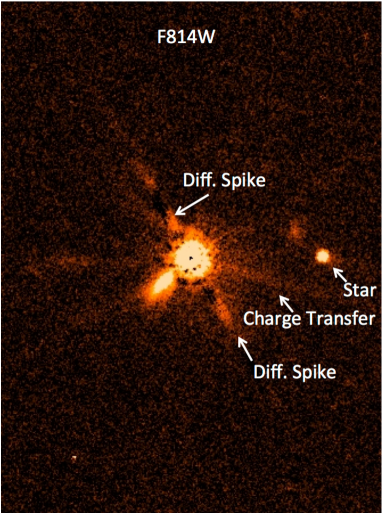
R CrB was observed with HST/WFPC2 on 2009 April 27. Images were obtained with the F555W and F814W filters with total integration times of 487s and 496s, respectively. The individual images were stacked and drizzled. The images were then registered and a PSF was subtracted. These images are shown in Figure 4. WFPC2 images of R CrB taken on 1996 July 1 (JD 2450265) with the F469N filter were downloaded from the MAST archive (Ueta et al., 2000). The exposures were 4 x 20s and 2 x 400s. When these images were obtained R CrB was at a visual magnitude of 8.1 (AAVSO) while recovering toward maximum light after a deep decline. The individual images were stacked and drizzled.
A UBVRI photometric sequence has been established for the R CrB field (Landolt & Clem, 2010). A number of stars (Nos. 13, 14, 19, 20, 22, 23, 31, 34, 35, 37, 39) from that sequence are also in the Gemini/GMOS field. Two of the stars (Nos. 20, 22) lie in the HST/WFPC2 field but none are on the PC chip. In addition, a strip from the Sloan Digital Sky Survey (SDSS) telescope crosses R CrB. Several of the photometric sequence stars (Nos. 13, 14, 19, 20, 23, 35, 37, 39) from Landolt & Clem (2010) also have ugriz photometry222http://www.sdss.org/ and lie in the GMOS field.
Spitzer/MIPS scan maps were obtained of R CrB at 24, 70, and 160 µm on 2007 April 14/15 as part of program 30029. We mapped a 20′ wide area using 15 legs at the medium scan rate with 80″ (1/4 array) cross-scan offsets. The total integration time was 15,536s. R CrB was observed twice to allow for good Germanium (70 and 160 µm) transient and asteroid removal. The second epoch maps allow for the clean removal of the Germanium responsivity drifts which are especially important for mapping extended emission around R CrB. The scan maps were reduced and mosaiced using the MIPS Data Analysis Tool (Gordon et al., 2005) supplemented with custom reduction scripts written specifically to improve the MIPS reductions of extended sources. The custom reduction scripts include extra stpdf beyond that of the MIPS DAT. At 24 m, the extra stpdf include readout offset correction, array averaged background subtraction (using a low order polynomial fit to each leg, with the region including the Galaxy excluded from this fit), and exclusion of the 1st five images in each scan leg due to boost frame transients. At 70 and 160 m, the extra processing step is a pixel dependent background subtraction for each map to remove residual detector drifts and background cirrus and zodiacal emissions. The 24 µm image was saturated in the core and was therefore excluded from the photometric analysis.
Herschel/SPIRE (Pilbratt et al., 2010; Griffin et al., 2010) images at 250, 350 and 500 µm were obtained on 2009 December 27 with a total integration time 4408s as part of the Herschel key programme, “MESS - Mass-loss of Evolved StarS.” The reduction of the SPIRE data is described in Groenewegen et al. (2011). The data were processed using the standard SPIRE photometer data processing pipeline (Griffin et al., 2008, 2010; Dowell et al., 2010). The procedure for calibrating the data is described in Swinyard et al. (2010).
The IRAS imaging data have been reprocessed using a better zodiacal light subtraction and better destriping (Miville-Deschênes & Lagache, 2005). The co-added 100 µm IRIS images have been downloaded for use in this study. The IRAS, Spitzer and Herschel images are shown in Figure 5. The new images have significantly better resolution than the IRAS 100 µm images. The pixel sizes are IRAS/100 (15), MIPS/70 (5″), MIPS/160 (16″), SPIRE/250 (6″), SPIRE/350 (10″). SPIRE/500 (14″).
3 Discussion
R CrB lies at high Galactic latitude (bII=+51∘) and so the foreground extinction is quite small, E(B-V)0.035 mag (Schlegel et al., 1998). At maximum light, R CrB is V=5.8 mag and B-V =0.6 mag (Lawson et al., 1990). The absolute magnitude of R CrB is estimated to be MV=–5 mag based on the absolute magnitude/effective temperature relationship found for the Large Magellanic Cloud RCB stars (Alcock et al., 2001; Tisserand et al., 2009). So, for the analysis in this paper, we adopt a distance of 1.4 kpc. The most recent decline of R CrB began in 2007 July (JD 2454290) and the star began returning toward maximum light in the spring of 2011. Landolt & Clem (2010) point out that the recent decline of R CrB is among the longest ever recorded. This decline was deeper than most, bottoming out at V 15.2 mag.
3.1 Background Objects
As shown in Figure 1, The Gemini/GMOS and HST/WFPC2 imaging was obtained when the star was at V15 mag or about 9 magnitudes below maximum light. The extreme faintness of the star revealed for the first time that R CrB lies in front of a cluster of galaxies, shown in Figure 2.
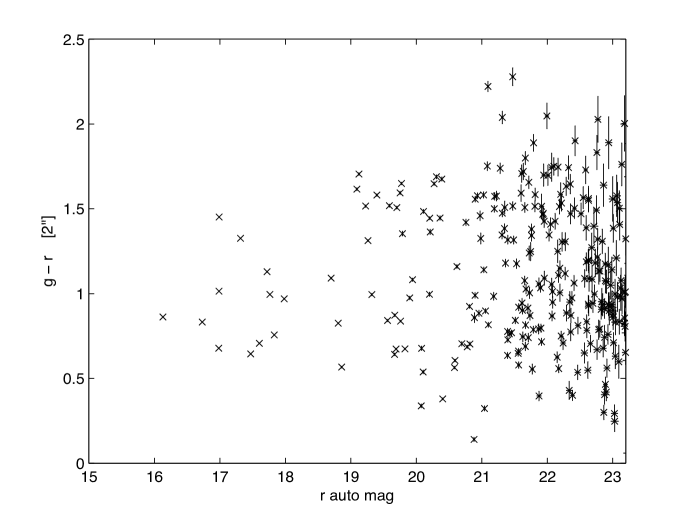
A color magnitude diagram (CMD) was constructed using the Gemini/GMOS images. The GMOS g-band image was registered to the r-band image. Then SExtractor was used to obtain photometry in dual image mode, with the r-band image used for selecting objects. For the g-r colors in the CMD, photometry was obtained through 2″ diameter apertures. The GMOS vs diagram, shown in Figure 6, displays a fairly clear red sequence at and which corresponds to a cluster of galaxies at . The sizes of the galaxies in the GMOS imaging are appropriate for this redshift.
R CrB also lies in a SDSS strip obtained in 2005 when the star was bright. SDSS did not obtain spectra of any of the galaxies in Figure 2, but it did get spectra of about 25 galaxies within 10′ of R CrB. Of these 14 had redshifts in the range 0.07-0.09, and 6 had redshifts in the range 0.16-0.18. The SDSS spectroscopy is unable to reach normal cluster galaxies at and the SDSS redshifts are likely to be those of field galaxies in the foreground of the cluster.
Landolt & Clem (2010) were the first to point out that there is a faint red star 3″ west of R CrB. They find that the star has a magnitude of =20.780.06 and = 0.990.08. It is also clearly visible in the HST, and Gemini images taken during the R CrB minimum in Figures 3 and 4. If the star is a physical companion, it would be at a projected distance of about 4000 AU from R CrB, and its absolute magnitude would be +10 mag. This would imply that the star is a main sequence M star, however the observed colors are not consistent with such a star. On the other hand, if the faint companion to R CrB is a K2 V star, which is more consistent with its colors ( = 0.91 and =+6.4 mag (Cox, 2000)), then it is at a distance of 7 kpc. In short, the companion star is likely to be a background K dwarf. The companion star to R CrB is not visible in the HST/WFPC2 F469N images from 1996. The WFPC2 ETC, assuming a 20th magnitude K0 star, estimates that the ratio of the count rates in the three filters will be F469N/F555W/F814W = 0.04/5.7/6.7 electrons pixel-1 s-1. So it is likely that the star was too faint to be seen in the F469N images.
3.2 Cometary Knots Close to R CrB
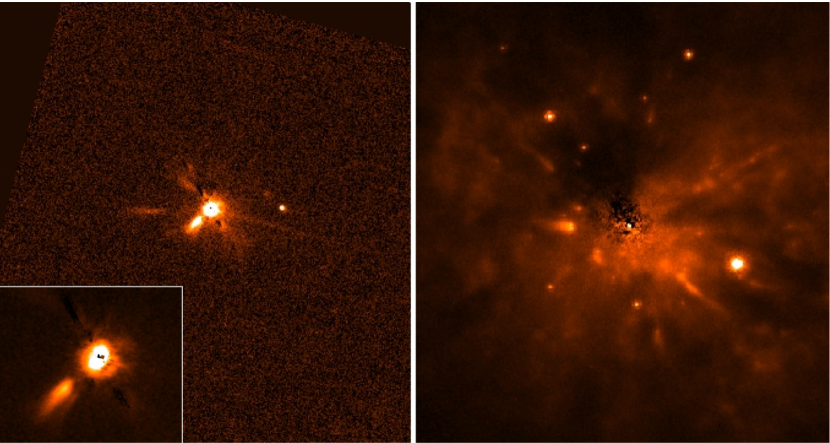
The Gemini and HST fields centered on R CrB are shown in Figures 3 and 4. A stellar PSF has been subtracted from the position of R CrB for each image. The Gemini and HST images were obtained only a month apart and the same structures can be seen in both. The structures are labeled in Figure 4, showing real nebulosity as well as instrumental artifacts such as diffraction spikes and charge transfer effects. The real structures appear in multiple filters in both GMOS and WFPC2 images so are unlikely to be artifacts.
R CrB was 9 magnitudes fainter than at maximum light during the decline. The dust lying in front of the star is extremely optically thick so at this time we are seeing essentially zero directly transmitted light. When the star itself is completely obscured, all that remains is a fairly constant scattered-light residual that is likely to be from photons that have escaped around the edge of the obscuring cloud by scattering off dust lying beside or behind the star. This scattered light may be responsible for the typical flat-bottomed declines often seen in RCB star lightcurves. When the stellar photosphere is obscured in deep declines, RCB stars show emission lines in their spectra. Spectra were obtained of R CrB in 2008 when it was deep in the present decline showing emission lines including the Na I D lines and the IR Ca II triplet (Rao & Lambert, 2010). These spectra show that the emission lines account for no more than 5-10% of the flux in the V band. R CrB, itself, appears to be marginally resolved in the WFPC2 images. There is a diffuse, nearly circular “halo” around the star. This may be the dust near the star that is scattering the light around the obscuring cloud. Jeffers et al. (2011) also suggest the presence of this halo based on the brightness of R CrB at the bottom of its decline. The blobs visible in Figures 3 and 4 are also seen in scattered light from R CrB.
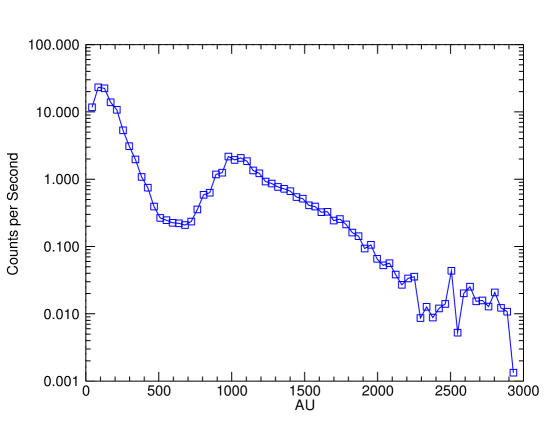
Several of the structures around R CrB appear as jet-like blobs pointing radially away from the star. This could either be a lighting effect created by the central star shining through holes in the dust clouds and illuminating different portions of the circumstellar dust shell, or the blobs could be “cometary” knots. The RCB star, UW Cen, shows both illumination structures and cometary structures (Clayton et al., 1999, Clayton et al. 2011, in preparation). Figure 7 shows a comparison of the blobs seen in R CrB and cometary globules seen in UW Cen. In particular, the globule to the SE of R CrB shows the typical “tadpole” shape similar to those seen in the Helix nebula (Matsuura et al., 2009). It also shows a sharp edge on the side toward the star with the brightness fading away from the star, as shown in Figure 8. The largest knot (#1 in Figure 7) is 1000 AU across. This is larger than the knots in the Helix which are 100-300 AU in size with masses of 10-5M☉ (O’Dell & Handron, 1996). The simplest explanation for these cometary knots is that they are caused by a stellar wind streaming past a density enhancement moving slowly away from the star (García-Segura et al., 2006). There is evidence for both low (10-20 km s-1) and high (200-400 km s-1) velocity gas streaming away from RCB stars (Clayton et al., 1992, 2003; Garcia-Hernandez et al., 2011). Simulations show that when a slow wind is overtaken by a fast wind, the gas-gas interaction could create knot-like shapes (Pittard et al., 2005). Recent investigations using a hydrodynamics code including dust shows that small dust grains (0.045 µm) will follow the motion of the gas closely (van Marle et al., 2011). The UW Cen nebula, about 15″ across, resembles a fossil PN shell where the gas is neutral and the shell is seen in light scattered from dust (Clayton et al., 1999). UW Cen is at a distance of 5.5 kpc so if it were at the distance of R CrB, its nebula would be about 1′ in size. As described below, the diffuse nebulosity around R CrB extends at least 10′ from the star but no blobs or density concentrations are seen more than a few arcseconds from the star.
Jeffers et al. (2011) report imaging polarimetry of the cometary knot SE of R CrB (#1 in Figure 7). Combining those data with the WFPC2 images presented here, they infer that the knot is at a scattering angle of 105∘ and has a dust mass of 10-6 M☉. It lies about 1″ from R CrB which is about 1400 AU from the star. At velocities of 20 and 200 km s-1, the age of the blob would be 300 or 30 yr, respectively.
To estimate the mass of dust present in the knots, we make the following simplifying assumptions: (1) the illuminating flux from R CrB is unobscured (i.e. equal to the maximum values given in Table 2), (2) the dust in the knot is optically thin, such that all grains are illuminated and no grains are shadowed, and (3) that the grains can be described by the neutral PAH and graphitic solid properties from Li & Draine (2001). Following Chevalier (1986), the flux scattered off one dust grain of radius at a distance from a source with flux is
| (1) |
where is the scattering efficiency, is the Henyey & Greenstein (1941) phase function, and is the scattering angle. If one assumes the dust grains have uniform size, the mass of grains () in a knot that produces a total scattered flux () is
| (2) |
where g cm-3 is the density of carbonaceous dust. If one instead adopts an MRN size distribution (Mathis et al., 1977) such that the number density of grains then
| (3) |
where the numeric constant is the normalization factor from Weingartner & Draine (2001), and assuming a gas-to-dust ratio of 100. Finally, if the dust is assumed to lie in a spherical shell of inner and outer radii and then must be integrated over the volume of the shell. Since
| (4) |
the total grain mass for a single-sized model equals
| (5) |
Of the knots identified in Fig. 4, numbers 4 and 6 are coincident with diffraction spikes, and we refrain from estimating their dust masses. For the others, the total flux from each knot was measured through manually-sized elliptical apertures. These values are reported in Table 3. For each knot, models with single grain sizes of 0.001, 0.01, 0.1 and 1.0 m, as well as full MRN distributions, were tested for scattering angles from 10°to 170° (in increments of 10°) to find which combinations of grain sizes and scattering angles yielded equivalent dust masses for both the F555W and F814W photometry. The best-fitting models, including the grain sizes, scattering angle, resulting clump distance from R CrB and estimated dust mass, are also listed in Table 3. The model dust masses are 10-10 to 10-7 M☉. Note that if a model is not listed, it failed to reproduce the photometry in both filters.
Knot 3 has very low flux in the F814W filter, resulting in a large uncertainty with the flux between 4 and 6 erg cm-2 s-1 Å-1. For this reason, results are shown for the upper and lower flux range. Since small grains scatter isotropically, there were no preferrable scattering angles for this knot using the smaller single grain-size models, making a distance estimate from R CrB impossible. Owing to the very bright F814W flux from knot 5, we find there is no dust-scattering model that adequately reproduces the fluxes in both filters.
To estimate the dust mass producing the halo (i.e., the slightly-resolved profile around R CrB), we assume that all of its flux is light scattered by a thin circumstellar shell. We find that a limb-brightened shell of optically-thin dust can be up to 03 in radius and still produce a profile consistent with that of R CrB in the 2009 HST images. The flux of the halo, as well as the best-fitting dust model that produces this scattered light, is listed at the bottom of Table 3.
Note that our first modeling assumption implies that the masses derived above are lower limits, since more dust is required if the incident flux is lower than that of R CrB at maximum light. As a quick check of the second assumption, we assume the knots are ellipsoids with the same axes as those used to measure the fluxes. In knot 1, there are grains of radius 0.1 m, corresponding to a number density of cm-3. The optical depth where is the line-of-sight distance through the dust and is the absorption efficiency. The proposed ellipsoid has a depth around cm, yielding an approximate -band optical depth of , which is sufficiently thin to warrant the assumption that all grains are illuminated by the star. See §3.3 for a justification of the last assumption, namely, that the dust is purely carbonaceous.
3.3 The Large Far-IR Dust Shell
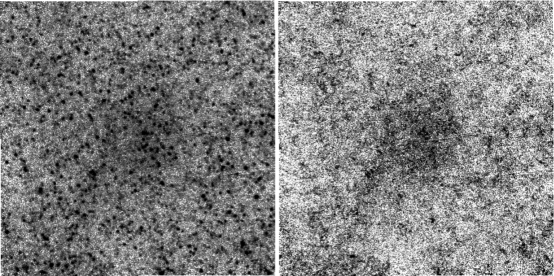
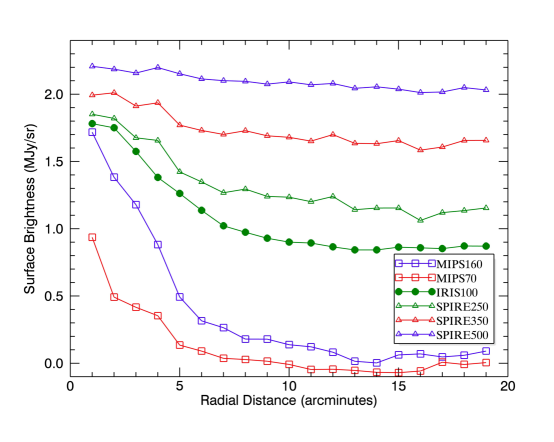
R CrB has an IRAS shell with a radius of 10′, 4 pc at a distance of 1.4 kpc (Gillett et al., 1986). The new MIPS images at 70 and 160 µm, shown in Figure 5 along with the IRAS 100 µm image, confirm the presence of a large dust shell. It is also visible in the SPIRE images at 250 and 350 µm. It is not clearly visible at 500 µm. The new MIPS and SPIRE images have significantly better resolution than IRAS. These new images imply that the shell is spherical in shape and that the component to the northeast of the nebula in the IRAS 100 µm image is detached from the R CrB shell in the MIPS and SPIRE images. The SPIRE images, in particular, are full of point sources, which are background galaxies. To determine how much of the nebulosity seen in the IRAS, MIPS and SPIRE images might be due to blended emission from background galaxies, we used Sextractor to identify and remove point sources from the SPIRE 250 µm image. The result is shown in Figure 9. This clearly shows that the dust nebulosity around R CrB is not due to a concentration of galaxies in a cluster behind the star. There is significant diffuse far-IR emission, centered on R CrB. To get a clearer idea of the extent of the nebulosity at different IR wavelengths, the average brightness in 1′ concentric rings from R CrB was calculated and plotted in Figure 10. These new data show that the shell is possibly even larger than that seen by IRAS. The MIPS 70 µm image also has a central elongated structure running almost east-west that has a diameter of 3′.
At the assumed distance of R CrB, the very extended IR shell extends about 8 105 AU from the star. The dust mass and total mass of this shell have previously been estimated to be 10-3–10-2 M☉ and 0.3 – 3 M☉, respectively (Gillett et al., 1986). They estimate that the dust temperature in the shell is 25-30 K. Rao & Nandy (1986) find a hot component close to the star with a dust mass of 5 10-7 M☉ and a cool component with a dust mass of 10-2 - 10-3 M☉.
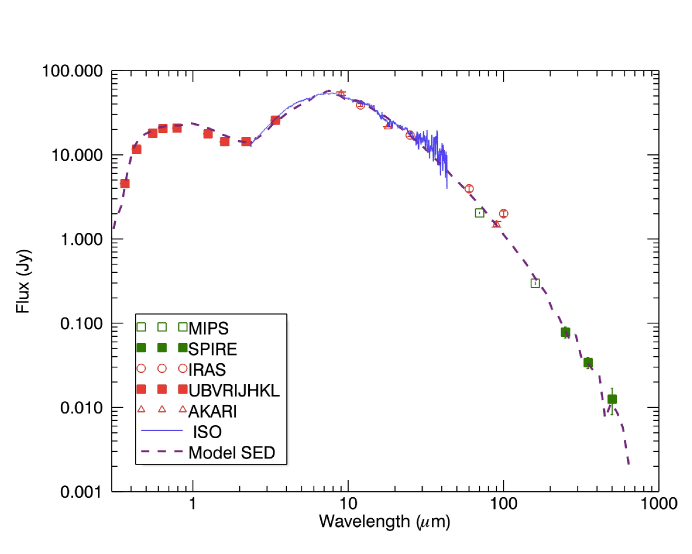
Photometry available from the literature for R CrB has been combined with new photometry using the MIPS and SPIRE images. The data, summarized in Table 2 and plotted in Figure 11, consist of visible photometry at maximum light, JHKL, as well as IRAS photometry (Walker, 1985; Rao & Nandy, 1986). AKARI/IRC and FIS photometry are also available (Murakami et al., 2007; Ishihara et al., 2010). Fluxes were extracted from SPIRE (250, 350, 500 µm) using Starfinder (Diolaiti et al., 2000). Starfinder produced PSF fitted photometry using PSFs which were downloaded from the Herschel Science Center. No aperture corrections were applied since the PSFs used were of sufficiently large diameter. Aperture photometry was also performed as a test of the Starfinder results. The photometric uncertainties quoted in Table 2 for SPIRE are 15%, or the Starfinder uncertainties plus calibration errors of 5% whichever is higher (Swinyard et al., 2010).
We have modeled the SED of R CrB using a Monte Carlo radiative transfer code which includes nonisotropic scattering, polarization, and thermal emission from dust in a spherical-polar grid (Whitney et al., 2003a, b; Robitaille et al., 2006). All of the models were done with amorphous carbon dust and an MRN size distribution (Mathis et al., 1977). We have assumed a mass gas-to-dust ratio of 100. The best fit to the R CrB SED is shown in Figure 11. A good fit was obtained to both the hotter dust centered on the star, as well as the cooler, large diffuse nebula. Heating by the interstellar radiation field is included. The best fitting model is a small disk surrounded by a large diffuse envelope. The disk has inner and outer radii of 42 and 150 AU, and the envelope has inner and outer radii of 1.3 and 8.8 105 AU. The envelope has a bipolar cavity carved out with an opening angle of 30∘. The AV through the envelope is quite low, less than 0.01 mag over a wide range of viewing angles (0∘-75∘). The disk dust mass is 3.5 10-6 M☉ and a total mass of 3.5 10-4 M☉. Assuming a density profile of r-2 which is appropriate for dust accelerated away from the star radially by radiation pressure, the dust mass of the outer envelope is 2 10-2 M☉ and the total mass (dust + gas) is 2 M☉. The gas may be dragged along with the dust or it may become decoupled.
3.4 The Evolution of R CrB and its Dust
The generally accepted model for dust formation in the RCB stars, the condensation of carbon dust along the line of sight, was suggested over 70 years ago (Loreta, 1935; O’Keefe, 1939; Clayton, 1996). The evolution of RCB star spectra and lightcurves during declines is consistent with dust that forms close to the stellar atmosphere and then is accelerated to hundreds of km s-1 by radiation pressure (Clayton et al., 1992; Whitney et al., 1993). If the dust forms near the star, it will accelerate very quickly, possibly reaching 200 km s-1 in 30 days. Other evidence supports a much slower expansion (e.g., Garcia-Hernandez et al., 2011, and references therein). The observed timescales for RCB dust formation fit in well with those calculated by carbon chemistry models (Feast, 1986; Woitke et al., 1996; Rao & Lambert, 2010).
The dust forming around R CrB is not in a complete shell but rather in small “puffs” (Clayton, 1996). When a puff forms along the line of sight to the star we see a decline. Estimates of the covering factor of the clouds around RCB stars during declines, from both extinction studies and IR re-emission of stellar radiation, indicate that f 0.5 (Feast et al., 1997; Clayton et al., 1999; Hecht et al., 1984, 1998). The typical puff causing a decline is thought to have a dust mass of 10-8 M☉ (Feast, 1986; Clayton et al., 1992). There is strong evidence that the puffs form in or near the surface of the RCB star due to density and temperature perturbations caused by stellar pulsations (Woitke et al., 1996; Crause et al., 2007). The RCB stars show regular or semi-regular pulsation periods in the 40-100 d range (Lawson et al., 1990). R CrB, itself, does not have one regular period but has shown periods of 40 and 51 d (Fernie & Lawson, 1993).
For this recent deep decline, with AV=9 mag, assuming the dust forms at 2 R⋆ (R⋆=85 R☉), and a puff subtends a fractional solid angle of 0.05, then the dust mass will be 10-8 M☉. The puff would be accelerated quickly by radiation pressure and would dissipate rapidly so dust must be formed continually by R CrB to maintain itself in a deep decline for 4 years. If a puff is formed during each pulsation period of 40 d, R CrB would be forming about 10-7 M☉ of dust per year. Assuming a gas-to-dust ratio of 100 (Whittet, 2003), the total mass loss per year is 10-5 M☉. The estimated masses of the puffs causing the declines and the cometary knots is similar. The puffs cause declines when they form directly in our line of sight and may be seen as cometary knots when they form to the side of or behind R CrB.
Little is known about the lifetime of the RCB phase. We have a lower limit from the fact that R CrB itself was discovered to have large brightness variations 200 years ago (Pigott & Englefield, 1797). Assuming a velocity of 20 km s-1 then the large diffuse dust shell around R CrB would take yr to form. If the mass-loss was more like the high-velocity winds seen in R CrB today (200 km s-1) then the shell would be about an order of magnitude younger (Clayton et al., 2003). If R CrB is the result of a final-helium-shell flash rather than a white-dwarf merger, then the size and timescales would be consistent with the nebulosity, now seen in far-IR emission, being a fossil PN shell. The nebulosity including cometary knots, seen around R CrB and UW Cen, shown in Figure 7, looks very much like a PN shell (Clayton et al., 1999, Clayton et al. 2011, in preparation).
Planetary Nebulae are a very late phase in the evolution of low and intermediate mass (1-8 M☉) stars. The PN, NGC 6302 is estimated to have an envelope with a total mass of 4.7 M☉ and a central star with a progenitor mass of 5.5 M☉ (Wright et al., 2011). So the estimate made here for the total envelope mass of R CrB is consistent with it being a fossil PN shell. Any gas lost during the white-dwarf merger would have far less mass. If the shell is an old PN shell then this would suggest that R CrB is the product of a final flash event rather than a white-dwarf merger. The estimated mass of the envelope is consistent with a mass-loss rate of 10-5 M☉ for about 105 yr.
Five Galactic RCB stars, including R CrB, itself, show significant Lithium in their atmospheres (Rao & Lambert, 1996; Asplund et al., 2000; Kipper & Klochkova, 2006). Renzini (1990) suggested that in a final flash the ingestion the burning of the H-rich envelope leads to Li-production through the Cameron-Fowler mechanism (Cameron & Fowler, 1971). The abundance of Li in the atmosphere of the final-flash star, Sakurai’s object, was actually observed to increase with time (Asplund et al., 1999). In a white-dwarf merger, the temperatures required for the production of 18O should destroy any Li present. So, the simultaneous enrichment of Li and 18O is not expected in the white-dwarf merger scenario. The abundance of 18O cannot be directly measured in R CrB, but it is overabundant in fluorine, which does imply a high 18O abundance (Pandey et al., 2008).
About 10% of single stars will undergo a final-flash event (Iben et al., 1996). About this percentage of RCB stars (R CrB, RY Sgr, V CrA, and UW Cen) show evidence of resolved fossil dust shells (Walker, 1994). R CrB is thought to be 0.8-0.9 M☉ from pulsation modeling (Saio, 2008), and this mass agrees well with the predicted mass of the merger products of a CO- and a He-WD (Han, 1998). On the other hand, final-flash stars, since they are single white dwarfs, should typically have masses of 0.55-0.6 M☉ (Bergeron et al., 2007).
4 Summary
New images were obtained of R CrB with Gemini/GMOS, HST/WFPC2, Spitzer/MIPS, and Herschel/SPIRE just before or during its recent very long and very deep decline. At visible wavelengths with Gemini and HST, the dust obscuring R CrB acts as a natural coronagraph, allowing material close to the star to be imaged for the first time. In particular, several cometary knots have been detected within a few thousand AU of the star. The puffs of dust that cause declines in R CrB and the cometary knots have similar inferred masses so they may be the same dust clouds seen in and out of the direct line of sight to the star. Also, the existence of a cluster of galaxies directly behind R CrB was revealed for the first time. The IR images confirm the existence of a very large diffuse shell (radius 4 pc) around R CrB that contains cool dust (25 K) which is detected out to 500 µm and has a total mass of 2 M☉. This places a possible upper limit on the lifetime of R CrB as an RCB of 105 yr. In addition, there is no significant mass of cold dust around R CrB that was missed by IRAS.
RCB stars are rare so they don’t contribute significantly to the interstellar medium, but their continual dust formation makes them ideal laboratories for understanding dust formation in evolved stars. In particular, both the RCB stars and Type Ia supernovae may be the product of a white dwarf merger (Wheeler, 1978; Webbink, 1984; Clayton et al., 2007; Kilic et al., 2010). So studies of the circumstellar environments of RCB stars may provide information on the material around Type Ia supernovae. It is possible that there are two avenues for producing RCB stars and that R CrB is a product of the final flash rather than the white-dwarf merger. But the evidence is mixed. The IR shell and the presence of lithium point toward a possible final flash, while the relatively high mass of R CrB and the presence of fluorine point to a WD merger.
References
- Alcock et al. (2001) Alcock et al. 2001, ApJ, 554, 298
- Asplund et al. (2000) Asplund, M., Gustafsson, B., Lambert, D. L., & Rao, N. K. 2000, A&A, 353, 287
- Asplund et al. (1999) Asplund, M., Lambert, D. L., Kipper, T., Pollacco, D., & Shetrone, M. D. 1999, A&A, 343, 507
- Bergeron et al. (2007) Bergeron, P., Gianninas, A., & Boudreault, S. 2007, in A. S. P. Conf. Ser., Vol. 372, 15th European Workshop on White Dwarfs, ed. R. Napiwotzki & M. R. Burleigh, 29
- Bright et al. (2011) Bright, S. N., Chesneau, O., Clayton, G. C., de Marco, O., Leão, I. C., Nordhaus, J., & Gallagher, J. S. 2011, MNRAS, 414, 1195
- Cameron & Fowler (1971) Cameron, A. G. W., & Fowler, W. A. 1971, ApJ, 164, 111
- Chevalier (1986) Chevalier, R. A. 1986, ApJ, 308, 225
- Clayton (1996) Clayton, G. C. 1996, PASP, 108, 225
- Clayton & Ayres (2001) Clayton, G. C., & Ayres, T. R. 2001, ApJ, 560, 986
- Clayton et al. (1997) Clayton, G. C., Bjorkman, K. S., Nordsieck, K. H., Zellner, N. E. B., & Schulte-Ladbeck, R. E. 1997, ApJ, 476, 870
- Clayton et al. (2003) Clayton, G. C., Geballe, T. R., & Bianchi, L. 2003, ApJ, 595, 412
- Clayton et al. (2007) Clayton, G. C., Geballe, T. R., Herwig, F., Fryer, C., & Asplund, M. 2007, ApJ, 662, 1220
- Clayton et al. (2005) Clayton, G. C., Herwig, F., Geballe, T. R., Asplund, M., Tenenbaum, E. D., Engelbracht, C. W., & Gordon, K. D. 2005, ApJ, 623, L141
- Clayton et al. (1999) Clayton, G. C., Kerber, F., Gordon, K. D., Lawson, W. A., Wolff, M. J., Pollacco, D. L., & Furlan, E. 1999, ApJ, 517, L143
- Clayton et al. (1992) Clayton, G. C., Whitney, B. A., Stanford, S. A., & Drilling, J. S. 1992, ApJ, 397, 652
- Cottrell et al. (1990) Cottrell, P. L., Lawson, W. A., & Buchhorn, M. 1990, MNRAS, 244, 149
- Cox (2000) Cox, A. N. 2000, Allen’s Astrophysical Quantities
- Crause et al. (2007) Crause, L. A., Lawson, W. A., & Henden, A. A. 2007, MNRAS, 375, 301
- de Laverny & Mékarnia (2004) de Laverny, P., & Mékarnia, D. 2004, A&A, 428, L13
- Diolaiti et al. (2000) Diolaiti, E., Bendinelli, O., Bonaccini, D., Close, L., Currie, D., & Parmeggiani, G. 2000, A&AS, 147, 335
- Dowell et al. (2010) Dowell, C. D., et al. 2010, in Society of Photo-Optical Instrumentation Engineers (SPIE) Conference Series, Vol. 7731, Society of Photo-Optical Instrumentation Engineers (SPIE) Conference Series
- Feast (1986) Feast, M. W. 1986, IAU Colloq. 87, 128, p. 151
- Feast et al. (1997) Feast, M. W., Carter, B. S., Roberts, G., Marang, F., & Catchpole, R. M. 1997, MNRAS, 285, 317
- Fernie & Lawson (1993) Fernie, J. D., & Lawson, W. A. 1993, MNRAS, 265, 899
- Garcia-Hernandez et al. (2011) Garcia-Hernandez, D. A., Kameswara Rao, N., & Lambert, D. L. 2011, ArXiv1107.1185
- García-Hernández et al. (2010) García-Hernández, D. A., Lambert, D. L., Kameswara Rao, N., Hinkle, K. H., & Eriksson, K. 2010, ApJ, 714, 144
- García-Segura et al. (2006) García-Segura, G., López, J. A., Steffen, W., Meaburn, J., & Manchado, A. 2006, ApJ, 646, L61
- Gillett et al. (1986) Gillett, F. C., Backman, D. E., Beichman, C., & Neugebauer, G. 1986, ApJ, 310, 842
- Gordon et al. (2005) Gordon, K. D., et al. 2005, PASP, 117, 503
- Griffin et al. (2008) Griffin, M., et al. 2008, in Society of Photo-Optical Instrumentation Engineers (SPIE) Conference Series, Vol. 7010, Society of Photo-Optical Instrumentation Engineers (SPIE) Conference Series
- Griffin et al. (2010) Griffin, M. J., et al. 2010, A&A, 518, L3
- Groenewegen et al. (2011) Groenewegen, M. A. T., et al. 2011, A&A, 526, 162
- Han (1998) Han, Z. 1998, MNRAS, 296, 1019
- Hecht et al. (1998) Hecht, J. H., Clayton, G. C., Drilling, J. S., & Jeffery, C. S. 1998, ApJ, 501, 813
- Hecht et al. (1984) Hecht, J. H., Holm, A. V., Donn, B., & Wu, C.-C. 1984, ApJ, 280, 228
- Henyey & Greenstein (1941) Henyey, L. G., & Greenstein, J. L. 1941, ApJ, 93, 70
- Iben et al. (1996) Iben, Jr., I., Tutukov, A. V., & Yungelson, L. R. 1996, ApJ, 456, 750
- Ishihara et al. (2010) Ishihara, D., et al. 2010, A&A, 514, A1
- Jeffers et al. (2011) Jeffers et al., J. V. 2011, A&A, Submitted
- Kilic et al. (2010) Kilic, M., Brown, W. R., Allende Prieto, C., Kenyon, S. J., & Panei, J. A. 2010, ApJ, 716, 122
- Kipper & Klochkova (2006) Kipper, T., & Klochkova, V. G. 2006, Baltic Astronomy, 15, 531
- Landolt & Clem (2010) Landolt, A. U., & Clem, J. L. 2010, PASP, 122, 541
- Lawson et al. (1990) Lawson, W. A., Cottrell, P. L., Kilmartin, P. M., & Gilmore, A. C. 1990, MNRAS, 247, 91
- Leão et al. (2007) Leão, I. C., de Laverny, P., Chesneau, O., Mékarnia, D., & de Medeiros, J. R. 2007, A&A, 466, L1
- Li & Draine (2001) Li, A., & Draine, B. T. 2001, ApJ, 554, 778
- Loreta (1935) Loreta, E. 1935, Astronomische Nachrichten, 254, 151
- Mathis et al. (1977) Mathis, J. S., Rumpl, W., & Nordsieck, K. H. 1977, ApJ, 217, 425
- Matsuura et al. (2009) Matsuura, M., et al. 2009, ApJ, 700, 1067
- Miville-Deschênes & Lagache (2005) Miville-Deschênes, M., & Lagache, G. 2005, ApJS, 157, 302
- Murakami et al. (2007) Murakami, H., et al. 2007, PASJ, 59, 369
- O’Dell & Handron (1996) O’Dell, C. R., & Handron, K. D. 1996, AJ, 111, 1630
- Ohnaka et al. (2003) Ohnaka, K., et al. 2003, A&A, 408, 553
- O’Keefe (1939) O’Keefe, J. A. 1939, ApJ, 90, 294
- Pandey et al. (2008) Pandey, G., Lambert, D. L., & Rao, N. K. 2008, ApJ, 674, 1068
- Pigott & Englefield (1797) Pigott, E., & Englefield, H. C. 1797, Royal Society of London Philosophical Transactions Series I, 87, 133
- Pilbratt et al. (2010) Pilbratt, G. L., et al. 2010, A&A, 518, L1
- Pittard et al. (2005) Pittard, J. M., Dyson, J. E., Falle, S. A. E. G., & Hartquist, T. W. 2005, MNRAS, 361, 1077
- Pollacco et al. (1991) Pollacco, D. L., Hill, P. W., Houziaux, L., & Manfroid, J. 1991, MNRAS, 248, 1P
- Rao & Lambert (1996) Rao, N. K., & Lambert, D. L. 1996, in Astronomical Society of the Pacific Conference Series, Vol. 96, Hydrogen Deficient Stars, ed. C. S. Jeffery & U. Heber, 43
- Rao & Lambert (2010) Rao, N. K., & Lambert, D. L. 2010, in Recent Advances in Spectroscopy Theoretical, Astrophysical and Experimental Perspectives, ed. R. K. Chaudhuri, M. V. Mekkaden, A. V. Raveendran, & A. Satya Narayanan , 177
- Rao & Nandy (1986) Rao, N. K., & Nandy, K. 1986, MNRAS, 222, 357
- Renzini (1990) Renzini, A. 1990, in Astronomical Society of the Pacific Conference Series, Vol. 11, Confrontation Between Stellar Pulsation and Evolution, ed. C. Cacciari & G. Clementini, 549
- Robitaille et al. (2006) Robitaille, T. P., Whitney, B. A., Indebetouw, R., Wood, K., & Denzmore, P. 2006, ApJS, 167, 256
- Saio (2008) Saio, H. 2008, in Astronomical Society of the Pacific Conference Series, Vol. 391, Hydrogen-Deficient Stars, ed. A. Werner & T. Rauch, 69
- Schlegel et al. (1998) Schlegel, D. J., Finkbeiner, D. P., & Davis, M. 1998, ApJ, 500, 525
- Stanford et al. (1988) Stanford, S. A., Clayton, G. C., Meade, M. R., Nordsieck, K. H., Whitney, B. A., Murison, M. A., Nook, M. A., & Anderson, C. M. 1988, ApJ, 325, L9
- Swinyard et al. (2010) Swinyard, B. M., et al. 2010, A&A, 518, L4
- Tisserand et al. (2009) Tisserand, P., et al. 2009, A&A, 501, 985
- Ueta et al. (2000) Ueta, T., Meixner, M., & Bobrowsky, M. 2000, ApJ, 528, 861
- van Marle et al. (2011) van Marle, A. J., Meliani, Z., Keppens, R., & Decin, L. 2011, ApJ, 734, L26
- Walker (1985) Walker, H. J. 1985, A&A, 152, 58
- Walker (1986) Walker, H. J. 1986, in Astrophysics and Space Science Library, Vol. 128, IAU Colloq. 87: Hydrogen Deficient Stars and Related Objects, ed. K. Hunger, D. Schoenberner, & N. Kameswara Rao, 407
- Walker (1994) —. 1994, CCP7 Newsletter, 21, 40
- Webbink (1984) Webbink, R. F. 1984, ApJ, 277, 355
- Weingartner & Draine (2001) Weingartner, J. C., & Draine, B. T. 2001, ApJ, 548, 296
- Wheeler (1978) Wheeler, J. C. 1978, ApJ, 225, 212
- Whitney et al. (1993) Whitney, B. A., Balm, S. P., & Clayton, G. C. 1993, in ASP Conf. Ser.: Luminous High-Latitude Stars, ed. D. D. Sasselov, Vol. 45, 115
- Whitney et al. (2003a) Whitney, B. A., Wood, K., Bjorkman, J. E., & Cohen, M. 2003a, ApJ, 598, 1079
- Whitney et al. (2003b) Whitney, B. A., Wood, K., Bjorkman, J. E., & Wolff, M. J. 2003b, ApJ, 591, 1049
- Whittet (2003) Whittet, D. C. B. 2003, Dust in the galactic environment, 2nd edn. (Bristol: Institute of Physics (IOP) Publishing)
- Woitke et al. (1996) Woitke, P., Goeres, A., & Sedlmayr, E. 1996, A&A, 313, 217
- Wright et al. (2011) Wright, N. J., Barlow, M. J., Ercolano, B., & Rauch, T. 2011, arXiv1107.4554W
| Date | Telescope | Instr. | Filters |
|---|---|---|---|
| 2007 April 14/15 | Spitzer | MIPS | 24, 70, 160 µm |
| 2009 March 23 | Gemini-S | GMOS | g′, r′, i′, z′, CaT |
| 2009 April 29 | HST | WFPC2 | F555W, F814W |
| 2009 December 27 | Herschel | SPIRE | 250, 350, 500 µm |
| Banda | Flux (Jy) | (Jy) |
|---|---|---|
| U | 4.53e+00 | 3.90e-02 |
| B | 1.16e+01 | 1.07e-01 |
| V | 1.79e+01 | 1.66e-01 |
| Rc | 2.05e+01 | 1.90e-01 |
| Ic | 2.07e+01 | 1.91e-01 |
| J | 1.77e+01 | 1.65e-01 |
| H | 1.43e+01 | 1.00e-01 |
| K | 1.43e+01 | 1.33e-01 |
| L | 2.56e+01 | 2.36e-01 |
| AKARI/9 | 5.30e+01 | 2.44e+00 |
| AKARI/18 | 2.15e+01 | 2.90e-02 |
| IRAS/12 | 3.89e+01 | 1.55e+00 |
| IRAS/25 | 1.71e+01 | 6.84e-01 |
| IRAS/60 | 3.94e+00 | 3.15e-01 |
| MIPS/70 | 2.03e+00 | 3.4E-02 |
| AKARI/90 | 1.49e+00 | 1.14e-01 |
| IRAS/100 | 2.00e+00 | 1.60e-01 |
| MIPS160 | 2.97E-01 | 9.36E-03 |
| SPIRE/250 | 7.81E-02 | 1.17E-02 |
| SPIRE/350 | 3.40E-02 | 5.10E-03 |
| SPIRE/500 | 1.25E-02 | 4.34E-03 |
| Knot | Grain | |||||
|---|---|---|---|---|---|---|
| erg cm-2 s-1 Å-1 | Model | ∘ | AU | M☉ | ||
| 1 | 723 | 261 | 0.1 m | 110 | 1500 | |
| MRN | 35 | 2500 | ||||
| 2 | 45 | 12 | 0.1 m | 70 | 4700 | |
| 3 | 32 | 4 | 0.01 m | varies | N/A | (1-3) |
| 0.001 m | varies | N/A | (1-5) | |||
| 6 | 0.1 m | 50 | 3000 | |||
| Halo | 15600 | 10600 | 1.0 m | N/A | 400 | |