The effects of dust on the optical and infrared evolution of SN 2004et
Abstract
We present an analysis of multi-epoch observations of the Type II-P supernova SN 2004et. New and archival optical spectra of SN 2004et are used to study the evolution of the H and [O i] 6300 Å line profiles between days 259 and 646. Mid-infrared imaging with Michelle on Gemini North and with all three instruments of the Spitzer Space Telescope was carried out between 2004 to 2010, supplemented by archival Spitzer data. We include Spitzer ‘warm’ mission photometry at 3.6 and 4.5 m obtained on days 1779, 1931 and 2151, along with ground-based and HST optical and near-infrared observations obtained between days 79 and 1803. Multi-wavelength light curves are presented, as well as opticalinfrared spectral energy distributions (SEDs) for multiple epochs. Starting from about day 300, the optical light curves provide evidence for an increasing amount of circumstellar extinction attributable to newly formed dust, with the additional extinction reaching 0.8–1.5 magnitudes in the -band by day 690. The overall SEDs were fitted with multiple blackbody components, in order to investigate the luminosity evolution of the supernova, and then with Monte Carlo radiative transfer models using smooth or clumpy dust distributions, in order to estimate how much new dust condensed in the ejecta. The luminosity evolution was consistent with the decay of 56Co in the ejecta up until about day 690, after which an additional emission source is required, in agreement with the findings of Kotak et al. (2009). Clumped dust density distributions consisting of 20% amorphous carbons and 80% silicates by mass were able to match the observed optical and infrared SEDs, with dust masses that increased from 8 M⊙ on day 300 to 1.5 M⊙ on day 690, still significantly lower than the values needed for core collapse supernovae to make a significant contribution to the dust enrichment of galaxies.
keywords:
Supernovae: individual: SN 2004et; circumstellar matter1 Introduction
Theoretical studies by Kozasa et al. (1989); Todini & Ferrara (2001); Nozawa et al. (2003); Bianchi & Schneider (2007) of dust formation in the ejecta of core-collapse supernovae (CCSNe) produced by massive stars suggested that they could each produce up to 0.1-1.0 solar masses of dust and thereby act as major sources of dust in galaxies. The discovery at submillimetre wavelengths of large quantities of dust in very young high redshift galaxies, (e.g. Bertoldi et al. 2003; Maiolino et al. 2004; Dwek et al. 2007) seemed to reinforce the case for massive star CCSNe as major dust contributors. However studies at infrared wavelengths of Type II CCSNe in the nearby Universe have to date not confirmed these dust production predictions. SN 1987A in the LMC condensed less than M⊙ of dust in its ejecta (Wooden et al. 1993; Ercolano et al. 2007), while SN 2003gd in M 74 produced less than a few M⊙ of new dust by day 499 (Sugerman et al. 2006; Meikle et al. 2007). For a number of other recent Type II CCSNe, estimates for the quantities of new dust formed in their ejecta have not exceeded 10-3 M⊙ (Andrews et al. 2010, 2011; Szalai et al. 2011; Meikle et al. 2011).
Kotak et al. (2009) studied the multi-wavelength evolution of the Type II-P SN 2004et, the eighth supernova to be discovered in the past century in the nearby spiral galaxy NGC 6946. We report here our own multi-wavelength observations and analysis of the dust production by this supernova. Following Li et al. (2005), we adopt an explosion date of 22.0 September 2004 (JD 2,453,270.5) as the day 0 epoch to which our observation dates are referenced. Section 2 provides a brief overview of previously published optical and infrared (IR) observations of SN 2004et. Section 3 describes the H and [O i] 6300 Å line profiles obtained from a sequence of optical spectra of SN 2004et, while Section 4 describes our mid-IR observations. The resulting mid-IR fluxes are presented in Section 4.2, together with a discussion of the mid-IR light curve evolution. Complementary photometric data, obtained by us at optical and near-infrared (NIR) wavelengths using the HST and Gemini North telescopes, are presented in Section 5. The spectral energy distributions (SEDs) of SN 2004et at different epochs are discussed in Section 6. This section includes blackbody fitting to the SEDs, allowing limits to be placed on the physical properties of the SN at the various epochs. Using Monte Carlo radiative transfer models, we estimate ejecta dust masses in Section 7. Finally, the results from our multi-epoch analysis of SN 2004et are summarised in Section 8, along with the implications for dust production by Type II SNe.
2 Previous studies of SN 2004et
2.1 Optical observations
Zwitter et al. (2004) reported that an echelle spectrum taken on 28 September 2004 showed a relatively featureless spectrum with very broad, low-contrast H emission, suggesting SN 2004et to be a Type II event. This was confirmed by a low-resolution spectrum taken on 1 October 2004 (Filippenko et al. 2004), which showed the P-Cygni profile of H to be dominated by the emission component, but that the other hydrogen Balmer lines had more typical P-Cygni profiles. The continuum was reported as quite blue but dropping off steeply shortwards of 4000 Å.
The V, R and I-band light curves showed SN 2004et to be a Type II-P (plateau) supernova (Li et al. 2005) but it exhibited some differences when compared with the typical Type II-P SN 1999em. Evolution was slower in the U and B bands, consistent with the (U – B) and (B – V) colour evolution, leading Li et al. (2005) to conclude that SN 2004et seemed to evolve more slowly than SN 1999em, especially in the violet part of the spectrum.
Extensive photometric and spectroscopic monitoring in the optical was carried out by Sahu et al. (2006) from days 8 to 541 after explosion. They confirmed the supernova to be of Type II-P based on the plateau observed in the VRI bands which lasted for 110 days after the explosion. From their light curve analysis, they determined that the SN was caught at a very early stage soon after the shock breakout, reaching a maximum -band magnitude 10 days after explosion. They also found that the decline rate of the light curve during the early nebular phase ( 180–310 days) was similar to the radioactive decay rate of 56Co, indicating that -ray trapping was efficient during this time, and estimated that 0.06 0.02 M⊙ of 56Ni was synthesised during the explosion of SN 2004et, in agreement with the subsequent estimates of Misra et al. (2007) and Maguire et al. (2010). Based on the plateau luminosity and duration and the mid-plateau expansion velocity, Sahu et al. (2006), Misra et al. (2007) and Maguire et al. (2010) have estimated explosion energies for SN 2004et in the range (0.88-1.20) erg.
2.2 Distance and reddening
There are many estimates in the literature for the distance to the host galaxy NGC 6946. Sahu et al. (2006) summarised a few of these and included the result from their own analysis of SN 2004et using the standard candle method of Nugent et al. (2006) for Type II-P supernovae, deriving an average distance of 5.6 Mpc. Herrmann et al. (2008) estimated a distance of 6.10.6 Mpc to NGC 6946 using the planetary nebula luminosity function. For consistency with our previous studies of SN 2002hh (Barlow et al. 2005; Welch et al. 2007) and SN 2008S (Wesson et al. 2010), we adopt the distance of 5.90.4 Mpc to NGC 6946 estimated by Karachentsev et al. (2000) from the brightest stars method.
From Schlegel et al. (1998), the foreground Galactic reddening towards SN 2004et is estimated to be E(B – V) = 0.34 mag. Zwitter et al. (2004) used the equivalent width of D 2 lines from their high-resolution echelle spectra to estimate a total reddening (Galactic host) towards the SN of E(B – V) = 0.41 mag. Sahu et al. (2006) used similar analysis with their lower-resolution spectra to obtain a comparable value of E(B – V) = 0.43 mag. We adopt a total reddening to SN 2004et of E(B – V) = 0.41 mag.
2.3 Evidence for dust production by SN 2004et
From their spectroscopic observations of the temporal evolution of the H and [] 6300, 6363 Å line profiles from days 277 to 465, Sahu et al. (2006) noted a blueshifting after day 300 of the emission peak of both features and a flattening of the H emission peak. This, together with a steepening of the light curve after day 320, they interpreted as indications of early dust formation in the ejecta of SN 2004et. Misra et al. (2007) also found that the rate of decline in the optical light curves accelerated between 320–386 days.
Fabbri, Sugerman & Barlow (2005) reported the day 64 detection of SN 2004et in all four Spitzer Infrared Array Camera (IRAC) bands, from 3.6 to 8.0 m, in Spitzer Infrared Nearby Galaxy Survey (SINGS) Legacy program archival images of NGC 6946 (see Section 4.1). Kotak et al. (2009) presented archival and their own Spitzer mid-IR observations of SN 2004et obtained up to day 1406, together with late-time optical spectra. They concluded that between days 300–795, the spectral energy distribution was comprised of three components – hot, warm and cold – each respectively due to emission from: optically thick gas; newly-formed, ejecta-condensed dust; and an IR echo from the interstellar medium of the host galaxy. They estimated that the mass of dust formed in the ejecta grew to a few times M⊙, located in co-moving clumps of fixed size. From their Spitzer Infrared Spectrometer (IRS) spectra, they reported the first spectroscopic evidence of silicate dust formed in the ejecta of a supernova, supported by the detection of strong but declining molecular SiO emission in the 8-m region. They interpreted the appearance of broad, box-shaped optical emission line profiles about 2 years post-explosion as due to the impact of the ejecta on the circumstellar medium of the progenitor star, resulting in the formation of a cool, dense shell to which they attributed responsibility for a later rise in the mid-IR emission from SN 2004et.
Maguire et al. (2010) reported optical and NIR photometric and spectroscopic observations of SN 2004et carried out from just after explosion to 500 days. Their NIR spectrum at day 306 showed a clear detection of the first overtone band of CO at 2.3 m, which they interpreted as being a signature of dust formation. By analysing the optical light curves in the early nebular phase, they found that the decline rates between days 136 and 296 were consistent with those expected from light curves powered by the radioactive decay of 56Co (assuming complete -ray trapping). However, between days 296 and 414 they found that these decline rates had steepened. They also noted a significant blueshift in the peak of the H emission line from days 300 to 464, in agreement with the results of Sahu et al. (2006). These results were interpreted as signatures of dust formation occurring post 300 days. Their very late time ( 1000 days) photometry showed a flattening of the optical and NIR light curves, which they mainly attributed to the interaction of the SN ejecta with the circumstellar medium (CSM), following the work of Kotak et al. (2009).
3 Optical spectroscopy of SN 2004et
| Date | Age | Telescope/ | Wavelength | Exp. | Program ID | Principal |
|---|---|---|---|---|---|---|
| [days] | instrument | range [Å] | time | Investigator | ||
| 2005-06-07 | 259 | HCT HFOSCa | 3500–7000; 5200–9200 | 1900 s | – | Sahu et al. (2006) |
| 2005-08-01 | 314 | HCT HFOSCa | 3500–7000; 5200–9200 | 1900 s | – | Sahu et al. (2006) |
| 2005-08-05 | 317 | Gemini GMOS-N | 3500–10000 | 3900 s | GN-2005B-Q-54 | G. Clayton |
| 2005-08-29 | 336 | TNG LRSb | 3890-8000 | 11800 s | AOT12 CAT-G109 | E. de la Rosa |
| 2005-10-17 | 391 | HCT HFOSCa | 3500–7000; 5200–9200 | 1900 s | – | Sahu et al. (2006) |
| 2005-10-31 | 404 | Gemini GMOS-N | 3500–10000 | 3900 s | GN-2005B-Q-54 | G. Clayton |
| 2005-11-23 | 428 | HCT HFOSCa | 3500–7000; 5200–9200 | 1900 s | – | Sahu et al. (2006) |
| 2006-06-30 | 646 | Subaru FOCUSc | 4670-8970 | 2900 s | S06A-152 | K. Kawabata |
-
a
Raw data, including calibration frames and flux standards, provided by the authors (Sahu et al. 2006).
-
b
Raw and calibration data were downloaded from the online TNG archive at http://ia2.oats.inaf.it/.
-
c
Raw and calibration data downloaded from the online Subaru Mitaka Okayama Kiso Archive (SMOKA) at http://smoka.nao.ac.jp/index.jsp.
As part of the SEEDS program, Gemini North spectroscopic observations of SN 2004et were obtained on 5 August and 31 October 2005, corresponding to 317 and 404 days after explosion. A log of these and the other H-region observations that we analyse here can by found in Table 1. We utilised GMOS-N equipped with a 075 slit width and the B600-G5303 grating in long-slit mode with a position angle of 296°. Three spectra were obtained during each epoch with identical exposure times of 900 s. The central wavelengths of the images were 5950, 5970, and 5990 Å, respectively, to allow for gap removal of the combined spectra. A 22 binning of the CCD pixels in the low gain setting was employed. All spectra were taken with adjacent GMOS baseline calibration flat exposures to correct for sensitivity gradients across the CCD, and CuAr spectra were utilised for the initial calibration of the dispersion solution.
Our GMOS-N spectra were reduced using the Gemini IRAF package. Pipeline processed calibration images were obtained from the Gemini Science Archive. The spectra were trimmed and then overscan, bias and flat-field corrected using the task gsreduce. Wavelength calibration solutions were determined from the CuAr lamp spectra using gswavelength, and the solution was applied to the SN 2004et spectra via gstransform. Object spectra were extracted using gsextract. The observations were not flux calibrated since our primary goal was to monitor the evolution of the line profiles.
Sahu et al. (2006) presented photometric and spectroscopic data for SN 2004et from approximately 8 to 541 days after the explosion. Their results showed a shift to the blue of the central peak of both H and [OI] 6300,6363 Å at late times. They concluded that this was indicative of new dust formed in the ejecta of SN 2004et. However, comparisons between the H profiles in our GMOS-N spectra and those at similar epochs in the archived calibrated spectra of Sahu et al. (2006), obtained from the Online Supernova Spectrum Archive (SUSPECT)111http://bruford.nhn.ou.edu/suspect, showed some inconsistencies, with their spectra showing clear blueshifting of the H emission line profile between days 314 and 391, while our own spectra showed little change between days 317 and 404. In order to help resolve this discrepancy, the Sahu et al. (2006) authors generously provided their raw data for SN 2004et for several of the epochs presented in their paper. This allowed us to reduce the respective sets of data in the same way. A description of the observational setup used by Sahu et al. (2006) can be found in their paper.
We also obtained two archival spectroscopic observations of SN 2004et, taken on days 336 and 646. The earlier epoch corresponds to an observation on 29 August 2005 taken with the Low Resolution Spectrograph on the 3.58-m Telecopio Nazionale Galileo (TNG) on La Palma. The latter epoch corresponded to an observation on 30 June 2006 with the Faint Object Camera and Spectrograph (FOCAS) on the 8.2-m Subaru telescope on Mauna Kea in Hawaii. The reduction procedure matched that carried out by us for the GMOS-N and Sahu et al. (2006) spectra.
Since our goal was to self-consistently align a number of spectra taken with four different instrument/telescope setups, we did not rely solely on the initial wavelength calibrations. During the extraction of each SN spectrum, a sky spectrum was also extracted that was ultimately subtracted from the SN spectrum. Since the sky and SN spectra possessed identical wavelength calibrations, we derived corrections to the initial wavelength calibrations of each of the SN spectra using the strong and narrow [] 5577 Å and 6300 Å sky emission lines.
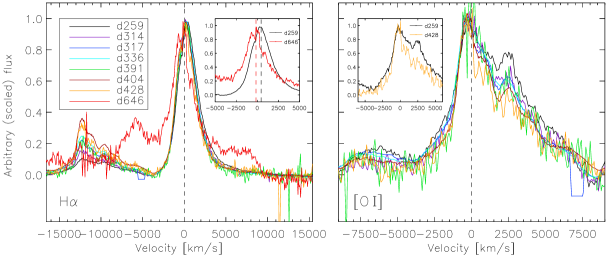
The temporal evolution of the H profile between days 259 and 646, following our re-analysis of the combined set of spectra, is depicted in the left-hand panel of Figure 1. The spectra are displayed in velocity space, with the continua subtracted and the peaks of the emission line normalised to approximately unity. The inset shows a close-up view of the earliest and latest H profiles, obtained just over a year apart at days 259 and 646, to highlight the overall blueshifting of the profile during this time. The dashed lines in the inset indicate the line peak centres measured on days 259 and 646, with the blueshifting of the latter profile providing strong evidence for the formation of dust in the ejecta during the intervening period, as described by Lucy et al. (1989) for SN 1987A.
The H line profiles presented by Sahu et al. (2006) showed a significant blueshifting with time of the emission peak, amounting to a few hundred km s-1, with the largest shift appearing to occur between days 277 and 314. Sahu et al. (2006) did not quantify the shifts in their H profiles, beyond stating that a blueshift in the emission peak was clearly seen after day 300 in their day 277-465 H (and [] 6300,6363 Å) profiles. Kotak et al. (2009) confirmed this from their own analysis of the Sahu et al. (2006) spectra, reporting a shift of 400 km s-1 in the whole H profile between days 301 and 314, but little sign of a progressive blueshifting during the subsequent day 314–465 period. Using the Sahu et al. (2006) spectra, along with additional spectra, Maguire et al. (2010) found that the peak of the H emission line was at +280 50 km s-1 between days 163 and 300, but from days 314 to 464 showed a constant blueshift, to 137 km s-1.

We have used our recalibrated spectral dataset to measure the wavelength of peak H emission in each of the profiles plotted in Figure 1. The evolution of the peak wavelength is shown in Figure 2. The line peaks show an overall blueshifting between days 259 and 646 of 13.2 Å, corresponding to a velocity shift of 600 km s-1. Between days 259 and 314 we measure an initial blueshift of 3 Å ( 140 km s-1), not as large as the 400 km s-1 shift between days 301 and 314 measured by Kotak et al. (2009) from the Sahu et al. (2006) spectra in the SUSPECT archive. While we find little change between days 314/317 and day 391 in the measured emission line peaks in the recalibrated spectral dataset (Figure 2), between days 404 and 428 we measure a blueshifting of the emission peak by 4 Å (185 km s-1). followed by a further blueshifting of 4.5 Å (205 km s-1) between the spectra obtained at days 428 and 646. We therefore find that the majority of the blueshifting occurred after day 391.
Whilst there is no strong evidence for a developing line asymmetry in the earlier epoch H profiles (Figure 1), a diminution of the red wing can be discerned by days 428 and 646. By day 646 a significant blueshifting ( 4.5 Å) of the whole profile since day 428 is evident, with multiple peaks evident at the centre of the profile, although there are earlier inflections in the blue wing of the H profiles. Two broad features either side of the main emission line (at 7000 and 6000 km s-1) have appeared by day 646. Kotak et al. (2009) presented three later optical spectra of SN 2004et, obtained with the Keck telescopes on days 823, 933 and 1146, which show similarities to, and a development of, the Subaru day 646 H profile. They described the H profile from the late-time Keck spectra as having a steep-sided, box-like component, with a half width at zero intensity (HWZI) of 8500 km s-1and noted that the characteristic ejecta profile of H seen in the Sahu et al. (2006) spectra may still be present at days 823 and 933, with a HWZI of 2000 km s-1, but that its presence at day 1146 was less certain.
The 6300 and 6363 Å lines of [O i] can be seen in emission on the blue side of the H profiles plotted in Figure 1. In the right-hand panel of Figure 1, we have plotted the [O i] 6300-Å velocity profiles for days 259 through to 428 (the day 646 profile had too low a signal to noise). The inset compares the day 259 and day 428 [O i] profiles, showing a clear diminution of the red wing of the day 428 profile relative to day 259.
4 Mid-infrared observations
4.1 Gemini-Michelle and Spitzer photometry
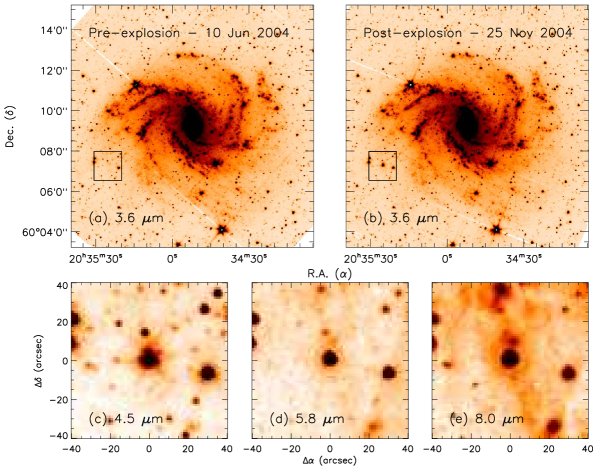
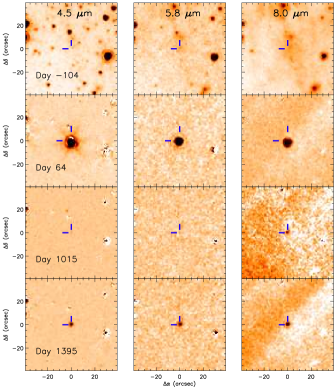
NGC 6946, the host galaxy of SN 2004et, was observed with Spitzer by the SINGS Legacy program (Kennicutt et al. 2003) between June and November 2004, such that the region of the SN was serendipitously imaged pre- and post-explosion. Figure 3 shows the position of the SN in relation to its host galaxy NGC 6946 in the pre- and post-explosion SINGS IRAC images, together with a closer view of the SN region in the different IRAC wavebands.
SN 2004et was clearly detected in the SINGS IRAC image at day 64 and was subsequently monitored with IRAC, MIPS and the IRS Peak-Up Imaging (PUI) module via our Spitzer GO programs during Cycles 2, 3, 4, 6 and 7 (Cycle 6 was the beginning of the Spitzer ‘warm’ mission, in which the observatory operates using only the 3.6 and 4.5 m IRAC channels). Archival Spitzer data for the SN from Cycles 2 and 3 were also downloaded to provide a more complete time-sample of the SN’s mid-IR evolution. In summary, post-explosion mid-IR observations of SN 2004et were taken between November 2004 and August 2010, corresponding to an age range of 64 to 2151 days. With the Spitzer Space Telescope, there are 12 epochs of observations in each of the four IRAC wavebands, with a further three epochs of IRAC observations during the ‘warm’ mission in just the 3.6- and 4.5-m channels. There are 8 epochs of IRS PUI observations at 16 m, and 9 epochs of MIPS 24-m observations. Of the 33 individual Spitzer observations listed in Table 2, the first 3 were obtained by the SINGS Legacy program, 5 were obtained by programs led by PIs Meikle and Kotak and 25 were obtained by our SEEDS program.
In addition to the Spitzer mid-IR observations, broad-band N′ photometry at 11.2 m was obtained with Michelle on Gemini-North during 2005, 2006, 2007 and 2008, consisting of six observations at the 4 epochs. A time-ordered list of all the Spitzer and Michelle mid-IR observations of SN 2004et is provided in Table 2. The listed exposure time is the total time spent on-source. The final column provides a key to the list of observing programs from which these data were obtained; the program number and principal investigator are detailed in a footnote to the table. Data retrieved from the archive are marked as such. Appendix A.1 describes how the mid-IR data were processed.
| UT date | Age | Detector | eff | FoV | Pixel scale | Exp. time | Ref. |
|---|---|---|---|---|---|---|---|
| [days] | [m] | [′ ′] | [″/pixel] | [s] | |||
| 2004-06-10 | -104 | IRAC | 3.6/4.5/5.8/8.0 | 5.2 5.2 | 1.2 | 107.2 | \tnotens[1] |
| 2004-07-09 | -75 | MIPS | 24.0 | 5.4 5.4 | 1.5 | 161.5 | \tnotens[1] |
| 2004-11-25 | 64 | IRAC | 3.6/4.5/5.8/8.0 | 5.2 5.2 | 1.2 | 107.2 | \tnotens[1] |
| 2005-07-13 | 294 | IRS-PUI | 16.0 | 1.0 1.2 | 1.2 | 629.2 | \tnotens[2] |
| 2005-07-19 | 300 | IRAC | 3.6/4.5/5.8/8.0 | 5.2 5.2 | 0.75 | 14.4 | \tnotens[3] |
| 2005-07-30 | 311 | Michelle | 11.2 (N′) | 0.5 0.4 | 0.1 | 1081.9 | \tnotens[4] |
| 2005-08-03 | 315 | MIPS | 24.0 | 5.4 5.4 | 0.75 | 140.0 | \tnotens[3] |
| 2005-09-17 | 360 | IRAC | 3.6/4.5/5.8/8.0 | 5.2 5.2 | 0.75 | 14.4 | \tnotens[3] |
| 2005-09-24 | 367 | MIPS | 24.0 | 5.4 5.4 | 0.75 | 140.0 | \tnotens[3] |
| 2005-11-02 | 406 | IRAC | 3.6/4.5/5.8/8.0 | 5.2 5.2 | 0.75 | 536.0 | \tnotens[2] |
| 2005-12-22 | 456 | IRS-PUI | 16.0 | 1.0 1.2 | 1.2 | 629.2 | \tnotens[2] |
| 2005-12-30 | 464 | IRAC | 3.6/4.5/5.8/8.0 | 5.2 5.2 | 0.75 | 14.4 | \tnotens[3] |
| 2006-01-11 | 476 | MIPS | 24.0 | 5.4 5.4 | 0.75 | 140.0 | \tnotens[3] |
| 2006-05-12 | 597 | Michelle | 11.2 (N′) | 0.5 0.4 | 0.1 | 811.4 | \tnotens[5] |
| 2006-05-14 | 599 | Michelle | 11.2 (N′) | 0.5 0.4 | 0.1 | 376.3 | \tnotens[5] |
| 2006-08-04 | 681 | IRS-PUI | 16.0 | 1.0 1.2 | 1.2 | 629.2 | \tnotens[6] |
| 2006-08-13 | 690 | IRAC | 3.6/4.5/5.8/8.0 | 5.2 5.2 | 0.75 | 14.4 | \tnotens[7] |
| 2006-09-01 | 709 | MIPS | 24.0 | 5.4 5.4 | 0.75 | 140.0 | \tnotens[7] |
| 2006-09-10 | 718 | IRS-PUI | 16.0 | 1.0 1.2 | 1.2 | 56.6 | \tnotens[7] |
| 2006-12-29 | 828 | IRAC | 3.6/4.5/5.8/8.0 | 5.2 5.2 | 0.75 | 124.8 | \tnotens[7] |
| 2007-01-21 | 851 | MIPS | 24.0 | 5.4 5.4 | 0.75 | 420.0 | \tnotens[7] |
| 2007-01-27 | 857 | IRS-PUI | 16.0 | 1.0 1.2 | 1.2 | 132.1 | \tnotens[7] |
| 2007-06-26 | 1007 | IRS-PUI | 16.0 | 1.0 1.2 | 1.2 | 283.1 | \tnotens[7] |
| 2007-07-03 | 1015 | IRAC | 3.6/4.5/5.8/8.0 | 5.2 5.2 | 0.75 | 321.6 | \tnotens[7] |
| 2007-07-09 | 1020 | Michelle | 11.2 (N′) | 0.5 0.4 | 0.1 | 1999.2 | \tnotens[8] |
| 2007-07-10 | 1021 | MIPS | 24.0 | 5.4 5.4 | 0.75 | 420.0 | \tnotens[7] |
| 2007-08-02 | 1044 | IRS-PUI | 16.0 | 1.0 1.2 | 1.2 | 283.1 | \tnotens[9] |
| 2007-08-12 | 1054 | IRAC | 3.6/4.5/5.8/8.0 | 5.2 5.2 | 0.75 | 321.6 | \tnotens[9] |
| 2007-08-27 | 1069 | MIPS | 24.0 | 5.4 5.4 | 0.75 | 420.0 | \tnotens[9] |
| 2007-12-09 | 1173 | IRS-PUI | 16.0 | 1.0 1.2 | 1.2 | 283.1 | \tnotens[9] |
| 2007-12-27 | 1191 | IRAC | 3.6/4.5/5.8/8.0 | 5.2 5.2 | 0.75 | 321.6 | \tnotens[9] |
| 2008-01-07 | 1202 | MIPS | 24.0 | 5.4 5.4 | 0.75 | 420.0 | \tnotens[9] |
| 2008-01-17 | 1212 | IRS-PUI | 16.0 | 1.0 1.2 | 1.2 | 1258.4 | \tnotens[10] |
| 2008-06-21 | 1368 | Michelle | 11.2 (N′) | 0.5 0.4 | 0.1 | 1928.6 | \tnotens[11] |
| 2008-07-09 | 1386 | Michelle | 11.2 (N′) | 0.5 0.4 | 0.1 | 2257.9 | \tnotens[12] |
| 2008-07-18 | 1395 | IRAC | 3.6/4.5/5.8/8.0 | 5.2 5.2 | 0.75 | 321.6 | \tnotens[9] |
| 2008-07-29 | 1406 | MIPS | 24.0 | 5.4 5.4 | 0.75 | 420.0 | \tnotens[9] |
| 2009-08-06 | 1779 | IRAC | 3.6/4.5 | 5.2 5.2 | 0.75 | 1161.6 | \tnotens[13] |
| 2010-01-05 | 1931 | IRAC | 3.6/4.5 | 5.2 5.2 | 0.75 | 1161.6 | \tnotens[13] |
| 2010-08-13 | 2151 | IRAC | 3.6/4.5 | 5.2 5.2 | 0.75 | 1161.6 | \tnotens[14] |
-
[1]
Spitzer Cycle 1 SINGS Legacy program 00159, PI: Kennicutt.
-
[2]
Archival data, Spitzer Cycle 2 GO program 20256, PI: Meikle
-
[3]
This paper, Spitzer Cycle 2 GO program 20320, PI: Sugerman.
-
[4]
This paper, Gemini semester 05A program GN-2005A-Q-20, PI: Barlow.
-
[5]
This paper, Gemini semester 06A program GN-2006A-Q-1, PI: Barlow.
-
[6]
Archival data, Spitzer Cycle 3 GO program 30292, PI: Meikle.
-
[7]
This paper, Spitzer Cycle 3 GO program 30494, PI: Sugerman.
-
[8]
This paper, Gemini semester 07A program GN-2007A-Q-5, PI: Barlow.
-
[9]
This paper, Spitzer Cycle 4 GO program 40010, PI: Meixner.
-
[10]
Archival data, Spitzer Cycle 4 GO program 40619, PI: Kotak.
-
[11]
This paper, Gemini semester 07B program GN-2007B-Q-4, PI: Barlow.
-
[12]
This paper, Gemini semester 08B program GN-2008B-Q-44, PI: Barlow.
-
[13]
This paper, Spitzer Cycle 6 GO program 60071, PI: Andrews. Cycle 6 took place during the Spitzer ‘warm’ mission following completion of the cryogenic mission. Only IRAC 3.6 and 4.5 m channels were available, with expected sensitivity unchanged from performance in the cryogenic mission.
-
[14]
This paper, Spitzer Cycle 7 GO program 70008, PI: Andrews, Spitzer ‘warm’ mission.
| UT date | Age | Flux density1 / upper limits2 [Jy] | |||||||||||||||||||||||
|---|---|---|---|---|---|---|---|---|---|---|---|---|---|---|---|---|---|---|---|---|---|---|---|---|---|
| [days] | |||||||||||||||||||||||||
| IRAC3 | Michelle N′ | IRS-PUI3 | MIPS3 | ||||||||||||||||||||||
| 3.6 m | 4.5 m | 5.8 m | 8.0 m | 11.2 m | 16 m | 24 m | |||||||||||||||||||
| 2004-06-10 | -104 | 83.8 10.2 | 45.4 8.3 | 178 25 | 412 51 | ||||||||||||||||||||
| 2004-07-09 | -75 | 376 25 | |||||||||||||||||||||||
| 2004-11-25 | 64 | 17490 532 | 13038 745 | 10046 179 | 6020 91 | ||||||||||||||||||||
| 2005-07-13 | 294 | 930 33 | |||||||||||||||||||||||
| 2005-07-19 | 300 | 726 61 | 3151 97 | 1291 218 | 2162 154 | ||||||||||||||||||||
| 2005-07-30 | 311 | 1700 200 | |||||||||||||||||||||||
| 2005-08-03 | 315 | 832 75 | |||||||||||||||||||||||
| 2005-09-17 | 360 | 430 71 | 1728 88 | 935 285 | 1731 156 | ||||||||||||||||||||
| 2005-09-24 | 367 | 735 74 | |||||||||||||||||||||||
| 2005-11-02 | 406 | 315 21 | 1045 21 | 707 79 | 1500 77 | ||||||||||||||||||||
| 2005-12-22 | 456 | 890 32 | |||||||||||||||||||||||
| 2005-12-30 | 464 | 174 67 | 656 77 | 606 293 | 952 162 | ||||||||||||||||||||
| 2006-01-11 | 476 | 686 89 | |||||||||||||||||||||||
| 2006-05-12/14 | 597/599 | 650 | |||||||||||||||||||||||
| 2006-08-04 | 681 | 670 34 | |||||||||||||||||||||||
| 2006-08-13 | 690 | 49 | 45.9 15.3 | 115 38 | 342 114 | ||||||||||||||||||||
| 2006-09-01 | 709 | 663 77 | |||||||||||||||||||||||
| 2006-09-10 | 718 | 562 30 | |||||||||||||||||||||||
| 2006-12-29 | 828 | 45 | 29.4 9.8 | 87 | 145 48 | ||||||||||||||||||||
| 2007-01-21 | 851 | 513 54 | |||||||||||||||||||||||
| 2007-01-27 | 857 | 446 31 | |||||||||||||||||||||||
| 2007-06-26 | 1007 | 324 29 | |||||||||||||||||||||||
| 2007-07-03 | 1015 | 23 | 14.1 4.7 | 83 | 113 37 | ||||||||||||||||||||
| 2007-07-09 | 1020 | 400 | |||||||||||||||||||||||
| 2007-07-10 | 1021 | 644 48 | |||||||||||||||||||||||
| 2007-08-02 | 1044 | 366 35 | |||||||||||||||||||||||
| 2007-08-12 | 1054 | 34 | 15.1 5.0 | 78 | 115 38 | ||||||||||||||||||||
| 2007-08-27 | 1069 | 610 49 | |||||||||||||||||||||||
| 2007-12-09 | 1173 | 1023 33 | |||||||||||||||||||||||
| 2007-12-27 | 1191 | 52.5 17.5 | 189 10 | 345 75 | 458 73 | ||||||||||||||||||||
| 2008-01-07 | 1202 | 1276 42 | |||||||||||||||||||||||
| 2008-01-17 | 1212 | 1055 31 | |||||||||||||||||||||||
| 2008-06-21 | 1368 | 1036 212 | |||||||||||||||||||||||
| 2008-07-09 | 1386 | 1016 224 | |||||||||||||||||||||||
| 2008-07-18 | 1395 | 76.3 22.6 | 258 11 | 465 49 | 578 82 | ||||||||||||||||||||
| 2008-07-29 | 1406 | 1563 54 | |||||||||||||||||||||||
| 2009-08-064 | 1779 | 17.3 7.6 | 113 8 | ||||||||||||||||||||||
| 2010-01-054 | 1931 | 14.4 6.9 | 90.3 16.8 | ||||||||||||||||||||||
| 2010-08-134 | 2151 | 7.2 3.0 | 76.7 5.3 | ||||||||||||||||||||||
| Pre-explosion | 83.8 10.2 | 45.4 8.3 | 178 25 | 412 51 | 221 22 | 376 25 | |||||||||||||||||||
-
1
All post-explosion flux densities were measured with PSF-fitted photometry (using IRAF daophot). Pre-explosion IRAC and MIPS fluxes were measured in an aperture of radius 5″ with sky annuli at inner radius 75 and outer radius 10″ respectively, using a 2- clipped-mean sky algorithm (using IRAF phot).
-
2
Flux upper limits for the non-detections in the Gemini-Michelle data are 3- values based on the standard deviation of the background in the region of the SN position scaled to a diffraction-limited size aperture.
-
3
Spitzer IRAC, MIPS and IRS-PUI data have had pre-explosion flux levels subtracted: IRAC and MIPS by use of difference imaging techniques to subtract pre-explosion SINGS images, and IRS-PUI by estimating the pre-explosion level from blackbody fits to the SED at day 1015 (see text). Measured (IRAC and MIPS) and estimated (IRS-PUI) pre-explosion fluxes at the position of the SN are summarised in the last row of the table.
-
4
Observations at days 1779, 1931 and 2151 were obtained during the Spitzer ‘warm’ mission, where only IRAC 3.6 and 4.5 m channels were available.
4.2 Evolution of the mid-IR emission
Table 3 lists the complete set of Spitzer and Gemini mid-infrared flux densities and associated uncertainties/upper-limits of SN 2004et from days 64 to 2151 as determined from the PSF-fitting techniques described by Fabbri (2011). Spitzer IRAC, MIPS and IRS-PUI data have had pre-explosion flux levels subtracted. Measured (IRAC and MIPS) and estimated (PUI) pre-explosion flux densities at the position of the SN are summarised in the last row of the table.
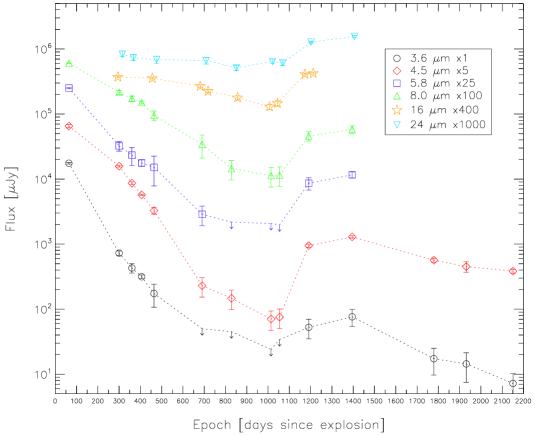
The IRAC, PUI 16-m and MIPS 24-m light curves (with pre-explosion levels subtracted) are shown in Figure 4. For clarity, the different light curves have been arbitrarily shifted by the factors shown. Upper limits to the flux densities at 3.6 m and 5.8 m are indicated by the downward pointing arrows. Each waveband demonstrates the decline in brightness from the earliest epochs to around day 800 when the SN has faded or is fading to its faintest levels. At 3.6 m and 5.8 m, the upper limits measured from the difference images indicate that the SN faded to below background levels for 200 days. The distinctive rise in brightness after this time ( 1000 days) is evident in all wavebands. The latest Spitzer data at days 1779, 1931 and 2151 were obtained during the post-cryogenic phase of the mission, where only the shortest wavelength IRAC channels at 3.6 and 4.5 m were available. They show that sometime between days 1395 and 1779, the mid-IR brightness of the SN at 3.6 and 4.5 m began to decline again, continuing with a slower decline to day 2151. The 3.6 m flux at day 2151 is about 9 % higher than the pre-explosion level, whilst the 4.5-m flux at the latest epoch is a factor of 2.7 brighter than the pre-explosion level. Whilst the 3.6 m flux densities at days 1779 to 2151 are lower than the upper limits between days 690 and 1015, the on-source integration times for the later observations were between factors of 3 and 80 longer than those for the earlier observations. The corresponding increase in signal-to-noise for the IRAC ‘warm’ images, together with difference imaging techniques, allowed the SN to be reliably detected at deeper levels than for previous observations with shorter exposure times when the SN was also faint.
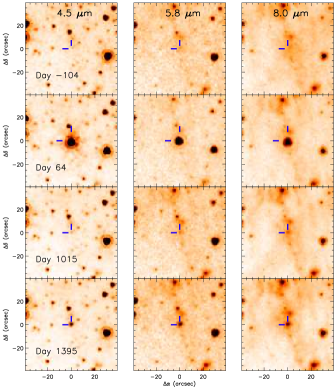
A selection of pre- and post-explosion IRAC images at 4.5 m, 5.8 m and 8.0 m are shown in Figure 5, depicting the mid-infrared evolution of SN 2004et. The supernova position is shown in the pre-explosion SINGS images at day -104 revealing evidence of extended emission in this region. The first mid-IR images of the SN, obtained 64 days after explosion (second row of figure), showed the SN to be very bright. This was during the photospheric plateau phase which characterises Type II-P supernovae, where hot blackbody emission dominates the optical emission and its Rayleigh-Jeans tail extends into the infrared. By day 1015 (third row), it can be seen that the SN has faded to almost pre-explosion levels, but a late rise in brightness is clearly evident by day 1395. Comparable difference images depicting the net mid-IR emission at the SN position for the same epochs are also shown in Figure 5. The rightmost three boxes in the top row again show the pre-explosion images at day -104, which were used as the reference images for subtraction from the post-explosion images, to yield the difference images shown in the remaining panels. At day 1015 when the SN has faded to its faintest levels, a detection at 4.5 m can just be discerned. For the same epoch at 5.8 m, whilst there is positive emission coincident with the position of the SN, this is at a similar level to the average noise levels in the residual background of the difference image and is therefore considered to be a non-detection for which an upper limit to the flux is derived. The SN is much more clearly detected in the 8.0-m difference image at day 1015, although the irregular residual background, seen as diagonal bands across all of the difference images as this wavelength, creates relatively large uncertainties in the final measured flux.
For the 16-m Spitzer-PUI data, the pre-explosion flux estimated by Kotak et al. (2009) was 56 % higher than that used here and so we obtain generally higher post-explosion fluxes than those presented by Kotak et al. (2009). The factor by which our post-explosion fluxes exceed those of Kotak et al. (2009) varies from 1.1 to 3.3. The largest differences in the photometry occur for days 1007–1044, when the SN was close to its faintest levels in this waveband. During the final epochs observed (days 1212–1173), when the rebrightening was strongest, the fluxes agree to within 10%.
For the 24-m Spitzer-MIPS data, Kotak et al. (2009) measured the flux in the two SINGS pre-explosion images observed at days -75 and -73, as processed with the standard Spitzer pipeline. They found the flux at day -75 to be a factor of almost 1.3 higher than that at day -73. From these they measured an average pre-explosion flux which is almost 40 % lower than the pre-explosion flux measured here. As discussed in Section A.1, the pre-explosion MIPS image used here for the analysis of SN 2004et was the SINGS enhanced mosaic from their 5th data delivery, which combined data from both dates. We found a flux consistent with that of Kotak et al. (2009) at day -73 but at day -75 we measured the flux to be about a factor of 1.7 higher. We also measured the fluxes of a number of nearby isolated point sources that were present in both images. No systematic offset was found, with the photometry differing by no more than 1-10%.
Despite measuring a higher pre-explosion flux than Kotak et al. (2009) at 24 m, we find that photometry from our difference images yielded generally higher post-explosion fluxes than theirs. Different techniques/software were used to produce the final difference images, which may have resulted in different background residuals affecting the photometry. In addition, Kotak et al. (2009) used aperture photometry to measure their fluxes, whereas we used PSF-fitting. A comparison between results from aperture photometry and PSF-fitting is presented by Fabbri (2011). In addition, different techniques may have been used to interpolate the 16- and 24-m data to the IRAC epochs used for the SED analysis.
5 Optical and near-infrared photometry
5.1 The observations
Optical and NIR photometric observations of SN 2004et were obtained as part of the SEEDS program over the years 2004 to 2009, spanning 79–1803 days after explosion.
The first two epochs of optical photometry were obtained during the plateau phase of the SN at days 79 and 89 with the 32-inch Tenagra II telescope in Arizona. A further three epochs of optical photometry were obtained during the nebular phase between days 317 and 664 with the Gemini Multi-Object Spectrograph on Gemini-North (GMOS-N) in Hawaii. In addition, an archival flux-calibrated Subaru spectrum was used to obtain optical photometry at day 646 by integrating over the filter transmission curves. Two epochs of late-time, high resolution observations of the SN field were obtained with the HST Wide Field Planetary Camera 2 (WFPC2) around three years after explosion at days 1054 and 1215. A final epoch of optical photometry, almost 4 years after explosion, was obtained with GMOS-N at day 1412.
The first epoch of NIR photometry was obtained at day 268 with the 2.3-m Bok telescope, part of the Steward Observatory at Kitt Peak, Arizona. This was followed by three epochs of data from the Near InfraRed Imager (NIRI) on Gemini-North at dates close in time to the optical images taken with GMOS-N during the nebular phase. Late-time, high-resolution data was obtained with the HST Near Infrared Camera and Multi-Object Spectrometer 2 (NICMOS2), at epochs corresponding to those of the optical WFPC2 data. A final -band image was taken approximately 5 years (day 1803) after explosion with the WIYN High-resolution InfraRed Camera: WHIRC (Meixner et al. 2010), on the WIYN 3.5-m telescope at Kitt Peak, Arizona.
Table 4 provides a complete log of the optical and NIR photometric observations of SN 2004et taken as part of the SEEDS project. Appendix A.2 describes how the optical and near-IR data were processed, while Appendix A.3 describes our late-time HST optical and near-IR images which revealed the single point source seen at the SN position in IRAC images to be comprised of at least three sources.
| Date | Age | Telescope/ | Filters | Exp. time | Program ID | Principal |
|---|---|---|---|---|---|---|
| [days] | instrument | Investigator | ||||
| 2004-12-10 | 79 | Tenagra II 32” | 9100 s | – | D. Welch | |
| 2004-12-20 | 89 | Tenagra II 32” | 9100 s | – | D. Welch | |
| 2005-06-17 | 268 | Bok 2.3m IR Camera | 2030 s | – | K. Gordon | |
| 2005-08-05 | 317 | Gemini GMOS-N | 160 s | GN-2005B-Q-54 | G. Clayton | |
| 2005-08-05 | 317 | Gemini NIRI | 2230 s | GN-2005B-Q-54 | G. Clayton | |
| 2005-10-17 | 390 | Gemini NIRI | 1030 s | GN-2005B-Q-54 | G. Clayton | |
| 2005-10-31 | 404 | Gemini GMOS-N | 160 s | GN-2005B-Q-54 | G. Clayton | |
| 2006-07-06 | 652 | Gemini NIRI | 2230 s | GN-2006A-Q-52 | G. Clayton | |
| 2006-07-18 | 664 | Gemini GMOS-N | 160 s | GN-2006A-Q-52 | G. Clayton | |
| 2007-07-08 | 1019 | HST WFPC2 | F606W,F814W | 4400 s | GO11229 | M. Meixner |
| 2007-07-08 | 1019 | HST NICMOS2 | F110W,F205W | 5128 s | GO11229 | M. Meixner |
| 2007-07-08 | 1019 | HST NICMOS2 | F160W | 4128 s | GO11229 | M. Meixner |
| 2008-01-20 | 1215 | HST WFPC2 | F606W,F814W | 4400 s | GO11229 | M. Meixner |
| 2008-01-20 | 1215 | HST NICMOS2 | F110W,F205W | 5128 s | GO11229 | M. Meixner |
| 2008-01-20 | 1215 | HST NICMOS2 | F160W | 4128 s | GO11229 | M. Meixner |
| 2008-08-04 | 1412 | Gemini GMOS-N | 2600 s | GN-2008B-Q-44 | M. Barlow | |
| 2009-08-30 | 1803 | WIYN WHIRC | 4180 s | 2009B-0516 | M. Otsuka |
5.2 Photometry and light curve evolution
The final optical magnitudes for SN 2004et are presented in Table 5, including those of neighbouring star 2 discussed previously. The magnitudes for epochs from day 646 onwards have been corrected for the contribution from star 2, but this was not necessary for earlier epochs when the SN brightness dominated. The -band magnitude at day 646, corrected for the contribution from star 2, is detailed in the notes to the table. The NIR magnitudes of the supernova are given in Table 6, although the magnitudes measured from the NICMOS images at days 1019 and 1215 are HST Vegamags (Appendix A2). The optical and NIR light curves are presented in Figures 6 and 7 respectively.
| UT date | Age | Magnitudes | Source | ||
| [days] | |||||
| 2004-12-10 | 79 | 13.09 0.04 | 12.38 0.03 | 11.93 0.03 | Tenagra II |
| 2004-12-20 | 89 | 13.21 0.03 | 12.45 0.03 | 11.98 0.03 | Tenagra II |
| 2005-08-05 | 317 | 17.35 0.02 | 16.52 0.03 | 15.91 0.04 | Gemini GMOS-N |
| 2005-10-31 | 404 | 18.28 0.04 | 17.69 0.03 | 16.87 0.04 | Gemini GMOS-N |
| 2006-06-30 | 646 | 21.59 0.55† | 21.00 0.55† | 20.63 0.56† | Subaru FOCAS |
| 2006-07-18 | 664 | 22.13 0.06† | 21.56 0.09† | 21.37 0.11† | Gemini GMOS-N |
| 2007-07-08 | 1019 | 23.20 0.20‡ | 22.70 0.20‡ | HST WFPC2 | |
| 2008-01-20 | 1215 | 23.40 0.30‡ | 23.00 0.30‡ | HST WFPC2 | |
| 2008-08-04 | 1412 | 23.80 0.40† | 22.87 0.28† | 22.80 0.70† | Gemini GMOS-N |
| Star 2 | 24.2 0.3 | 23.5 0.5 | 22.9 0.4 | HST WFPC2 | |
| Zero-magnitude flux [Jy] | 3670.3 | 2972.3 | 2402.1 | Evans (1993); Glass (1999) | |
| [m] | 0.55 | 0.64 | 0.80 | ||
-
Optical photometry at day 646 was estimated from an archival Subaru-FOCAS spectrum by integrating over the filter transmission curves. The band magnitude of SN 2004et at this time was 22.47 0.22, corrected for an estimated -band contribution from star 2 of 25.46 0.50 (see text).
-
†
The SN magnitudes at these late epochs have been corrected for contamination by star 2 (whose magnitudes measured from the high-resolution HST data are listed in the final table entry).
-
‡
Since the SN and star 2 were resolved in the day 1019 and day 1215 HST images, the magnitudes given for these epochs are for the SN alone.
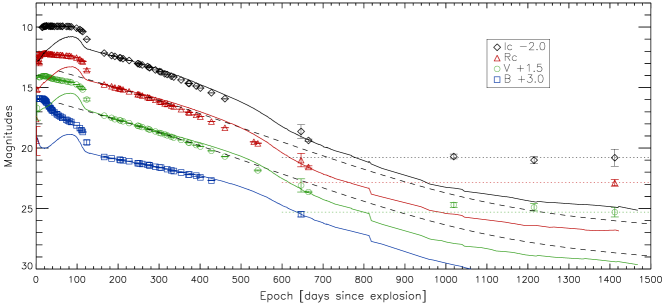
Figure 6 combines the data of Sahu et al. (2006) with the SEEDS data described above to provide optical light curves (open symbols) from a few days after the explosion to almost 4 years later. The light curves are well sampled until around day 400. Few Type II SNe have been observed beyond 500 days. However, SN 1987A, the closest supernova to have occurred in the past century, has been well studied for over 2 decades and provides detailed light curves for comparison. The broad-band light curves of SN 1987A (Hamuy & Suntzeff 1990; Walker & Suntzeff 1991)222Hamuy & Suntzeff (1990) data downloaded from the NOAO archive: ftp://ftp.noao.edu/sn1987a/ubvri.txt are plotted as solid curves in Figure 6, normalised to the data of SN 2004et at around 200 days. The light curve evolution of both supernovae is quite similar from the early nebular phase ( 160 days) to around day 650, although beyond this time their evolution is markedly different. The brightness of SN 2004et clearly levels off from around day 1000 in the bands (the last -band measurement was at day 646), while SN 1987A continued to fade. Interestingly, the slope of the radioactive decay curves resemble those of SN 1987A between days 720 and 800, around the time when dust production for SN 1987A was assumed to have ended (day 775; Wooden et al. 1993).
For the first few years during the nebular phase, the light curve of Type II SNe is predominantly powered by -rays from the radioactive decay of 56Co to 56Fe, at a rate corresponding to the -folding time of the 56Co decay ( days). For example, the -band photometry of the Type II SN 1990E (Benetti et al. 1994) closely follows this evolution through to 540 days post-explosion, suggesting that simple 56Co decay provides a good estimate of the unextinguished -band light curve for at least that long. The expected decay rate is (mag per 100 days) = 0.98 for complete -ray trapping (Patat et al. 1994). For SN 2004et, Sahu et al. (2006) found that the decline of the broad-band magnitudes during the early nebular phase (180–310 days) was linear, with decay rates of 0.64, 1.04, 1.01 and 1.07. Maguire et al. (2010) found similar results from their own data ( 136–300 days), with , , and . With the exception of the band, the decay rates were close to that of 56Co decay, suggesting that -ray trapping was efficient during this phase.
| UT date | Age | Magnitudes | Source | ||
| [days] | |||||
| 2005-06-17 | 268 | 15.14 0.05 | 15.15 0.03 | a | Steward/Bok IR Camera |
| 2005-08-05 | 317 | 16.01 0.03 | 15.84 0.03 | 15.18 0.04 | Gemini NIRI |
| 2005-10-17 | 390 | 16.96 0.03 | 16.62 0.03 | 16.23 0.04 | Gemini NIRI |
| 2006-07-06 | 652 | 20.09 0.05 | 19.52 0.06 | 19.19 0.07 | Gemini NIRI |
| 2007-07-08 | 1019 | 22.25 0.13b | 22.61 0.36b | 21.91 0.28b | HST NICMOS |
| 2008-01-20 | 1215 | 22.55 0.14b | 22.69 0.43b | 21.44 0.18b | HST NICMOS |
| 2009-08-30 | 1803 | 22.6 | WIYN WHIRC | ||
| Zero-magnitude flux [Jy] | 1656.3 | 1070.9 | 672.8 | Glass (1999) | |
| [m] | 1.25 | 1.65 | 2.20 | ||
-
a
There is no band magnitude at day 268 as unusual image artifacts compromised the photometry.
-
b
HST Vegamags in NICMOS2 filters ( band), ( band) and ( band) for days 1019 and 1215. For each filter and epoch, the measured count rate (, in units of DN s-1) at the position of the SN was converted to flux by multiplication with the (Jy s DN-1) conversion factor given in the fits header, where is the bandpass-averaged flux density for a source that would produce a count rate of 1 DN-1. = , and Jy s DN-1 for , and respectively.
However, both authors found that the optical decay rates of SN 2004et steepened beyond 300 days, suggesting that either the supernova had become transparent to -rays and hence -rays as a source of energy were escaping, or that dust was forming within the ejecta and causing localised optical extinction, or possibly was due to both phenomena.
To investigate this further we can look again at the radioactive deposition. As the ejecta expand, their opacity to -rays is expected to decrease, which results in a modified light curve of the form (Woosley et al. 1989):
| (1) |
where the term in the brackets is the deposition function, i.e., the fraction of -rays deposited in the envelope; = 0.033 cm2 g-1 is the average opacity to 56Co-decay -rays, and = 7104 g cm-2 is the column depth at the fiducial time = 11.6 days chosen to match the bolometric light curve of SN 1987A.
After this first source of decay energy has become sufficiently weak, other energy sources which could become important in powering the very late time light curves are -rays, positrons and electrons from the radioactive decay of 57Co, 44Ti and 22Na. The equations that describe the energies from all these isotopes, including 56Co, were summarised by Li et al. (1993), following the work of Woosley et al. (1989), to describe the deposition behaviour of SN 1987A. Adopting the same deposition behaviour for SN 2004et, the radioactive decay curve attributable to the energy sources from these isotopes, including a term to account for the decrease in opacity to -rays as the ejecta expands, has been plotted in Figure 6 (dashed line) over both the and band magnitudes of SN 2004et, normalising to the early nebular phase data (160–260 days). As expected, with the exception of the band, the decay rates during the early nebular phase closely follow those of the radioactive decay deposition. However, from about 400 days the band light curve has clearly begun to decline more rapidly than the expected light curve from radioactive decay deposition. The band follows a similar trend, whereas the steepening of the decline rate appears to occur slightly later in the band, having clearly begun sometime between 460 and 540 days. In comparison with the expected radioactive decay deposition behaviour of SN 1987A, as modelled by Li et al. (1993), there is evidence for a steepening decline of the light curves, indicative of dust formation in the ejecta of SN 2004et from around 400 days, and possibly earlier (Sahu et al. 2006; Maguire et al. 2010). From the -band light curve (Figure 6), we estimate that the difference between the observed and predicted light curves was 0.8 magnitudes by day 690, if allowance is made for the effective opacity term for 56Co -rays, or 1.5 magnitudes if this term is neglected.
It is clear that the elevated brightness of SN 2004et after 1000 days cannot be explained by the inclusion of isotope decays, such as 57Co and 44Ti, which could be important at these late times. The plateauing of the optical light curves above the expected radioactive decay suggests an additional energy source has come into play by at least day 1000 and is consistent with the late rise observed in the mid-IR observations after this time. Similar phenomena observed for other SNe have been attributed to light echoes (e.g., SN 2007od; Andrews et al. 2010).
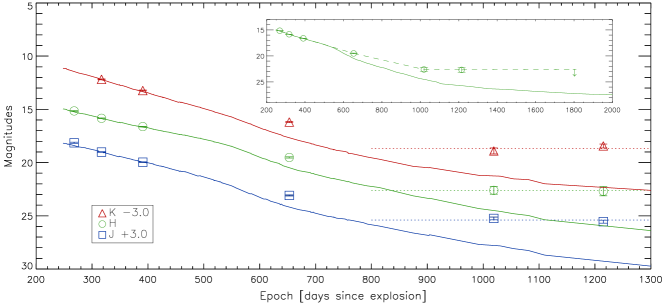
Figure 7 presents the late-time NIR light curves (open symbols) of SN 2004et based on the SEEDS data described previously. The light curves of SN 1987A (solid lines; Bouchet & Danziger 1993) have been arbitrarily scaled to the early nebular phase data of SN 2004et for comparison. The NIR light curves of SN 2004et are not well-sampled but clearly deviate from those of SN 1987A by day 646, after which time SN 2004et is systematically brighter. The NIR light curve evolution reflects that of the optical, with a relative plateau in brightness occurring from around 1000 days, consistent with a light echo hypothesis.
However, by day 1803 (see inset in Figure 7), the -band brightness has faded to beyond a clear detection with the WHRIC detector on the 3.5-m WIYN telescope. The derived upper limit of 22.6 mag accounts for contamination by neighbouring stars (as described in Section A.2) and suggests the SN faded sometime after day 1215.
6 Spectral energy distribution analysis based on optical, NIR and mid-IR photometry
The mid-infrared photometry listed in Table 3, along with the optical and IR photometry in Table 5 and Table 6 and the optical photometry of Sahu et al. (2006), have been used to investigate the spectral energy distribution of SN 2004et at each of the IRAC observation epochs from days 64 to 1395.
6.1 Blackbody fitting
To investigate the physical processes that determine the observed optical and infrared continuum emission and their evolution, blackbodies were matched to the SEDs at each of the IRAC epochs from day 64 to day 1395. Where necessary, the light curves for the optical, NIR, PUI 16-m and MIPS 24-m data were used to interpolate their measured flux densities to the epochs of the IRAC data. It should be noted that to extrapolate the last magnitude, obtained on day 646 to the closest IRAC epoch at day 690, the better-sampled -band decline rate during this period was adopted in order to account for the gradual flattening of the light curve. Similarly, the magnitudes from day 652 were extrapolated to the closest IRAC epoch of day 690 assuming the decline rate observed in the -band during this period. Gemini Michelle flux densities at 11.2 m were not interpolated due to insufficient data but, where available, they are compared with the closest IRAC epoch.
The interpolated optical data were converted from the standard Johnson-Cousins magnitudes to flux densities using the zero-magnitude flux densities of Evans (1993) and Glass (1999). The interpolated Steward and Gemini NIR data were converted from standard magnitudes to flux densities using the zero-magnitude flux densities of Glass (1999). The late-time HST-NICMOS flux densities were obtained by multiplying the count rate measured for the SN by the (erg cm-2 DN-1) conversion factor from the fits image headers, where is the bandpass-averaged flux density in for a source that would produce a count rate of 1 DN s-1. All flux densities were de-reddened using E(B – V) = 0.41 mag (Zwitter et al. 2004) and assuming the extinction law of Cardelli et al. (1989) with , corresponding to mag.
6.1.1 Day 64
Panel (a) of Figure 8 shows a fit to the SED at day 64, during the photospheric plateau phase of SN 2004et. The fit, which uses a 5400 K, blackbody normalised to the IRAC 5.8-m flux density, under-estimates the and band flux densities, which we attribute to the presence of strong emission lines such as H in the 5400–7000 Å wavelength region (Sahu et al. 2006; Kotak et al. 2009), while it significantly overestimates the band flux density. A spline curve fitted to the photometry was therefore used to estimate the total flux shortwards of . This spline curve was combined with the 5400 K blackbody, truncated at wavelengths (4400 Å), to yield a total integrated flux of 4.5 W m-2 (with a corresponding luminosity of 4.9 L⊙), about 93% of the total integrated flux/luminosity from the hot blackbody alone. At wavelengths , the total flux corresponding to the spline fit constituted about 49% of that from the 5400 K blackbody fit. In panel (a) of Figure 8 the solid line represents the combined spline and truncated blackbody fit, whilst Table 7 lists the parameters for the blackbody fits.


It is well known that all Type I SNe show a pronounced early-time deficit at ultraviolet (UV) wavelengths relative to a blackbody fitted at longer wavelengths (e.g., Panagia 2003). This has been interpreted as due to strong line blanketing by many low excitation lines of Fe II and other lines shortwards of 4000 Å (e.g., Branch & Venkatakrishna 1986). The situation for Type II SNe seems to be less clear. In his review of optical spectra of supernovae, Filippenko (1997) noted that most Type II SNe do not show this feature, with the early-time spectra approximating a single-temperature Planck function from UV through to IR wavelengths, and occasionally even showing a slight UV excess. However, Fransson et al. (1987), from their studies of the peculiar Type II SN 1987A, concluded that supernova atmospheres with a normal (solar) chemical composition can give rise to line blanketing effects, such as those seen in the UV spectra of SN 1987A. They proposed that the differences in UV spectra of supernovae may instead be due to differences in the density of the CSM. The earliest IUE (1150–3200 Å) spectra of SN 1987A ( 6 days after explosion) showed a strong UV deficit in the wavelength range 1250–3200 Å, relative to the 6000 K blackbody curve defined at optical and infrared wavelengths (Danziger et al. 1987). This was still present at day 60, and possibly as late as day 260, as shown by the best-fit SEDs of Wooden et al. (1993). The apparent UV drop-off relative to the blackbody fit to the photometric SED of SN 2004et at day 64 suggests that a similar effect is present in this Type II-P SN. Li et al. (2005) noted from a spectrum of SN 2004et at day 9 that “there is a peculiar decline blueward of 4000 Å not commonly observed in the spectra of normal SNe II-P”.
6.1.2 Days 300-828
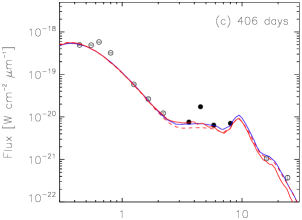
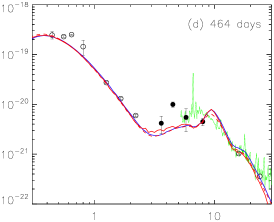
The blackbody fits to the SEDs at days 300 to 828 are shown in Figure 8. The corresponding blackbody parameters are listed in Table 7. For each epoch, more than one component was required to obtain a reasonable fit to the optical, NIR and mid-IR photometry. These were comprised of (i) a hot blackbody, with temperatures during the period 300–828 days ranging from 7100–10000 K, representing the optical and NIR continuum emission from the optically thick hot gas of the ejecta, (ii) a warm blackbody (420–650 K) representing the emission at mid-infrared wavelengths, and (iii) from day 464 onwards, a cooler (200–250 K) blackbody to account for the observed emission at the two longest mid-IR wavelengths (16 and 24 m). Excess emission is also present at 24 m on days 300–406, but at a relatively constant level, see Figure 8.
From days 300 to 464, the mid-IR emission demonstrated a clear excess at 4.5 m, as noted by Kotak et al. (2009). A similar feature has been seen in mid-IR photometry of other Type II SNe, such as the Type II-P SN 2003gd at day 499 (Sugerman et al. 2006), and SN 2007it at day 340 (Andrews et al. 2010). This can be attributed to emission from the carbon monoxide (CO) fundamental band at 4.65 m, which was directly observed in the infrared spectra of the Type IIpec SN 1987A from as early as 100 days after explosion (Suntzeff & Bouchet 1990) and stayed visible until at least day 615 (Wooden et al. 1993). The red wing of the same emission line was detected in the Spitzer-IRS spectra of the Type II-P SN 2004dj at days 109 and 129 (Kotak et al. 2005). Together with the detection of the first overtone of CO at 2.3 m in the NIR spectrum of SN 2004et (Maguire et al. 2010), as well as in the spectra of several other Type II SNe (Gerardy et al. 2002 and references therein), these observations indicate that strong CO emission is common in Type II SNe.
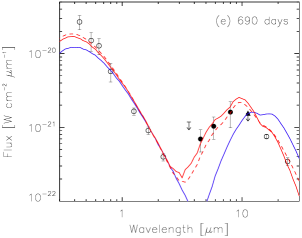
Kotak et al. (2009) also noted an excess at 8.0 m compared to blackbodies matched to the mid-IR continuum emission from days 300 to 690. They found this to be consistent with a broad emission feature between 8–14 m seen clearly in Spitzer-IRS spectra until at least days 450–481 and attributed this to silicate emission, with a contribution from the silicon oxide (SiO) fundamental band in the 7.7–9.5-m region. Accordingly, our warm blackbody component was normalised to the 3.6 or 5.8-m fluxes as best representing the continuum emission during these times. For the best-fit SED at day 300 (panel (b) in Figure 8), the Gemini 11.2-m flux from day 311 is also underestimated by the warm blackbody component. This excess is attributed to the broad silicate emission feature seen at its strongest in the IRS spectra at days 294 and 349 presented by Kotak et al. (2009). The 8.0-m excess is no longer evident after day 690, consistent with the IRS spectrum at day 823 presented by Kotak et al. (2009). Panel (g) of Figure 8 shows that by day 828 the observed 8.0-m flux is well-matched by the blackbody fits.
6.1.3 Days 1015–1395
Best fits to the SEDs at epochs of days 1015, 1054, 1191 and 1395 are also shown in Figure 8 and the corresponding blackbody parameters are listed in Table 7. Hot (10000 K), warm (350–520 K) and cool (120–170 K) blackbody components were matched to the optical, NIR and mid-IR photometry. For days 1015 and 1191, the adopted NIR fluxes were those measured in the F110W, F160W and F205W NICMOS2 filters at the reasonably contemporary epochs of days 1019 and 1215.
| Epoch | [10-15 | [10-15 | [10-15 | [10-15 | |||||||||||||
|---|---|---|---|---|---|---|---|---|---|---|---|---|---|---|---|---|---|
| [days] | [K] | W m-2] | [1015 cm] | [km s-1] | [106 L⊙] | [K] | W m-2] | [1015 cm] | [km s-1] | [106 L⊙] | [K] | W m-2] | [1015 cm] | [km s-1] | [106 L⊙] | W m-2] | [106 L⊙] |
| 642 | 5400 | 446 | 1.75 | 3167 | 485 | 446 | 4872 | ||||||||||
| 3003 | 7250 | 10.9 | 0.15 | 59 | 11.9 | 650 | 0.81 | 5.16 | 1989 | 0.89 | 11.7 | 12.83 | |||||
| 360 | 7250 | 5.04 | 0.10 | 33 | 5.50 | 600 | 0.63 | 5.34 | 1718 | 0.69 | 5.67 | 6.19 | |||||
| 406 | 7350 | 3.24 | 0.081 | 23 | 3.54 | 580 | 0.59 | 5.51 | 1570 | 0.68 | 3.83 | 4.18 | |||||
| 464 | 7100 | 1.48 | 0.058 | 15 | 1.62 | 550 | 0.39 | 4.99 | 1246 | 0.42 | 250 | 0.083 | 11.15 | 2782 | 0.091 | 1.96 | 2.13 |
| 690 | 8500 | 0.16 | 0.013 | 2.2 | 0.17 | 420 | 0.12 | 4.67 | 784 | 0.13 | 210 | 0.096 | 16.96 | 2845 | 0.10 | 0.37 | 0.40 |
| 828 | 10000 | 0.10 | 0.0078 | 1.1 | 0.11 | 450 | 0.060 | 2.93 | 409 | 0.065 | 200 | 0.089 | 17.99 | 2515 | 0.096 | 0.25 | 0.27 |
| 1015 | 10000 | 0.047 | 0.0052 | 0.60 | 0.051 | 365 | 0.064 | 4.59 | 523 | 0.069 | 125 | 0.090 | 46.36 | 5286 | 0.098 | 0.20 | 0.22 |
| 1054 | 10000 | 0.050 | 0.0054 | 0.60 | 0.055 | 370 | 0.064 | 4.47 | 491 | 0.070 | 150 | 0.082 | 30.72 | 3374 | 0.089 | 0.20 | 0.21 |
| 1191 | 10000 | 0.044 | 0.0050 | 0.49 | 0.047 | 500 | 0.27 | 5.02 | 487 | 0.29 | 170 | 0.16 | 33.87 | 3291 | 0.18 | 0.48 | 0.52 |
| 1395 | 10000 | 0.045 | 0.051 | 0.42 | 0.049 | 520 | 0.35 | 5.32 | 441 | 0.39 | 160 | 0.20 | 42.33 | 3512 | 0.22 | 0.60 | 0.65 |
-
1
Up to three components – hot, warm and cool – were used to fit the continuum emission of the SEDs (see text). For each component, is the blackbody radius corresponding to the best fit temperature, ; is the expansion velocity corresponding to the radius ; and is the luminosity for an adopted distance to the SN of 5.9 Mpc.
-
2
The day 64 5400 K blackbody fit over-estimated the band flux. A spline curve fit to the UB fluxes and extrapolated to shorter wavelengths was combined with the 5400 K blackbody fit to the longer wavelength data, where the blackbody was truncated at wavelengths shorter than the -band – see panel (a) of Figure 8. The total integrated flux and corresponding luminosity of this “spline 5400 K blackbody” fit are about 93% of those values for the pure 5400 K blackbody fit shown in this table.
-
3
At day 300, it was found that the hot component blackbody still over-estimated the fluxes at the shortest wavelengths. A spline curve fit to the UBV fluxes and extrapolated to shorter wavelengths was combined with the two-component blackbody fit to the longer wavelength data, as shown in panel (b) of Figure 8, where the 7250K blackbody component was truncated at wavelengths shorter than the V-band. The total integrated flux and corresponding luminosity of this “spline 7250K 650K blackbody” fit are about 73% of those values for the combined 7250K 650K blackbody fit shown in this table.
6.2 Discussion of results from blackbody fitting
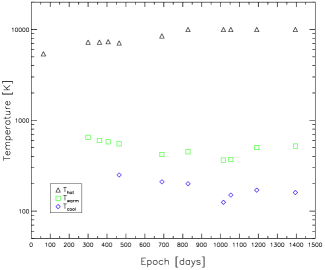
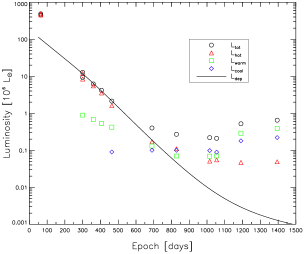
The complete set of parameters from the blackbody fits to the photometry from days 64 to 1395 are listed in Table 7. The temperature evolution of the best fit multi-component blackbodies is shown in Figure 9.
The left-hand panel of Figure 10 shows the evolution of the luminosities of each of the blackbody components, and their sum, compared with the theoretical luminosity due to the radioactive deposition of 56Co, 57Co, and other isotopes, adopting the deposition behaviour of SN 1987A as modelled by Li et al. (1993) and Woosley et al. (1989). The radioactive decay deposition curve for SN 1987A was scaled by a factor of 0.69 to normalise it to the total luminosity of SN 2004et between days 300–464. It should be noted that the blackbody fits to the photometry mainly trace the continuum emission of the SN (known optical and mid-IR emission line features were deliberately not matched by the blackbodies as discussed in the previous sections). As a consequence, the luminosities listed in Table 7 slightly underestimate the total luminosities.
6.2.1 Evolution of the hot component
The day 64 photometry can be fitted by a 5400 K blackbody, consistent with an origin from the optically-thick emission of the ejecta photosphere, with the Rayleigh-Jeans tail of the corresponding blackbody extending into the infrared. As the ejected envelope adiabatically expands and cools, the hydrogen ionised by the initial SN shock approaches the temperature for recombination ( 5000 K) and a recombination wave recedes through the envelope. The recombination front defines the photosphere and as such the temperature of the photosphere is characterised by the recombination temperature of hydrogen. Wooden et al. (1993) found that a hot component of 5000-5500 K was a good match to the SED of SN 1987A from days 60 to 777, which they found to be in agreement with observations of other Type II supernovae by Kirshner et al. (1973). With a similar temperature, the 5400 K blackbody fit shown in panel (a) of Figure 8 is representative of the photospheric continuum emission at this time. The ejecta velocity of 3167 km s-1 implied by the emitting radius of the 5400 K blackbody is in reasonable agreement with the velocity of 3500 km s-1 found by Sahu et al. (2006) for SN 2004et in the plateau phase, estimated from the minimum of weak, unblended absorption lines of at 4924, 5018 and 5169 Å. Kotak et al. (2009) obtained a reasonable fit to the day 64 SED of SN 2004et with a single 5300 K blackbody, concluding there was little sign of thermal emission from dust.
As expected, the corresponding luminosity at day 64 exceeds that from radioactive decay deposition, which only begins to dominate the light curve during the nebular phase (from 130 days, Maguire et al. 2010), following the sharp decline from the plateau at 110 days (Sahu et al. 2006). For the 5400 K blackbody fit the day 64 luminosity exceeds that from radioactive deposition by a factor of 4.9, or by a factor of 4.5 if considering the spline plus truncated blackbody fit which is a better match to the band data. This compares to the factor of 3.8 found by Kotak et al. (2009).
By day 300, the estimated temperature of the hot blackbody component had increased to 7250 K and then remained relatively constant ( 150 K) until day 464 (Figure 9), whilst its luminosity faded quite rapidly (by a factor of 7) during this time (Figure 10). Note that at day 300, the blackbody fit significantly over-estimates the fluxes at the shortest wavelengths in the and bands, as also seen at day 64 (see previous discussion). By day 690 the temperature had increased again to 8500 K and to 10,000 K by day 828, whilst the luminosity continued to decrease (by a factor of 15). For epochs beyond 1000 days, the temperature of the hot component appears to remain constant.
6.2.2 Evolution of the warm and cool dust components
The warm dust component cooled monotonically from 650–420 K between days 300 and 690 (Figure 9). This is consistent with the fading of SN 2004et observed in the mid-IR during this time. The sum of the luminosities of the hot component and warm component is less than or comparable to the predicted radioactive deposition up to day 690. On day 828 however, the sum of the hot and warm component luminosities was a factor of 1.7 higher than the predicted radioactive deposition luminosity.
The presence of a mid-IR excess from day 300, demonstrated by the requirement of a warm component to match the SEDs from this time, and the evolution of this warm component from 300 to 690 days, are consistent with emission from dust freshly synthesised in the supernova ejecta, in agreement with the results of Kotak et al. (2009) from their interpretation of similar data.
The approximately constant luminosity of the warm component between days 828 and 1054 corresponded to the lowest level reached, since at day 1191 the warm component luminosity had increased by a factor of 4.3. From day 1015 the warm component luminosity clearly exceeds that of the radioactive deposition (by a factor of 8) and at day 1191 by a factor of over 100.
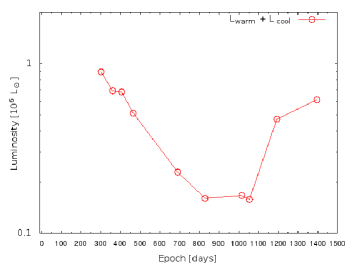
The cool dust component, required to fit the mid-IR fluxes longwards of 16 m from day 464 onwards, showed a monotonic decline in temperature from 250 K at day 464 to 120 K at day 1015, but then increased slightly and remained around 160 K between days 1054 and 1395. Its luminosity stayed roughly constant from days 464 to 1054, but had increased by a factor of 2 by days 1191–1395. The velocities implied by the minimum emitting radii of these cooler blackbodies ranged from 2500–6000 km s-1.
| diffuse source | smooth | clumpy | |||||||||
| Epoch | / | L | T | AmC:Sil | – | n() | |||||
| (day) | (1015 cm) | (106 L⊙) | (K) | () | (m) | = | (10-5 M⊙) | (10-5 M⊙) | |||
| 300 | 7.0 | 4.0 | 12.8 | 8000 | 20:80 | 0.1–1.0 | 3.5 | 0.11 | 3.8 | 0.07 | 7.6 |
| 360 | 6.0 | 4.5 | 6.19 | 7000 | 20:80 | 0.1–1.0 | 3.5 | 0.20 | 5.6 | 0.12 | 10.0 |
| 406 | 7.0 | 4.0 | 4.18 | 8000 | 20:80 | 0.1–1.0 | 3.5 | 0.18 | 6.5 | 0.24 | 22.4 |
| 464 | 8.0 | 4.0 | 2.13 | 8000 | 20:80 | 0.1–1.0 | 3.5 | 0.38 | 11.1 | 0.39 | 50.0 |
| 690 | 6.0 | 3.5 | 0.40 | 8000 | 20:80 | 0.1–1.0 | 3.5 | 1.30 | 43.9 | 1.31 | 150 |
Kotak et al. (2009), on the other hand, found that the temperature of their cool component remained approximately constant, at 120 10 K for all epochs from day 300–1395, with minimum blackbody radii corresponding to velocities as large as 12000 km s-1, so they ruled out ejecta-condensed dust as a source of the cool dust emission. The differences between our results for the cool component and those of Kotak et al. (2009) are most likely due to the differences in the photometry at the longest wavelengths, 16 and 24 m, as discussed in Section 4.2. Our 16 and 24-m fluxes required generally higher temperature blackbodies to fit them than did those of Kotak et al. (2009). Since our luminosities for the cool component are generally consistent with those of Kotak et al. (2009), the higher blackbody temperatures that we obtain resulted in lower minimum radii and therefore lower minimum outflow velocities.
The right-hand panel of Figure 10 shows the evolution of the sum of the luminosities of the two dust components (warm plus cool). It shows a steady decline until day 828, a period of constant luminosity until day 1054 and a steep rise thereafter. The evolution beyond day 828 implies the presence of an additional energy source. Kotak et al. (2009) found similar results and interpreted the late rise in the mid-IR flux as due to ejecta-CSM interaction and the subsequent formation of a cool dense shell of dust behind the reverse shock of the supernova. An alternative explanation in terms of a light echo from pre-existing extended CSM dust will be presented by Sugerman et al. (in preparation).
7 Radiative transfer modelling: days 300–690
In agreement with previous investigators (Sahu et al. 2006; Kotak et al. 2009), the development of a red-blue asymmetry in optical emission line profiles, the evidence from optical light curves for additional extinction by dust in the ejecta, and the development of a mid-IR excess attributable to dust emission all support the inference that dust formed within the ejecta of SN 2004et from about 300 days after explosion. As discussed above, by day 828 the total luminosity exceeded the estimated radioactive deposition luminosity by a factor of four (Figure 10), indicating that an additional component dominated by that date. Consequently, epochs later than day 690, when the thermal IR emission can no longer be solely attributed to internally heated newly-formed dust in the ejecta, will not be modeled here - Sugerman et al. (in preparation) will present a circumstellar light echo model for these later epochs.
To investigate the time evolution of dust formation in the ejecta of SN 2004et and to estimate the mass of dust present, a number of dust shell models were built to match the observed SEDs at the epochs between days 300 and 690 (Table 8). The models were calculated using the three-dimensional Monte Carlo radiative transfer (RT) code MOCASSIN (Ercolano et al. 2003; Ercolano et al. 2005) which accounts for the primary and secondary components of the radiation field in a fully self-consistent manner through absorption, re-emission and scattering of photons. The photon paths are followed from a specified source through a given composition, grain-size distribution, density and geometry of dust. The particular choices of these parameters are either constrained a priori or are varied until the model emission and extinction match the observations.
For the day 300–690 models we assumed that the observed IR emission originated from dust formed in the SN ejecta. Heating is due to -rays from the decay of 56Co, which are reprocessed to optical and UV wavelengths through interaction with the gas. We assume that this leads to a local radiation field whose strength is proportional to the local ejecta density. Based on these assumptions, and following the previous modelling of SN 2003gd by Sugerman et al. (2006) and of SN 1987A by Ercolano et al. (2007), the RT models were constructed such that the dust and source luminosity were mixed within a spherical expanding shell of inner radius and outer radius . For the dust density distribution, we considered two cases: (i) a smooth distribution following an density profile (smooth model), and (ii) a clumpy model where dense clumps exist in a less-dense interclump medium (ICM), where the ICM follows a smooth density distribution, with the local heating source located only in the ICM. For each case, we compared the observed SEDs with those reproduced by the models to determine which gave the best fit to the observations.
| Epoch | |||
|---|---|---|---|
| (days) | () | () | () |
| 336 | 21 | 75 | 68 |
| 417 | 20 | 58 | 60 |
| 454 | 26 | 58 | 57 |
| 649 | 26 | 60 | 27 |
Before running the models, we estimated the contribution from line emission to the -bands. We used day 417 and 454 optical spectra downloaded from plus day 336 TNG and day 646 Subaru spectra, along with the Subaru/FOCAS -band filter transmission curves333See http://www.naoj.org/Observing/Instruments/FOCAS/camera/filters.html because these have similar band centres and widths to the standard Johnson filters. The percentage line contributions in each band are listed in Table 9. When evaluating the fitting accuracy of the SED modeling, we excluded the and bands on days 300, 360, 406, and 464 because both bands were dominated by line emission at those epochs. We also omitted the IRAC 4.5-m data-points from the fitting, due to the potentially very large CO line emission contributions in that band (Kotak et al. 2009). Although our modelling took into account potential emission from the broad silicate 10-m band, the SiO fundamental vibrational band can also contribute to the IRAC 8-m band – from Spitzer IRS spectra its contribution was deduced by Kotak et al. (2009) to be significant on days 300-464.
7.1 Smooth dust distribution models
Both amorphous carbon (AC) and silicate dust grains were considered. Optical constants were taken from Zubko et al. (1996) for amorphous carbon (their ACH2), and from Draine & Lee (1984) for the silicates. To investigate the dust composition, models were run with amorphous carbon:silicate mixtures of (100-x):x %, for x=0,20,40,60,80,100. It was found that the case of 20 % amorphous carbon and 80 % silicate (by mass) best matched the observed SEDs at all epochs, and this composition was adopted for all subsequent models.
A standard MRN distribution (Mathis et al. 1977) with =0.005 m and =0.25 m could not reproduce the steepness of the observed SED in the -bands before day 690, nor the 16- and 24-m flux densities. An improved fit was found using an MRN distribution with =0.1 m and =1.0 m and this was subsequently adopted for all epochs.
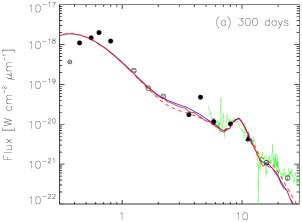
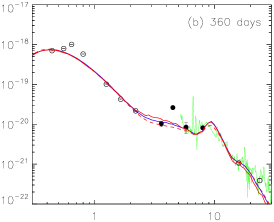
The density distribution in SN ejecta can range from approximately flat, to very steep in the layers that had formed the photosphere of the progenitor. Here, we adopt an law. We found that distributions steeper than led to too much emission in the 1.6-3.6-m spectral region at the earlier epochs, as a result of the high densities and high heating rates at the inner edge of the ejecta. As a first guess, we adopted initial values for from our blackbody fitting, and then varied them to match the observations. We calculated models with shell size scaling parameters = 3.0, 3.2, 3.5, 4.0, 4.5. The adopted heating luminosities were the total luminosities measured from the blackbody fitting at each epoch, as listed in the final column of Table 7. Table 8 lists the parameters of the best-fitting models for each epoch, including derived dust masses, , and visual optical depths . The variation in derived dust masses when parameters such as , , and are varied from their best-fitting value allows us to estimate that the uncertainty in the derived dust mass is 50%. Figure 11 plots the emergent SEDs (red solid lines) and the observations, where the plotted flux densities have been corrected for foreground extinction.
The observed SEDs were best fitted using diffuse field radiation temperatures of 7000-8000 K, a little higher than the best-fitting hot blackbody temperatures listed in Table 7. This might be attributable to the effects of internal dust extinction on the emergent optical energy distribution in the radiative transfer models. The best-fitting models for the different epochs were not homologous, in that the and values did not increase linearly with time (Table 8). Since the derived dust masses increased by a factor of four between days 300 and 464, indicating ongoing dust formation, the dominant dust-emitting regions could change with time.
However, we also investigated homologous models for the different epochs, taking the day 300 value of Y = 4.0 from Table 8 and keeping it the same for subsequent epochs, adjusting only the total dust mass to obtain a best fit. These models are plotted as the back solid lines in Figure 11. They produced slightly improved fits to the day 406 and 464 24-m data-points, although they failed to match the observed SED on day 690 (Figure 11).
Table 8 shows that the smooth model dust masses increased from 0.4 M⊙ on day 300 to 1.1 M⊙ on day 464 and 4.4 M⊙ on day 690. The inner and outer radii of the day 300 model correspond to expansion velocities of 2700 and 10800 km s-1, respectively, while those for the day 406 and 464 models correspond to expansion velocities of 2000 and 8000 km s-1 respectively. The above inner radii velocities are consistent with line absorption minimum velocities measured in optical spectra obtained at these epochs, e.g. Sahu et al. (2006) measured Fe ii absorption minimum expnasion velocities of 2000 km s-1 after day 150. Since absorption line optical depths scale as , where is the density, then for or steeper density distributions, line optical depths are strongly weighted to the inner radii, where velocities are lowest, as are emission lines, whose emissivities typically scale as . At the earliest epochs however, when ejecta densities are much higher, line optical depths of unity do not penetrate very deep into the outermost layers of the ejecta, where expansion velocities are much higher, e.g. the day 25 spectrum of Sahu et al. (2006) showed H and H absorption minima at expansion velocities of 8000 km s-1 (their Fig. 9), consistent with the outer radius expansion velocities of our dust models, while H absorption was even detectable out to 14,500 km s-1 on day 25.
7.2 Clumpy dust models
For the Type II SN 2003gd, Sugerman et al. (2006) demonstrated that smooth dust models could underestimate the dust mass by an order of magnitude or more compared to models that allow for clumping. Ercolano et al. (2007) showed that both smooth and clumpy dust models could fit the observed SEDs of SN 1987A at late epochs, with clumpy models able to accommodate significantly larger dust masses. We have constructed clumpy models for SN 2004et, employing a similar modelling strategy to that used for SN 1987A and SN 2003gd.
For the clumpy models, we assume that dense homogeneous clumps are embedded in a less-dense interclump medium (ICM) with an density distribution. The clumps have radius and a volume filling factor, . We adopted the same and = 0.01 for all epochs. The density contrast between the clumps and the smooth ICM is defined by = ()/(), where () and () are the densities of the clumps and the smooth ICM at the inner radius, respectively. We set = 55 for all epochs. For the other parameters, we adopted the same source luminosity, temperature, dust composition and size distribution as used for the smooth dust models. Similar SEDs to those from the smooth dust models were obtained for the clumpy models (red dashed curves in Figure 11). Compared to the variable-Y smooth dust models, the counterpart clumpy models produced an improved fit to the 3.6-m photometry on days 300-360 and to the 24-m photometry on days 300-406.
Compared to the smooth dust distribution models, the clumped dust models were able to accommodate two to five times larger dust masses without increasing the effective dust optical depths in the visible region of the spectrum. The smooth and clumpy dust models for day 690 both predict an effective optical depth of 1.3 in the V-band, consistent with our estimate from the observed light curve of 0.8-1.5 magnitudes of internal extinction at this epoch (Section 5.2). The clumped dust model for 690 listed in Table 8 had a total dust mass of 1.5 M⊙, but we found that up to 4 M⊙ of dust could be accommodated in clumps at that epoch without seriously reducing the goodness of fit to the observed SED.
8 Discussion and conclusions
We have used a range of new and archival optical and infrared data, extending from day 64 to day 2151, to investigate the formation of dust in the ejecta of the Type II-P SN 2004et, focusing in particular on the mid-IR observations obtained with the Spitzer Space Telescope and Gemini-North telescope.
As discussed by Lucy et al. (1989) for SN 1987A, there are three distinct signatures of dust formation in the ejecta of core-collapse SNe. These are (1) the appearance of asymmetric blue-shifted emission lines caused by dust preferentially extinguishing emission from the receding (redshifted) gas; (2) a drop in visual brightness due to increased extinction by the newly formed dust; accompanied by (3) a mid-infrared excess due to thermal dust emission, These three phenomena have all been observed in the case of SN 2004et, as found by previous studies (Sahu et al. 2006; Kotak et al. 2009; Maguire et al. 2010).
From an analysis of new and recalibrated spectra, we showed that between days 259 and 646 the peak of the H emission line shifted to the blue by 600 km s-1 (Fig. 2). The optical light curve of SN 2004et declined more rapidly than that expected from radioactive deposition, with the onset of ejecta dust formation estimated to have occurred 300–400 days after explosion (Fig. 6) The same light curves allowed us to estimate that by day 690 the additional extinction in the -band, attributable to newly formed ejecta dust, was between 0.8 and 1.5 magnitudes. From day 300 onwards the SN 2004et SEDs exhibit clear excess mid-IR emission relative to blackbodies extrapolated from the optical. The day 300, 360 and 406 SEDs could each be fitted by two blackbody components: (i) a hot component attributed to emission from optically thick gas, and (ii) a warm component attributed to dust freshly synthesised and radioactively heated in the SN ejecta (Fig. 8). While these two-component fits provided adequate matches to the observed SEDs out to 16 m, they did underpredict the 24-m fluxes, which remained relatively constant between days 315 and 709 (Fig. 4). The day 294, 348 and 480 Spitzer IRS spectra (Fig. 11) also confirm the presence of relatively steady excess emission longwards of 20 m at these epochs. By day 464 a cool third component was definitely required to fit an increasing excess seen in the 16-m photometry.
For days 300 to 690, our ejecta dust radiative transfer modelling was able to match the observed SEDs out to 20 m (Fig. 11), longwards of which the relatively invariant excess emission discussed above was present. The observed rise in mid-IR fluxes after 1000 days coincided with a flattening of the optical and NIR light curves at around this time. This, coupled with the fact that the minimum luminosities estimated from blackbody fitting exceeded those expected from radioactive decay from c. day 690 onwards, implies that an additional emission source is required after that date. One possibility, discussed by Kotak et al. (2009), is that this emission source was due to the formation of a cool dense shell of dust as a result of ejecta-CSM interaction. Another, discussed by Sugerman et al. (in preparation) is that this emission was due to a light echo from pre-existing CSM dust.
For days 300, 360 and 406, the 80% silicate, 20% amorphous carbon dust masses derived from our smooth dust models (Table 8) agree with the silicate dust masses derived by Kotak et al. (2009) but our derived dust masses increase faster than their values from day 464 onwards and are a factor of 5 larger by day 690. The clumped dust models of Kotak et al. (2009) had similar masses to their unclumped dust models, while our clumped models have dust masses that are factors of 2-4 larger than for our smooth dust models (Table 8). The dust mass derived from our day 464 clumped model was 5 M⊙, increasing to 1.5 M⊙ by day 690. This mass of newly formed dust is similar to, or larger than, values derived for a number of other recent Type II-P SNe at similar epochs, e.g. SN 1987A (Wooden et al. 1993; Ercolano et al. 2007), SN 2003gd (Sugerman et al. 2006; Meikle et al. 2007), SN 2004dj (Szalai et al. 2011; Meikle et al. 2011), SN2007it (Andrews et al. 2011) and SN2007od (Andrews et al. 2010). But this mass is still a factor of 100 or more smaller than the CCSN ejecta dust masses estimated to be needed to account for the large quantities of dust observed in some high redshift galaxies (Kozasa et al. 1989; Todini & Ferrara 2001; Nozawa et al. 2003; Bianchi & Schneider 2007; Dwek et al. 2007; Dwek & Cherchneff 2011) and implies that SNe of this type cannot make a major contribution to the dust content of galaxies, unless their dust masses continue to grow at later epochs than have typically been observed at mid-IR wavelengths.
Acknowledgments
J. Fabbri and R. Wesson acknowledge STFC funding support. M. Otsuka and M. Meixner acknowledge funding support from NASA JWST grant NAG5-12595 and from HST/STScI grant GO-11229.01-A. The work of J. Andrews and G. C. Clayton has been supported by NSF grant AST-0707691 and NASA GSRP grant NNX08AV36H. A portion of the data was obtained at the Gemini Observatory, which is operated by the Association of Universities for Research in Astronomy (AURA) under a cooperative agreement with the NSF on behalf of the Gemini partnership. Some observations were obtained with the NASA/ESA Hubble Space Telescope, which is operated by the Association of Universities for Research in Astronomy, Inc., under a contract with NASA. This work is based in part on observations made with the Spitzer Space Telescope, which is operated by the Jet Propulsion Laboratory, California Institute of Technology under a contract with NASA.
References
- Andrews et al. (2010) Andrews J. E., Gallagher J., Clayton G. C., Sugerman B. E. K., Chatelain J. P., Clem J., Welch D. L., Barlow M. J., Ercolano B., Fabbri J., R. W., Meixner M., 2010, ApJ, 715, 541
- Andrews et al. (2011) Andrews J. E., Sugerman B. E. K., Clayton G. C., Gallagher J., Barlow M. J., Clem J. Ercolano B., Fabbri J., Meixner M., Otsuka M., Welch D. L., R. W., 2011, ApJ, 731, A47
- Barlow et al. (2005) Barlow M. J., Sugerman B. E. K., Fabbri J., Meixner M., Fisher R. S., Bowey J. E., Panagia N., Ercolano B., Clayton G. C., Cohen M., Gledhill T. M., Gordon K., Tielens A. G. G. M., Zijlstra A. A., 2005, ApJ, 627, L113
- Benetti et al. (1994) Benetti S., Cappellaro E., Turatto M., della Valle M., Mazzali P. A., Gouiffes C., 1994, A&A, 285, 147
- Bertoldi et al. (2003) Bertoldi F., Carilli C. L., Cox P., Fan X., Strauss M. A., Beelen A., Omont A., Zylka R., 2003, A&A, 406, L55
- Bianchi & Schneider (2007) Bianchi S., Schneider R., 2007, MNRAS, 378, 973
- Bohlin (2007) Bohlin R. C., 2007, in C. Sterken ed., The Future of Photometric, Spectrophotometric and Polarimetric Standardization Vol. 364 of ASP Conference Series, . p. 315
- Bouchet & Danziger (1993) Bouchet P., Danziger I. J., 1993, A&A, 273, 451
- Branch & Venkatakrishna (1986) Branch D., Venkatakrishna K. L., 1986, ApJ, 306, L21
- Cardelli et al. (1989) Cardelli J. A., Clayton G. C., Mathis J. S., 1989, ApJ, 345, 245
- Danziger et al. (1987) Danziger I. J., Fosbury R. A. E., Alloin D., Cristiani S., Dachs J., Gouiffes C., Jarvis B., Sahu K. C., 1987, A&A, 177, L13
- Dolphin (2000) Dolphin A. E., 2000, PASP, 112, 1397
- Dolphin (2009) Dolphin A. E., 2009, PASP, 121, 655
- Draine & Lee (1984) Draine B. T., Lee H. M., 1984, ApJ, 285, 89
- Ducati et al. (2001) Ducati J. R., Bevilacqua C. M., Rembold S. B., Ribeiro D., 2001, ApJ, 558, 309
- Dwek & Cherchneff (2011) Dwek E., Cherchneff I., 2011, ApJ, 727, A63
- Dwek et al. (2007) Dwek E., Galliano F., Jones A. P., 2007, ApJ, 662, 927
- Ercolano et al. (2005) Ercolano B., Barlow M. J., Storey P. J., 2005, MNRAS, 362, 1038
- Ercolano et al. (2003) Ercolano B., Barlow M. J., Storey P. J., Liu X., 2003, MNRAS, 340, 1136
- Ercolano et al. (2007) Ercolano B., Barlow M. J., Sugerman B. E. K., 2007, MNRAS, 375, 753
- Evans (1993) Evans A., 1993, The Dusty Universe, Evans, A., Ellis Horwood, New York, NY (USA), 1993
- Fabbri (2011) Fabbri J., 2011, PhD thesis, University College London
- Filippenko (1997) Filippenko A. V., 1997, Ann. Rev. Astr. Astrophys., 35, 309
- Filippenko et al. (2004) Filippenko A. V., Foley R. J., Treu T., Malkan M. A., 2004, IAU Circ., 8414, 1
- Fitzgerald (1970) Fitzgerald M. P., 1970, A&A, 4, 234
- Fransson et al. (1987) Fransson C., Grewing M., Cassatella A., Wamsteker W., Panagia N., 1987, A&A, 177, L33
- Gerardy et al. (2002) Gerardy C. L., Fesen R. A., Nomoto K., Garnavich P. M., Jha S., Challis P. M., Kirshner R. P., Höflich P., Wheeler J. C., 2002, ApJ, 575, 1007
- Glass (1999) Glass I. S., 1999, Handbook of Infrared Astronomy, Cambridge University Press, Cambridge, U.K.
- Gordon et al. (2005) Gordon K. D., Rieke G. H., Engelbracht C. W., Muzerolle J., Stansberry J. A., Misselt K. A., Morrison J. E., Cadien J., Young E. T., Dole H., et al. 2005, PASP, 117, 503
- Hamuy & Suntzeff (1990) Hamuy M., Suntzeff N. B., 1990, AJ, 99, 1146
- Herrmann et al. (2008) Herrmann K. A., Ciardullo R., Feldmeier J. J., Vinciguerra M., 2008, ApJ, 683, 630
- Karachentsev et al. (2000) Karachentsev I. D., Sharina M. E., Huchtmeier W. K., 2000, A&A, 362, 544
- Kennicutt et al. (2003) Kennicutt R. C., Armus L., Bendo G., Calzetti D., Dale D. A., Draine B. T., Engelbracht C. W., Gordon K. D., et al. 2003, PASP, 115, 928
- Kirshner et al. (1973) Kirshner R. P., Oke J. B., Penston M. V., Searle L., 1973, ApJ, 185, 303
- Kotak et al. (2005) Kotak R., Meikle P., van Dyk S. D., Höflich P. A., Mattila S., 2005, ApJ, 628, L123
- Kotak et al. (2009) Kotak R., Meikle W. P. S., Farrah D., Gerardy C. L., Foley R. J., Van Dyk S. D., Fransson C., Lundqvist P., Sollerman J., Fesen R., Filippenko A. V., Mattila S., Silverman J. M., Andersen A. C., Höflich P. A., Pozzo M., Wheeler J. C., 2009, ApJ, 704, 306
- Kozasa et al. (1989) Kozasa T., Hasegawa H., Nomoto K., 1989, ApJ, 344, 325
- Li et al. (1993) Li H., McCray R., Sunyaev R. A., 1993, ApJ, 419, 824
- Li et al. (2005) Li W., van Dyk S. D., Filippenko A. V., Cuillandre J.-C., 2005, PASP, 117, 121
- Lucy et al. (1989) Lucy L. B., Danziger I. J., Gouiffes C., Bouchet P., 1989, in Tenorio-Tagle G., Moles M., Melnick J., eds, IAU Colloq. 120: Structure and Dynamics of the Interstellar Medium Vol. 350 of Lecture Notes in Physics, Berlin Springer Verlag, Dust Condensation in the Ejecta of SN 1987A. p. 164
- Maguire et al. (2010) Maguire K., di Carlo E., Smartt S. J., Pastorello A., Tsvetkov D. Y., Benetti S., Spiro S., Arkharov A. A., et al. 2010, MNRAS, 404, 981
- Maiolino et al. (2004) Maiolino R., Schneider R., Oliva E., Bianchi S., Ferrara A., Mannucci F., Pedani M., Roca Sogorb M., 2004, Nature, 431, 533
- Makovoz et al. (2006) Makovoz D., Roby T., Khan I., Booth H., 2006, in SPIE Conference Series Vol. 6274, . p. 10
- Mathis et al. (1977) Mathis J. S., Rumpl W., Nordsieck K. H., 1977, ApJ, 217, 425
- Meikle et al. (2011) Meikle W. P. S., Kotak R., Farrah D., Mattila S., Van Dyk S. D., Andersen A. C., Fesen R., Filippenko A. V., Foley R. J., Fransson C., Gerardy C. L., Hoeflich P. A., Lundqvist P., Pozzo M., Sollerman J., Wheeler J. C., 2011, ApJ, 732, A109
- Meikle et al. (2007) Meikle W. P. S., Mattila S., Pastorello A., Gerardy C. L., Kotak R., Sollerman J., Van Dyk S. D., Farrah D., Filippenko A. V., Höflich P., Lundqvist P., Pozzo M., Wheeler J. C., 2007, ApJ, 665, 608
- Meixner et al. (2010) Meixner M., Smee S., Doering R. L., Barkhouser R. H., Miller T., Orndorff J., Knezek P., Churchwell E., Scharfstein G., Percival J. W., Mills D., Corson C., Joyce R. R., 2010, PASP, 122, 451
- Misra et al. (2007) Misra K., Pooley D., Chandra P., Bhattacharya D., Ray A. K., Sagar R., Lewin W. H. G., 2007, MNRAS, 381, 280
- Nozawa et al. (2003) Nozawa T., Kozasa T., Umeda H., Maeda K., Nomoto K., 2003, ApJ, 598, 785
- Nugent et al. (2006) Nugent P., Sullivan M., Ellis R., Gal-Yam A., Leonard D. C., Howell D. A., Astier P., Carlberg R. G., Conley A., Fabbro S., Fouchez D., Neill J. D., Pain R., Perrett K., Pritchet C. J., Regnault N., 2006, ApJ, 645, 841
- Panagia (2003) Panagia N., 2003, in K. Weiler ed., Supernovae and Gamma-Ray Bursters Vol. 598 of Lecture Notes in Physics, Springer Verlag, . pp 113–144
- Patat et al. (1994) Patat F., Barbon R., Cappellaro E., Turatto M., 1994, A&A, 282, 731
- Pozzo et al. (2006) Pozzo M., Meikle W. P. S., Rayner J. T., Joseph R. D., Filippenko A. V., Foley R. J., Li W., Mattila S., Sollerman J., 2006, MNRAS, 368, 1169
- Sahu et al. (2006) Sahu D. K., Anupama G. C., Srividya S., Muneer S., 2006, MNRAS, 372, 1315
- Schlegel et al. (1998) Schlegel D. J., Finkbeiner D. P., Davis M., 1998, ApJ, 500, 525
- Stetson (1987) Stetson P. B., 1987, PASP, 99, 191
- Sugerman et al. (2005) Sugerman B. E. K., Crotts A. P. S., Kunkel W. E., Heathcote S. R., Lawrence S. S., 2005, ApJSS, 159, 60
- Sugerman et al. (2006) Sugerman B. E. K., Ercolano B., Barlow M. J., Tielens A. G. G. M., Clayton G. C., Zijlstra A. A., Meixner M., Speck A., Gledhill T. M., Panagia N., Cohen M., Gordon K. D., Meyer M., Fabbri J., Bowey J. E., Welch D. L., Regan M. W., Kennicutt R. C., 2006, Science, 313, 196
- Sugerman et al. (2002) Sugerman B. E. K., Lawrence S. S., Crotts A. P. S., Bouchet P., Heathcote S. R., 2002, ApJ, 572, 209
- Suntzeff & Bouchet (1990) Suntzeff N. B., Bouchet P., 1990, AJ, 99, 650
- Szalai et al. (2011) Szalai R., Vinko J., Balog Z., Gaspar A., Block M., Kiss L. L., 2011, A&A, 527, A61
- Thatte et al. (2009) Thatte D., Dahlen T., others 2009, NICMOS Data Handbook. Space Telescope Science Institute, Baltimore, MD, USA, 8.0 edn
- Todini & Ferrara (2001) Todini P., Ferrara A., 2001, MNRAS, 325, 726
- Tomaney & Crotts (1996) Tomaney A. B., Crotts A. P. S., 1996, AJ, 112, 2872
- Walker & Suntzeff (1991) Walker A. R., Suntzeff N. B., 1991, PASP, 103, 958
- Welch et al. (2007) Welch D. L., Clayton G. C., Campbell A., Barlow M. J., Sugerman B. E. K., Meixner M., Bank S. H. R., 2007, ApJ, 669, 525
- Wesson et al. (2010) Wesson R., Barlow M. J., Ercolano B., Andrews J. E., Clayton G. C., Fabbri J., Gallagher J. S., Meixner M., Sugerman B. E. K., Welch D. L., Stock D. J., 2010, MNRAS, 403, 474
- Wooden et al. (1993) Wooden D. H., Rank D. M., Bregman J. D., Witteborn F. C., Tielens A. G. G. M., Cohen M., Pinto P. A., Axelrod T. S., 1993, ApJSS, 88, 477
- Woosley et al. (1989) Woosley S. E., Hartmann D., Pinto P. A., 1989, ApJ, 346, 395
- Zubko et al. (1996) Zubko V. G., Mennella V., Colangeli L., Bussoletti E., 1996, MNRAS, 282, 1321
- Zwitter et al. (2004) Zwitter T., Munari U., Moretti S., 2004, IAU Circ., 8413, 1
Appendix A Photometric data processing
A.1 Mid-IR data processing
The earliest Spitzer data for the field around SN 2004et were obtained by the SINGS Legacy team (Kennicutt et al. 2003), who produced enhanced data products which could be downloaded from the SINGS Legacy Data Deliveries section444http://ssc.spitzer.caltech.edu/legacy/singshistory.html of the SSC website. The MIPS 24 m mosaic of NGC 6946 (providing a pre-explosion image of the field around SN 2004et at day -75) were downloaded from the SINGS fifth and final data delivery. The mosaic was created from multiple Spitzer images obtained in scan-mapping mode over two days (75 and 73 days prior to the explosion of SN 2004et) and processed with the MIPS Data Analysis Tool version 3.06 (Gordon et al. 2005), along with additional custom processing by the SINGS team.
However, the enhanced SINGS IRAC data were not used, due to the unusually long time span between the two observations of NGC 6946 ( six months, compared to the usual one or two days) which were combined by the SINGS team to construct the final enhanced mosaic. Instead, the standard BCD pipeline data for each day (corresponding to the pre-explosion image at day -104 and the first mid-IR post-explosion image at day 64) were downloaded from the Spitzer archive and processed along with the rest of the Spitzer observations as described below.
The basic calibrated data (BCD) from the Spitzer pipeline were combined into final mosaic images using the Spitzer MOPEX software package (Makovoz et al. 2006), which includes outlying-pixel rejection, background matching, and mosaicing with drizzling to increase the sampling of the point-spread function (PSF). The IRAC and MIPS data were re-drizzled to plate scales of 075/pixel and 15/pixel, respectively (compared to the standard Spitzer pipeline products with a spatial sampling of 12/pixel for IRAC and 245/pixel for MIPS), following the pixel sizes adopted by the SINGS team for producing their enhanced data products. The PUI data were re-drizzled to a plate scale of 12/pixel (compared to the standard pipeline data with a spatial sampling of 18/pixel). The final mosaic images for all three Spitzer instruments were calibrated in surface brightness units of MJy sr-1 during the BCD pipeline stage.
For the IRAC and MIPS 24 m data, PSF-matched difference images, which used the pre-explosion SINGS mosaics as the reference images, were produced as follows. The final mosaics produced by MOPEX were geometrically registered to a common reference frame using matching point sources identified within the fields of view, with a 2nd-order general fit within the IRAF geotran task. In all cases, registration residuals were less than 0.1 pixels RMS in both the and dimensions. Once registered, the data were PSF-matched and differenced using the DIFIMPHOT package (Tomaney & Crotts 1996) as implemented and modified by Sugerman et al. (2005). Two approaches were taken to PSF-matching. In the first, an empirical PSF was built for each image using uncrowded point sources combined using the daophot PSF-building tasks (Stetson 1987). In the second, these same tasks were run on a single theoretical PSF available for each Spitzer IRAC and MIPS 24 m image from the archive, after that model had been rotated and scaled according to the data’s particular plate scale and position angle. Images were PSF-matched separately using the empirical and theoretical PSFs, photometrically scaled by the median brightness of a number of matching point sources, and then subtracted to yield the final difference images. In general, the difference images made using the theoretical PSFs were of higher quality (i.e., smaller subtraction residuals and less background noise) since the shapes of Spitzer’s PSFs have varied quite little during its mission. In practice, these techniques allow the reliable detection and measurement of changes in point sources that would be considered below the 1- level in direct, undifferenced images (Sugerman et al. 2002).
For the photometry from the IRAC and MIPS difference images, uncertainties were measured with a custom implementation of an optimal photometry code written for the original version of DIFIMPHOT, which includes the full noise model of the daophot-allstar routine as well as correct noise contributions from both input and reference images and the original sky values in each image prior to pipeline calibration.
The Gemini Michelle data were downloaded from the Gemini Science Archive and processed with the Gemini IRAF midir tasks and further cleaning procedures. The fluxes, or upper limits, in counts measured from the final average-combined images were converted to flux density units by multiplying by flux conversion factors derived from aperture photometry of standard stars.
A.2 Optical and near-IR data processing
Gemini/GMOS-N On days 317, 404, and 664, 60 s images were taken with GMOS-N in the , , and broad-band filters. Longer exposures of 2 600 s in the same filters were taken at day 1412 when the SN was expected to have faded. The images were reduced using the Gemini IRAF package. Pipeline processed bias and flat field images were obtained from the Gemini Science Archive. Object images were trimmed, corrected for overscan and bias, and flat-fielded using the gsreduce task. Finally, gmosaic was used to mosaic the three GMOS CCDs into a single image. PSF-fitted photometry was performed on the SN and a sample of standard stars from the photometric V, R, and I sequence of Pozzo et al. (2006) to establish the nightly zeropoint. The GMOS Sloan Digital Sky Survey (SDSS) magnitudes were transformed into Johnson , , and magnitudes using the transformation equations given by Welch et al. (2007). These linear transformations were derived from the photometric V, R, and I sequence presented by Pozzo et al. (2006).
Gemini/NIRI In order to ensure a consistent sky background between exposures, individual exposures of 30 s in each of the broad-band filters were taken, with the total number being dictated by the anticipated decline of the SN NIR light. A 5 ″ dither pattern was employed to ensure efficient removal of point sources while making sky images. Data reduction for each night was performed using the standard NIRI routines within the Gemini IRAF package. nprepare and niflat were used to derive the normalized flat field and the bad pixel mask while nisky was used to create the final sky image. nireduce was used to subtract this sky image from and apply the flat field correction to the processed object images. Finally, the individual images in each filter were coadded using the GEMTOOLS routine imcoadd. PSF-fitted photometry was performed on SN 2004et and three standard stars present within the field. The magnitudes of the standard stars are contained within the 2MASS catalogue and were used to derive the nightly zeropoint in each filter. The photometric uncertainty is dominated by the standard deviation of the zeropoint derived from the three standard stars.
Tenagra and Steward/Bok These early optical and NIR data were reduced, calibrated and measured in a similar manner to the GMOS-N and NIRI observations described above, using standard routines within IRAF. The data were bias and dark subtracted, flat-fielded, and the multiple exposures were combined to form the final image.
HST WFPC2 and NICMOS2 For the WFPC2 observations, imaging with the broadband F606W and F814W filters was used to measure the - and -band flux densities. For the NICMOS2 observations, imaging was carried out with the F110W, F160W, and F205W filters, most closely representing the standard -bands. Small-scale dithering was employed for both instruments to improve S/N, remove cosmic rays and to improve the pixel-scale of the final images by drizzle techniques. The WFPC2 observations used a 4-point dither 400 s exposure for each band. The NICMOS2 observations used a 5-point dither 128 s in the F110W and F205W filters and a 4-point dither 128 s for F160W.
The data were reduced and calibrated using the IRAF external package stsdas (version 3.8) and included the removal of cosmic rays and other artifacts, as well as linearity corrections. High-resolution images were created using the stsdas/drizzle package and additional distortion correction and alignment was performed using background stars. The point spread function of these reference background stars were fit by Gaussian profiles to obtain accurate positions, and then instrumental distortions were corrected with the IRAF tasks xyxymatch, geomap, and geotran. The resultant pixel scale is 0.02″ pixel-1 in the WFPC2 images and 0.04″ pixel-1 in the NICMOS2 images. The FWHM of the PSFs was 3 pixel. Flux measurements were performed using the IRAF daophot tasks. For the WFPC2 data, HST magnitudes were converted to the Johnson-Cousins system using the transforms of Dolphin (2000, 2009), which include charge transfer efficiency (CTE) corrections.
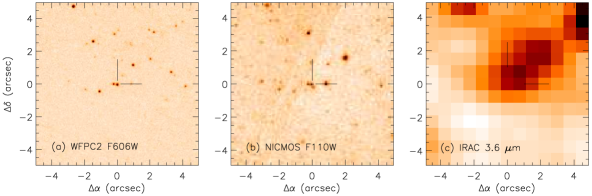
Whilst the broad band NICMOS filters, F110W, F160W and F205W, are roughly equivalent to the , and filters respectively, colour transformations are not well constrained for late-time SN spectra at NIR wavelengths, and consequently magnitudes were not converted to the standard photometric system. The late-time HST-NICMOS magnitudes listed in Table 6 are for the HST filters in the Vegamag system, which uses an estimate of the flux density of Vega, from synthetic spectra integrated over the NICMOS bandpasses, as a photometric zeropoint. For each filter and epoch, the measured count rate (, in units of DN s-1) at the position of the SN was converted to flux by multiplication with the (Jy s DN-1) conversion factor given in the fits header, where is the bandpass-averaged flux density for a source that would produce a count rate of 1 DN-1. An approximate Vega-normalised magnitude was then calculated from the following equation (NICMOS data handbook; Thatte et al. 2009):
where is the bandpass
averaged flux density (in Jy) for the NICMOS filters using a model
reference spectrum of Vega555Taken from the NIC2 table of
Photometric Keywords and Vegamag Zeropoints at
http://www.stsci.edu/hst/nicmos/performance/photometry/postncs_keywords.html
(Bohlin 2007) and is the magnitude of Vega, which is
defined to be 0.00 mag under the California Institute of Technology
(CIT) infrared photometry scale.
WIYN/WHIRC The WHIRC (Meixner et al. 2010) has a 20482048 HgCdTe VIRGO detector with a pixel scale of 01 pixel-1. Sky conditions during the observation were fair, with a seeing of 08. To minimise the effects of high background levels and pixel-to-pixel variations on the array, dithering techniques were employed whereby the source was offset in each frame of a series of exposures. The offset images were used for sky level corrections. Data reduction was carried out using standard IRAF tasks. The array linearity correction was performed using the WHIRC task wprep and a distortion correction was applied using files downloaded from the WIYN-WHIRC web page666http://www.noao.edu/wiyn/. A selection of 2MASS stars close to SN 2004et were used for final flux calibration, and flux measurements were performed using the IRAF daophot package.
The WIYN -band observation of SN 2004et on day 1803 was the last of our NIR observations of the SN, some 5 years after explosion. The SN was not clearly detected due to the contribution from neighbouring stars that were resolved in the high-resolution HST-NICMOS observations (on days 1019 and 1215; see the following section). Consequently, an upper limit to the magnitude was derived. The magnitude in an aperture of radius 06 ( 17 pc, for the adopted distance of 5.9 Mpc) was measured using the IRAF daophot tasks. Estimated contributions from 3 neighbour stars resolved in the high-resolution NICMOS filter ( band) were measured from the NICMOS data and subtracted from the WIYN magnitude to provide the final upper limit presented in Table 6.
A.3 Late-time high resolution HST images
The late-time high resolution HST images reveal that the single point source seen at the SN position in the Spitzer images is actually a complex field comprised of at least 3 sources. Figure 12 shows example HST WFPC2 () and NICMOS () images from July 2007 (day 1019) compared to the Spitzer IRAC 3.6-m image from August 2007 (day 1054). Each field of view is centred on the position of the SN and a source is located at this position indicated by the cross-hairs. The star to the east (“star 2”) was detected in both WFPC2 filters and all three NICMOS filters at days 1019 and 1215. The third star to the south of the SN position (“star 3”) was detected in all three NICMOS bands but was not detected in the WFPC2 filters at either epoch.
The magnitude of star 2 was measured from the WFPC2 images and transformed to and band magnitudes as described previously for the SN.
The and magnitudes of star 2 were de-reddened using E(B – V) = 0.41 mag (Zwitter et al. 2004) and adopting the extinction law of Cardelli et al. (1989) with , corresponding to mag. The intrinsic colour was then used to estimate an band magnitude using a table of intrinsic colours as a function of spectral type compiled by the Space Telescope Science Institute (STScI)777http://www.stsci.edu/ inr/intrins.html based on the work of Fitzgerald (1970) and Ducati et al. (2001). The derived colour index of indicated star 2 was probably a K1.0 star with an intrinsic magnitude of 22.5. The equivalent reddened magnitude of 23.53 0.50 was in reasonable agreement (within the errors) with a magnitude estimated from fitting two PSFs to the blended ‘SN plus star 2’ in the -band GMOS-N image at day 1412. This PSF-fitted measurement gave an band magnitude for star 2 of 23.63 0.19. A band magnitude for star 2 of 25.46 0.50 was estimated in the same way.
The estimated reddened and magnitudes of star 2, together with the measured and magnitudes, were subtracted from the optical magnitudes of SN 2004et obtained from the Subaru-FOCUS and GMOS-N observations from day 646 onwards. During this time the SN had faded substantially such that the neighbouring star 2 made a significant contribution to the brightness measured at those epochs. At day 646, the estimated contribution from star 2 was 8 % in the band and 10 % in the band, whilst by day 1412, the contribution was almost half that of the total flux in both bands. For epochs earlier than day 500, the brightness contribution from star 2 was 1 %.
The late-time Gemini-NIRI photometry at day 652 has not been corrected for contamination by stars 2 and 3. As previously explained, the NICMOS magnitudes are listed in the HST Vegamag system, and were not converted to the standard photometric system since colour transformations are not well constrained for late-time SN spectra at NIR wavelengths. It is possible that these neighbouring stars made a small but significant ( 10 %) contribution to the brightness measured in the NIRI observations at day 652, so the uncertainties on the day 690 interpolated flux densities in Table 6 have been increased to reflect this, by adding a further 10 % error in quadrature to the original flux uncertainty.