Size control of Charge-Orbital Order in Half-Doped Manganite, La0.5Ca0.5MnO3
Abstract
Motivated by recent experimental results, we study the effect of size reduction on half-doped manganite, La0.5Ca0.5MnO3, using the combination of density functional theory (DFT) and dynamical mean field theory (DMFT). We find that upon size reduction, the charge-ordered antiferromagnetic phase, observed in bulk, to be destabilized, giving rise to the stability of a ferromagnetic metallic state. Our theoretical results, carried out on defect-free nanocluster in isolation, establish the structural changes that follow upon size reduction to be responsible for this. Our study further points out the effect of size reduction to be distinctively different from application of hydrostatic pressure. Interestingly, our DFT+DMFT study, additionally, reports the correlation-driven stability of charge-orbitally ordered state in bulk La0.5Ca0.5MnO3, even in absence of long range magnetic order.
pacs:
68.65.-k,71.27.+a,71.15.MbSize controls the physical properties of materials and can hence be employed to make materials functional. For strongly correlated materials, theoretical modelling of such phenomena is rare. Here, we pursue such a study taking the case of half-doped manganites. The charge and orbitally ordered state observed in half-doped manganites is one among the rich variety of fascinating phenomena exhibited by perovskite manganites R1-xAxMnO3 (R= rare-earth element; A= alkali-earth element).1-2 The charge-ordered (CO) state is associated with a real space ordering of Mn3+/ Mn4+ species in a 1:1 pattern. It is accompanied by orbital ordering (OO) and a structural change from orthorhombic to monoclinic symmetry which gives rise to an insulating ground state.3 ; 4 ; 5 ; 7 ; 8 The insulating CO state has been reported to be destabilized to a ferromagnetic (FM) metallic phase by various means that include a magnetic field,9 doping, biaxial strain, pressure,10-11 and electric field.12-13 Very recently, it has been shown in a few experimental studies14 ; 15 ; new that the destabilization of the CO state can be achieved even through size reduction. This interesting phenomenon adds another dimension, namely size, to the problem. Size control is attractive from a technology point of view, which is achievable chemically in a low-cost way. The route through size control also opens up the possibility of exploring the tunability of the CO-OO state and the associated metal-insulator transition.
In this letter, we study the effect of size reduction on the CO-OO state of La0.5Ca0.5MnO3 (LCMO) by using a combination of First-principles DFT and DMFT. For the DFT calculations, we used a combination of two methods: (a) plane wave-based pseudopotentials,vasp and (b) muffin-tin orbital (MTO) based on linear muffin-tin orbitallmto (LMTO) and N-th order MTO (NMTO).nmto For (a) we used projected augmented wave pseudopotentials with an energy cutoff of 450 eV. We used a spin polarized generalized gradient approximation (GGA).PBE From a self-consistent DFT calculation, a low-energy Mn-eg only model Hamiltonian was constructed using NMTO-downfolding technique.nmto The corresponding Hubbard Hamiltonian defined in the downfolded NMTO basis was solved using DMFT, in the same spirit as previously carried out in in Ref. Yamasaki06a, in the context of pure LaMnO3. The low-energy model Hamiltonian consists of two orbitals per Mn ion with intra-orbital Coulomb interaction eV and Hund’s exchange eV which are coupled by eV to a (classical) spin representing the half-filled and immobile electrons. The DMFT equations were solved by Hirsch-Fye quantum Monte Carlo simulations HF , and, because of the CO ordering, it was necessary to explicitly consider a site-dependent double counting correction.Anisimov91
Bulk LCMO shows a CO transition at Tco = 155 K. Below 155 K, the crystal structure is of monoclinic symmetry (P21/m) and an antiferromagnetic (AFM) order sets in.16 The magnetic structure, the so called “CE” order, consists of zig-zag FM chains that are coupled antiferromagnetically in the crystallographic plane. The planes are stacked antiferromagnetically along the crystallographic -direction. A noteworthy feature of the crystal structure is that while the Jahn-Teller (JT) distortion is sizable for the bridge-site Mn atoms (Mn1) with two long bonds along the FM chain and four short bonds, the corner-site Mn atoms (Mn2) on the zigzag chains have negligible distortion with nearly similar Mn-O bondlengths. Average Mn2-O distance is smaller than that of Mn1-O.3 Our DFT calculations carried out on the experimentally measured structure,3 henceforth, referred as Sex, showed the CE insulating phase to be stable by 18 meV/f.u. over the FM metallic solution. The calculated electronic structure in terms of density of states and magnetic moments are found to be in good agreement with those reported previously in literature.17
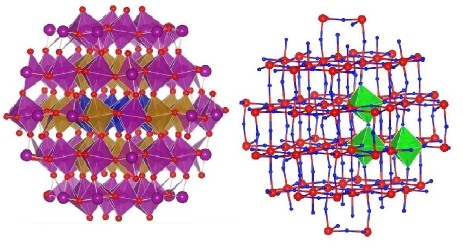
In order to study the problem of nanoscale LCMO we first created a large supercell in the monoclinic structure, from which a cluster of diameter 2 -3 nm having approximate spherical shape was cut out (cf Fig. 1, left panel), in which we carried out a full structural optimization. Following this procedure, the 2 nm cluster contains a total of 370 atoms and the 3 nm cluster contains a total of 700 atoms, pushing it to a limit of our DFT structural optimization. In the construction of the clusters, care has been taken to maintain the stoichiometry as closely as possible. For the cluster calculation, a simple cubic supercell was used with periodic boundary conditions, where two neighboring clusters were kept separated by 10 Å, which essentially makes the interaction between cluster images negligible. The positions of the atoms were relaxed towards equilibrium, using the conjugate gradient technique until the Hellmann-Feynman forces became less than 0.001 eV/Å.
The considered DFT cluster sizes are smaller than the experimental realizations 14 of sizes 15 nm. Hence only the inner region of the above constructed clusters of 2-3 nm size, is expected to mimic the prototypical behavior of the experimentally studied clusters. In order to understand the consequences of the size-controlled structural changes for such relatively larger clusters, we hence constructed a model bulk system, which we refer as Smodel. It is built out of the structural units belonging to the innermost core and the next to the core layer of the optimized LCMO in the nanoscale geometry, (referred as Snano), as shown in the right panel of Fig. 1, and subsequently imposing the symmetry considerations. The detailed procedure of construction of model system is explained in the supplementary information (SI). Construction of Smodel leads to consideration of the the local oxygen environments around Mn atoms as well as the tilt and rotation connecting two MnO6 octahedra, same as that in core region of Snano. The lattice parameters and the Mn-O bond lengths of Smodel are compared to the bulk structure in Table I. The detailed structural information can be obtained in SI. Note, for the bulk, we have considered the theoretically optimized structure, referred as Sbulk, in order to compare with parameters of Smodel in the same footing. We find that the lattice parameters of Smodel show substantial reduction compared to those of the bulk system. The change in parameter appears to be the largest with a change of about 0.20 Å, with moderate changes in and parameters, of 0.09 Å’s. Qualitatively, this trend of reduction in lattice parameters and also the nature of reduction agrees very well with the crystal structure data extracted from X-ray diffraction of nanoclusters of LCMO of 15 nm size [cf. Fig 4 in Ref.14, (a)]. We note that the reduction in lattice parameters in the model structure gave rise to about 6 reduction in the volume compared to that of the bulk system; the first experiments14 report a 2 reduction. The 6 reduction was obtained for Smodel constructed out of Snano of 3 nm, while a similar procedure for Snano of 2 nm, gave rise to larger volume reduction ( 8 ). This indicates the volume reduction to increase upon decreasing cluster size, justifying the difference between the obtained volume reduction on 2-3 nm cluster and experimentally observed volume reduction on 15 nm cluster. One of the important structural quantities is the orthorhombic strain: OS gives the strain in the plane, while OS is that along the -axis. For Sbulk, the orthorhombic strain is highly anisotropic with a negligible value of OS∥ ( 0.002) and a high value of OS⟂ ( 0.021). For Smodel, we find instead the orthorhombic strains to be comparable (OS∥ 0.02 and OS⟂ 0.01). This trend is also in very good agreement with experimental results.14 It confirms that our constructed model structure captures the essential structural changes in the nanoscale surprisingly well. This proves that the role of surface beyond what is already taken into account in construction of model structure, is small.
| Sbulk | Smodel | |
| Lattice | = 5.47, = 7.58 | = 5.28, = 7.49 |
| param. | = 5.48 | = 5.39 |
| Mn1-O: | 2.18 1.93 1.94 2.02 | 1.97 1.92 1.91 1.93 |
| Mn2-O: | 1.92 1.92 1.94 1.93 | 1.92 1.88 1.92 1.91 |
Next, we calculated the electronic structure for Smodel and compared it with that of Sbulk. For understanding the results, let us note that the difference between the average Mn1-O and Mn2-O bondlengths is smaller in Smodel than in Sbulk. This leads to the expectation that the charge disproportionation (CD) between Mn1 and Mn2 sites to decrease in Smodel. Furthermore, we note that for Sbulk, the difference between the longest and the shortest Mn-O bondlengths is large for Mn1 and tiny for Mn2. This gives rise to the crystal field splitting () between the two Mn-eg states, Mn- and Mn-, as large as 0.63 eV for Mn1 sites and less than 0.02 eV for the Mn2 sites. In contrast for Smodel, the bond length differences are much more similar for both types of Mn sites. This is reflected in similar ’s for the nano model, i.e., 0.15 eV for Mn1 sites and 0.10 eV for Mn2 sites. Together these two effects weaken CO as well as OO in Smodel. This ordering is important to stabilize the AFM structure found for the bulk. With charge and orbital ordering weakened, we find instead FM to be stable by 20 meV in Smodel. This result is in accordance with the experimental observations.14 ; 15 The microscopic origin of the size controlled transition from AFM to FM, therefore, can be traced back to the size-induced structural changes.
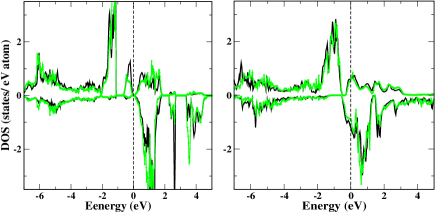
Fig. 2 shows the density of states (DOS) of Sbulk with AFM ordering of Mn spins, in comparison to that of Smodel with FM ordering. Considering the DOS for Sbulk, the crystal field splitting between Mn- and Mn- is clearly seen. In the majority spin channel, Mn- states at Mn1 site are more occupied than the Mn- states at Mn2 site, giving rise to CD between Mn1 and Mn2. We also find OO at Mn1 sites with a preferential occupation of Mn- over Mn-. The CO, although incomplete, together with the AFM spin ordering gives rise to an insulating solution with a small but finite gap at EF already at the DFT level. Considering the DOS of Smodel, we find that the splitting between Mn- and Mn- is less pronounced and the Mn1- and Mn2- states to be similar. The reduced together with the increased bandwidth, compared to the bulk structure, drives Smodel to metallicity with a finite density of states at Fermi energy (EF). The increased bandwidth is caused by the reduction in volume as well as by the FM ordering which allows hopping processes within a double exchange model.de
| Bulk | Nano-model | |
|---|---|---|
| Mn1(1) | 0.87 (0.50) 0.01 (0.11) | 0.52 (0.31) 0.09 (0.20) |
| Mn1(2) | 0.85 (0.47) 0.01 (0.12) | 0.72 (0.38) 0.04 (0.19) |
| Mn2 | 0.04 (0.15) 0.09 (0.25) | 0.16(0.21) 0.16 (0.25) |
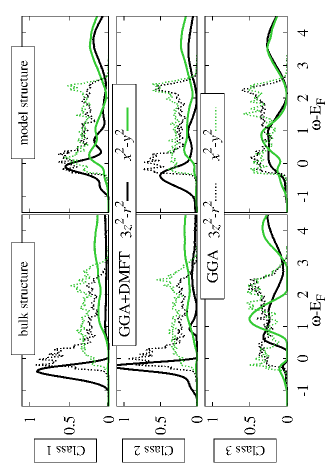
In order to take into account the influence of the missing electronic correlation in GGA, we did paramagnetic DMFT calculations for Sbulk and Smodel structures, considering the low-energy Mn- only Hamiltonian derived out of DFT. Table II lists the the orbital occupations of the three types of inequivalent Mn sites. For Sbulk, already in the DFT (in brackets) the two inequivalent Mn1 (“Mn3+-like”) sites (Mn1(1) and Mn1(2)) are more occupied than the Mn2 (“Mn4+-like”) sites.footnote Besides the CD, there is, as mentioned above, a DFT orbital order. Electronic correlations enhance both kinds of ordering dramatically, making CO and OO nearly complete. This, establishes the correlation driven stability of CO and OO with almost complete CD in a paramagnetic phase. The almost complete CD and enhanced orbital polarization (OP) at the Mn1 sites results in a gap at the chemical potential in the DFT+DMFT spectral function for the bulk structure, as shown in the left panel of Fig. 3, even without spin ordering. Note the opening of charge gap is stabilized by long-range Coulomb interactions which, within DMFT, reduce to their Hartree contribution. This effect is taken into account in our DFT+DMFT calculation on the GGA level. Compared to the DFT spectra, spectral weight is transferred to high frequencies in the form of Hubbard bands, opening a gap at the chemical potential. For the DFT calculation on the other hand, the charge disproportionation is incomplete, and the insulating solution is obtained only by assuming the AFM spin ordering. Turning to Smodel, the DFT occupancies show Mn3+-like and Mn4+-like sites to be similar with only a weak CD. The inclusion of correlation effect through DMFT enhances CD to some extent following the trend seen for Sbulk. However, CD remains incomplete with an average occupation of Mn3+-like and Mn4+-like sites of 0.6-0.7 and 0.3 respectively, in comparison to 0.9 and 0.1 respectively, obtained for Sbulk. This conclusively establishes that size reduction leads to weakening of charge disproportionation. This in turn leads to metallic DFT+DMFT solution for Smodel with finite weight at the chemical potential, as shown in right panel of Fig.3. Note, although Snano does not maintain the strict stoichiometry, the constructed Smodel is strictly stoichiometric, pointing the fact that destabilization of CO is driven by the structural changes due to size confinement, rather than due to deviation from half-doping.
As one of the major structural changes upon size reduction is the volume compression, it is worthwhile to compare the structural and electronic changes induced by size reduction to those occurring under hydrostatic pressure. To this end, we carried out calculations of LCMO, with uniformly reduced lattice parameters with 6 reduced volume, the atomic positions being optimized in DFT, referred as structure Spress. The details of the optimized structure is given in SI. Following the selfconsistent DFT calculations on Spress, the Mn-eg only low-energy Hamiltonian was constructed and the corresponding Hubbard Hamiltonian was solved using DMFT. Compared to Smodel, first of all, we find that at the DFT level, CD and OP is much weaker, even though the volume is the same. With this less polarized starting point, all Mn sites are filled with electrons. In this situation, electronic correlations are less relevant. The DMFT orbital and site occupations remain very similar to the DFT values with - electrons/site, and the system is far away from a metal-insulator transition (MIT). This leads us to conclude that the nanoscopic system is much closer to a MIT than bulk La0.5Ca0.5MnO3 under hydrostatic pressure.note The size reduction and application of hydrostatic pressure, therefore, should be considered as two very different routes.
In conclusion, using DFT calculations combined with DMFT, we have studied the effect of size reduction on charge-orbital order in half-doped LCMO manganites. Our study indicates that the size reduction leads to substantial reduction in volume as well as a change in the nature of the orthorhombic strain. The structural changes under size reduction lead to a weakening of both charge and orbital ordering, making the ferromagnetic metallic state energetically favorable compared to the “CE” type antiferromagnetic insulating state, which is the ground state of the bulk structure. While such effect has been observed, the experimental situation is faced with difficulties, like possible presence of impure phases, the grain boundaries, non-stoichiometry. Our theoretical calculations were carried out considering nanocluster in isolation, and therefore, devoid of such complications. Through construction of model structure, the issue of non-stoichiometry was avoided. Furthermore, the effect of size reduction turned out to be very different from that of pure hydrostatic pressure. We predict the nanoscopic system to be close to the MIT in comparison to the system under hydrostatic pressure with the same amount of volume reduction. Increasing the size of the nanocluster, one would expect to drive the system closer and closer to MIT. It would therefore be possible to tune the LCMO system to the verge of MIT, and thereby, achieve a large magnetoresistive response under small magnetic fields. Finally, while we carried out our investigation on LCMO, the destabilization has been predicted for Pr0.5Ca0.5MnO3 too,pcmo hinting to oberseved effect to be a more general one. This will be taken up in a later study.
We thank A.K. Raychaudhuri and T. Sarkar to bring this problem into our notice, the EU-Indian network MONANI and SFB ViCom F41, GK W004 (AV) and n.M1136 (GS) of the FWF for financial support. Calculations have been done on the Vienna Scientific Cluster.
tanusri@bose.res.in
References
- (1) Y. Tokura, Colossal Magnetoresistive Oxides (Gordon Breach Science Publishers, New York, 2000).
- (2) G. Radaelli et. al., Phys. Rev. B 55, 3015 (1997).
- (3) M. Tokunaga et. al., Phys. Rev. B 57, R9377, (1998).
- (4) M. M. Savosta et. al., Phys. Rev. B, 65, 224418, (2002).
- (5) J. P. Joshi et. al., Phys. Rev. B 65, 024410, (2001).
- (6) J. P. Joshi et. al., J. Mag. Mag. Mat, 279, 91, (2004).
- (7) H.Kuwahara et. al., Science, 270, 961 (1995).
- (8) D.P.Kozlenko et. al., J. Phys. Cond. Mat., 16, 5883 (2004).
- (9) A.Asamitsu et. al., Nature (London), 388, 50 (1997).
- (10) T. Sarkar et. al., Phys. Rev. B 77, 235112 (2008); T. Sarkar et. al., Appl. Phys. Lett 92, 123104 (2008).
- (11) S. S. Rao et. al. App. Phys. Lett, 87, 182503 (2005).
- (12) T. Sarkar et. al., J. App. Phys. 101 124307 (2007).
- (13) G. Kresse and J. Furthmueller, Phys. Rev. B 54, 11169 (1996).
- (14) O. K. Andersen, Phys. Rev. B, 12 3060 (1975).
- (15) O. K. Andersen and T. Saha-Dasgupta, Phys. Rev. B 62, R16219 (2000).
- (16) J. P. Perdew et. al., Phys. Rev. Lett. 77, 3865 (1996).
- (17) A. Yamasaki et al., Phys. Rev. Lett. 96 166401 (2006); Y.-F. Yang and K. Held, Phys. Rev. B 76 212401 (2007); 82 195109 (2010).
- (18) J. E. Hirsch and R. M. Fye, Phys. Rev. Lett. 56 2521 (1986).
- (19) V. I. Anisimov, J. Zaanen and O. K. Andersen, Phys. Rev. B 44 943 (1991).
- (20) E. O. Wollan and W. C. Köhler, Phys. Rev. 100, 545 (1955).
- (21) P. K. de Boer et. al., Solid State Commun. 102, 621 (1997).
- (22) There are three inequivalent classes of Mn atoms in the unit cell, the first two are of nominal valence and the last one is of . The structural parameters corresponding to only the first Mn3+ is shown. Also, for Mn4+-type three bondlengths are shown, taking the average of the pairs in the mentioned directions. For details see Table 2 of SI.
- (23) P. W. Anderson and H. Hasegawa, Phys. Rev. 100 675 (1955); P.-G. DeGennes, Phys. Rev. 118 141 1960).
- (24) Calculation of CD in Pr0.5Ca0.5MnO3 by Anisimov et al. [Phys. Rev. B 55 15494 (1997)] showed negligible CD. The CD obtained in the present case, presumably is driven by the significant JT effect at M1 site.
- (25) Although compression of volume and Mn-O bonds happen both in nanoscale and on application of pressure, the larger OS∥, in case of nanoscale compared to that under pressure makes the Mn-eg bandwidth smaller for the former, through reduction in Mn-O-Mn bond angle.
- (26) T. Sarkar et. al., J. App. Phys, 101, 124307 (2007).