The ISM in distant star-forming galaxies: Turbulent pressure, fragmentation and cloud scaling relations in a dense gas disk at = 2.3
Abstract
We have used the IRAM Plateau de Bure Interferometer and the Expanded Very Large Array to obtain a high resolution map of the CO(6–5) and CO(1–0) emission in the lensed, star-forming galaxy SMM J21350102 at . The kinematics of the gas are well described by a model of a rotationally-supported disk with an inclination-corrected rotation speed, km s-1, a ratio of rotational- to dispersion- support of and a dynamical mass of M⊙ within a radius of 2.5 kpc. The disk has a Toomre parameter, , suggesting the gas will rapidly fragment into massive clumps on scales of pc. We identify star-forming regions on these scales and show that they are denser than those in quiescent environments in local galaxies, and significantly offset from the local molecular cloud scaling relations (Larson’s relations). The large offset compared to local molecular cloud linewidth-size scaling relations imply that supersonic turbulence should remain dominant on scales 100 smaller than in the kinematically quiescent ISM of the Milky Way, while the molecular gas in SMM J2135 is expected to be 50denser than that in the Milky Way on all scales. This is most likely due to the high external hydrostatic pressure we measure for the interstellar medium (ISM), K cm-3. In such highly turbulent ISM, the subsonic regions of gravitational collapse (and star-formation) will be characterised by much higher critical densities, n=108 cm-3, a factor 1000 more than the quiescent ISM of the Milky Way.
Subject headings:
galaxies: starburst, evolution, high-redshift, gas, star-formation; galaxies: individual: SMM J213501021. Introduction
Observations of the molecular gas in galaxies provides important insights into the physics of star formation. Since all stars form out of molecular gas – either in self-gravitating giant molecular clouds (GMCs) in disks such as the Milky Way or distributed in continuous gaseous disks in ultra-luminous infrared galaxies (e.g. ULIRGs; Downes & Solomon, 1998) – studying its thermal and kinematic state is a prerequisite for understanding star formation through-out the Universe. Such observations of the interstellar medium (ISM), especially in the most extreme conditions like those in the high star-formation density environments of local ULIRGs, can provide powerful tests of star-formation theories and the initial conditions of the stellar initial mass function (IMF). In the most energetic systems, strong star-formation feedback, high cosmic-ray energy densities and supernovae-driven shock heating of very turbulent molecular gas allows us to explore uncharted parameter space in current star-formation schemes (Krumholz & McKee, 2005; Papadopoulos et al., 2011).
Given that most of the star formation in the most massive galaxies is claimed to have occurred at –3, an era when the gas accretion rate and molecular gas fractions of galaxies appear to be substantially higher than today (Tacconi et al., 2010; Daddi et al., 2010), examining the physical and dynamical states of the molecular gas in a star-forming system during that era acquires special importance. Evidence is accumulating that the dominant mode of star formation may be very different in early systems than that found in most local disks (e.g. Bournaud & Elmegreen, 2009; Jones et al., 2010). Rather than forming stars within GMCs that condense out of a stable disk, star formation could be triggered by fragmentation of dynamically unstable gas-rich disks. The resulting regions of high-pressure ISM may be conducive to the formation of massive globular clusters, as first postulated by Harris & Pudritz (1994), a model which has since been developed extensively (e.g. Elmegreen & Efremov, 1997; Schweizer et al., 1996; Kravtsov & Gnedin, 2005). Such a star-formation mode likely occurs locally, albeit on more compact scales, in the most extreme merger-driven starbursts (Downes & Solomon, 1998). A spatial resolution of pc is necessary to resolve the expected size of gravitationally unstable regions in gas-rich, star-forming disks, and to probe the masses, sizes and hence densities of the molecular ISM on these scales. For example, the estimated size of the two gas-rich, star-forming disks of Arp 220 – an archetypal ULIRG in the local Universe – is pc, as only recently revealed by sub-millimetre interferometry (Sakamoto et al., 2008). Achieving this spatial resolution within starburst galaxies at ( more distant than Arp 220), with sufficient sensitivity to measure the properties of the molecular ISM, is one of the key science drivers for the Atacama Large Millimetre Array (ALMA). However, prior to full science operation of ALMA, progress can still be made by exploiting rare examples of high-redshift starburst galaxies which have been fortuitously strongly gravitationally lensed by foreground clusters, boosting both the apparent size and flux of the galaxy and so allowing imaging spectroscopy at high spatial resolution with current millimetre arrays.
The recent discovery of a gas-rich starburst galaxy at , SMM J213511.60010252.0 (hereafter SMM J2135; Swinbank et al. 2010), provides just such an opportunity. The apparent brightness of SMM J2135 is due to a factor 35 magnification by the foreground, massive galaxy cluster, MACS J21350102 (Ebeling et al., 2001). This has allowed very detailed studies of the distribution and intensity of star formation and the chemical make-up of the ISM in this example of the cosmologically important high-redshift ULIRG population (Ivison et al. 2010; Danielson et al. 2011). In particular, high-resolution interferometry with the Smithsonian Sub-millimeter Array (SMA) resolved rest-frame 260-m continuum emission in two mirror-image sets of four clumps straddling the critical line. The clumps have physical (source-plane) sizes of –200 pc and are distributed over a region kpc within the background galaxy.
If we can similarly resolve the ISM on 100–200 pc scales, this would allows – for the first time – a direct comparison of the scaling relations found in local molecular clouds: the so-called Larson relations (Larson, 1981). These relate the CO velocity line width of clouds () with their physical extent, (, ) and mean molecular gas density with size (, ). These relations have been found to be valid throughout the Milky Way GMCs as well as in those extra-galactic environments where high-resolution studies of GMCs have been possible (Bolatto et al., 2008). In particular, the universality of the – relation within star-forming GMCs points towards large-scale driving mechanisms, rather than small-scale turbulent energy injection from within molecular clouds, as the origin of interstellar turbulence. The latter is a driver of the properties of star-forming clouds (Heyer & Brunt, 2004) and may define the star-formation efficiency and the resulting stellar Initial Mass Function (IMF) (Klessen, 2004; Larson, 2005; Jappsen et al., 2005; Klessen et al., 2007). In this context, Larson’s relations provide a unique probe of the dynamical state of the turbulent molecular gas in extra-galactic star-forming systems, which are well-calibrated locally and are complementary to molecular line ratios that constrain the density and temperature (i.e. the thermal state) in these environments.
In order to understand the physical processes that drive the apparently high star-formation rates within compact star-forming regions at high redshifts, we have obtained high-spatial-resolution observations of the molecular gas in SMM J2135 traced by the CO(6–5) emission with the IRAM Plateau de Bure Interferometer (PdBI). We use this spatially-resolved CO spectroscopy to probe the dynamics of the galaxy, and the luminosities and dynamics of the star-forming gas. We independently confirm our results using a comparable resolution map of the CO(1–0) data taken with the Expanded Very Large Array (EVLA). In §2 we detail the observations and data analysis. In §3 we discuss the properties of individual star-forming regions. In §4 we discuss the wider context of our results for star-formation theories, and we present our conclusions in §5. Throughout the paper we use a CDM cosmology with H0=72 km s-1 Mpc-1, =0.27 and =1- (Spergel et al., 2003)
2. Observations
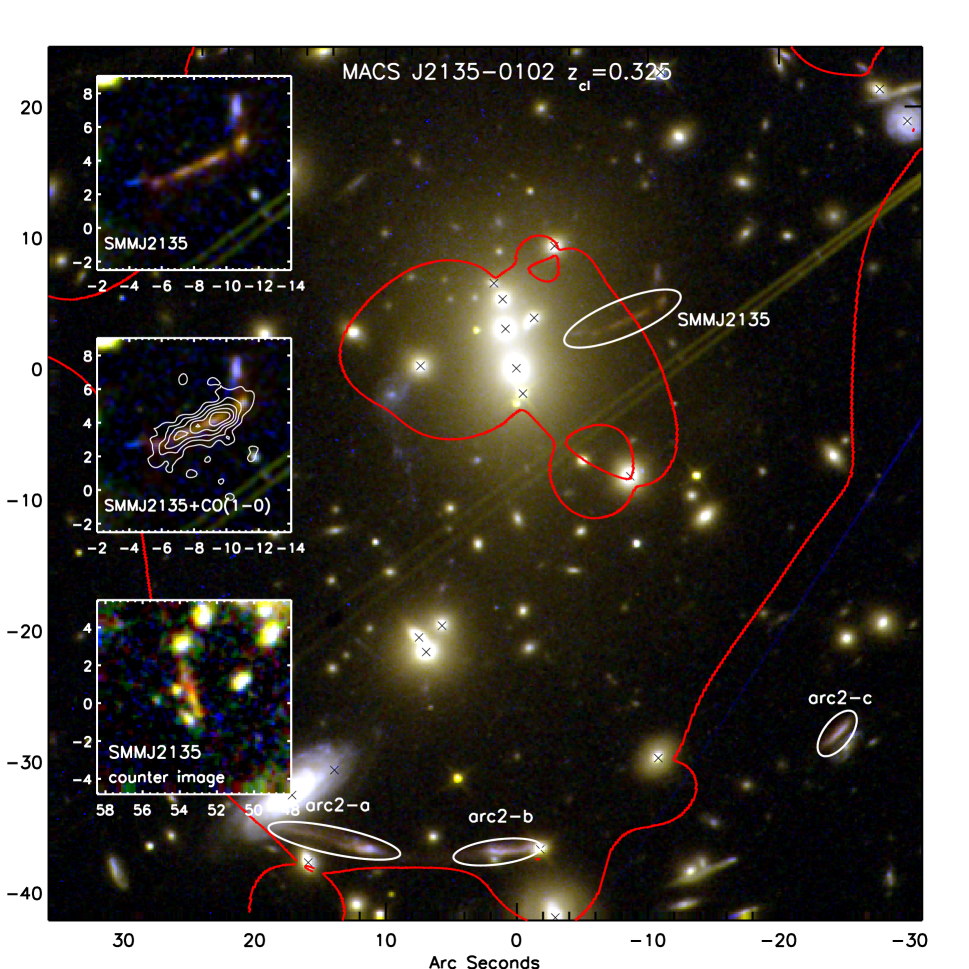
We obtained Hubble Space Telescope (HST) WF3 F110W- and F160W- band images (each of exposure time 1.2 ks) on 2010 August 23 as part of our snapshot program GO# 12166; PI: H. Ebeling). The images comprise three 400 s exposures dithered with a 3′′ spacing. The data were reduced using multidrizzle to provide an image with 0.12′′ sampling and good cosmetic properties. A visual inspection of the image clearly identifies the red, radial image of SMM J2135 located precisely at the position identified by the low resolution discovery- and high-resolution follow-up- observations at 21:35:11.6 -01:02:52.0 (J2000) with a spatial extent of 7.5′′. A search of the WF3 image also reconfirms the counter-image of SMM J2135-0102 at 21:35:15.6 -01:03:13.12 (J2000). In Fig. 1 we show the observed -band colour colour image around the cluster core (see Smail et al. 2007 for a description of the HST -band observations). We also highlight the position of a second triply-imaged system (labelled arc2-a/b/c) located 37′′ due South of the cluster core. We will return to a discussion of this imaging data, in particular in the context of the lens modelling, in § 3.1.
The redshifted CO(6–5) emission from SMM J2135 was observed with the six-element IRAM Plateau de Bure Interferometer (PdBI) at 207.90 GHz in “A” configuration. We obtained a total on-source observing time of 6 hr on 2010 January 6th. In this configuration the synthesised beam for natural weighting is arcsec, at a position angle (PA) of 24.5∘. The spectral correlator was adjusted to give a frequency resolution of 2.5 MHz across the 980-MHz bandwidth. The overall flux density scale was set on MWC349, with observations of 2134+004 for phase and amplitude calibration. Receiver bandpass (RF) calibration was performed on 1749+096. The data were calibrated, mapped and analysed in the gildas software package. In the map, the rms is 1.5 mJy per 25-km s-1 channel. Fitting beams to the velocity integrated cube, we measure a velocity integrated flux of 191 Jy km s-1, thus recovering 90 per cent of the single dish flux (Danielson et al., 2011).
In addition, the redshifted CO(1–0) line emission was observed with the EVLA between 2010 September and 2011 February, as part of the Open Shared Risk Observing (OSRO) period. We programmed the WIDAR correlator to return two sub-bands of -MHz dual-polarisation channels. To avoid centering the line in the noisy channels at the edge of each sub-band, we shifted the centroid into the 40th channel of the lower sub-band, and allowed for 10 channels of overlap between the sub-bands, yielding a total dual-polarisation bandwidth of 236 MHz, or 2,040 km s-1 of velocity coverage across the line.
As a result of dynamical scheduling, data were obtained in excellent weather conditions: yielding seven 2- or 3-hr blocks, totaling 10 and 5 hr in the hybrid DnC and CnB configurations, respectively, although with a similar data volume in each case. During the blocks we switched every few minutes between the target and the nearby, unusually bright (4–5 Jy), compact calibrator, 2136+004, in order to track changes in phase and amplitude, and to determine the spectral response (bandpass). 3C 48 was used to calibrate the flux density scale.
Typically 16 receivers were operational during a CnB block after on-line and manual flagging. These data were processed using standard procedures, as outlined by Ivison et al. (2011). Imaging of the DnC and CnB data was accomplished using imagr, yielding a -arcsec synthesised beam (for robust=5) at PA . In the map, the rms is 0.13 mJy per 25-km s-1 channel. In this cube, we measure a velocity integrated CO(1–0) line flux of of 2.1 Jy km s-1, thus recovering 98 per cent of the peak single-dish flux density (Swinbank et al., 2010).
3. Analysis and Discussion
3.1. Lens modelling
Since a necessary component in interpreting the CO kinematics of SMM J2135-0102 is the reconstruction of the source, we first review the lensing model constraints. The primary constraints on the strong lensing model for MACS J2135-0102 are the redshift and location of the three images of SMM J2135-0102 as well as those of another spectroscopically confirmed triply imaged galaxy at located approximately 37′′ due south of the brightest cluster galaxy (labelled arc2-a/b/c in Fig. 1). A lensing model for the cluster was presented in Swinbank et al. (2010). However, with the spatially resolved spectroscopy provided by our new observations, we can improve the strong lensing constraints using the kinematics of SMM J2135-0102 to precisely locate the =2.32 critical curve.
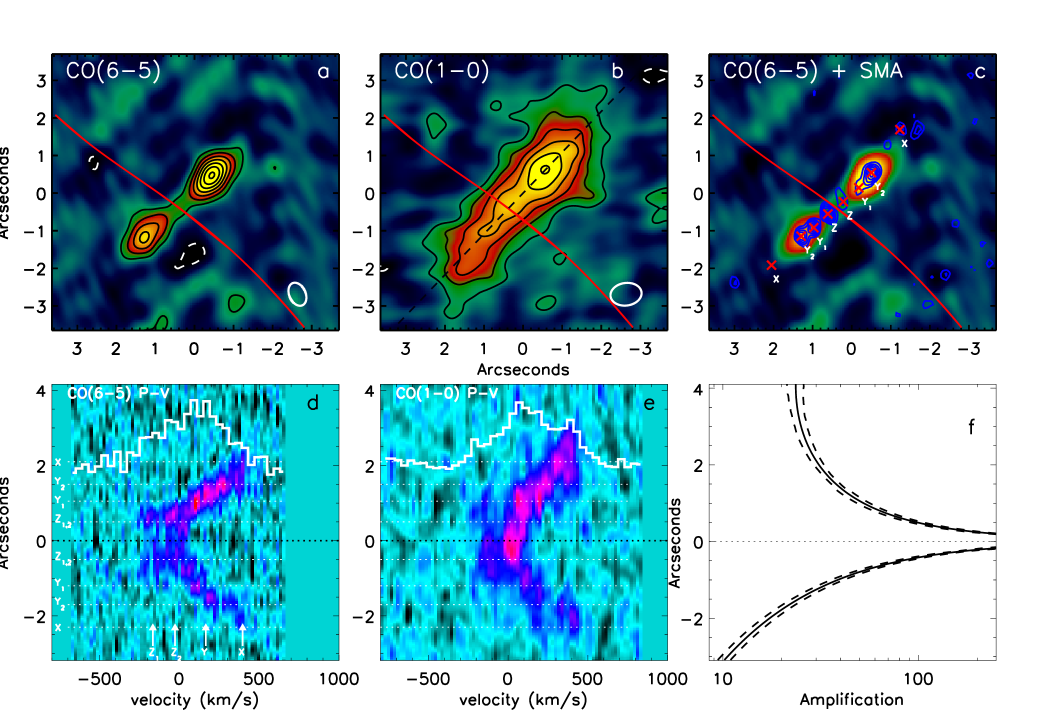
We begin by constructing the velocity-integrated emission line maps from the CO(1–0) and CO(6-5) observations, and as Fig. 2 shows, which are extended on scales of 4–6′′ (see also Fig. 3). We also overlay the observed 870-m continuum emission from Swinbank et al. (2010) which highlights that the positions of the brightest regions in the sub-millimetre continuum appear to broadly align with the molecular gas emission. To investigate the gas dynamics of the galaxy, we extract position–velocity (PV) diagrams from the major axis of the image-plane CO(6–5) and CO(1–0) cubes (at a position angle, PA = 45∘, east of north as highlighted by the dashed line in Fig. 2) and show these in Fig. 3. These PV diagrams show that the galaxy has a velocity gradient of km s-1 across 4–6 arcsec which is folded (mirrored) about the critical curve. The sharp rise and flattening of the CO emission in the PV diagram has the familiar kinematic signature of a rotating system, and we discuss the dynamical properties in § 3.2. The dynamics of the galaxy in the image plane allow us to kinematically locate the position of the critical curve, and by folding and cross correlating the velocity field with itself, we kinematically locate it 0.30.1′′ further south than first chosen by Swinbank et al. (2010) (where it was identified from high resolution imaging alone). We therefore update the lensing model accordingly and briefly discuss the lens model here.
The cluster lensing model for MACS J2135-0102 is derived using the lenstool code (Kneib et al., 1996; Jullo et al., 2007) which employs a parametric model of the mass distribution (Richard et al., 2009, 2010). We use a model with a single cluster-scale mass component (dark matter halo), as well as individual galaxy-scale mass components centered on each cluster member (selected from their colours and shown on Fig. 1). We parametrise the galaxy-scale mass components as truncated pseudo-isothermal elliptical mass distributions, each described by the following parameters: (Kassiola & Kovner, 1993; Kneib et al., 1996) which denote the the [x/y] center, ellipticity, position angle, core radius, cut-off radius and velocity dispersion respectively. To reduce the number of free parameters and match the constraints above, the geometrical parameters () describing the cluster galaxies (including the brightest cluster galaxy) are matched to their 2-dimensional light distributions. We assume that the cluster galaxies follow a scaling relation with constant mass-to-light ratio according to an L∗ cluster galaxy, and their respective and parameters are scales accordingly (Richard et al., 2010). Turning to the parameters describing the cluster-scale mass, we fix at which is motivated by its very small influence on the location of the critical line at large values. This leaves [x,y] , , and as variables.
The primary constraints in defining an acceptable strong lens model for cluster lensed are that it reproduces the locations and redshift of the spectroscopically confirmed triple-image lens systems (e.g. Smith et al., 2009), and in the case of MACS J2135-0102 we also demand that it precisely predicts the location of the critical curve. The best-fit model (Table 1) obtains a fit with an r.m.s. of 0.15′′ between the predicted and observed positions of the multiple images. Since the lenstool code incorporates a Markov Chain Monte Carlo (MCMC) sampler, we also generate 1000 error models that lie within the confidence intervals around the best fit parameters (after marginalising over the other parameters in each case), and construct the amplification maps in each case. In the best fit model, the cluster-scale component is centered South East of of the BCG (Table 1), and the enclosed mass within an aperture of 250 kpc is M=3.30.31014 M⊙ with an Einstein radius of =34.52.0′′ for =2.32 (Richard et al. 2011 in prep). In Fig. 1& 2 we show the critical curve on the HST and CO imaging, as well as amplification as a function of position across the long axis of the arc (and the associated 1 error from the family of models which adequately describe the lensing mass). The updated model suggests a luminosity weighted amplification of the system of =37.54.5 which higher, but within 1 of the previous estimate of 32.54.5 from Swinbank et al. (2010).
Gravitational Lens Model Parameters
| (′′) | (′′) | (deg) | (kpc) | (kpc) | (km/s) | ||
|---|---|---|---|---|---|---|---|
| DM halo | -0.70.8 | -2.50.5 | 0.250.10 | -202 | 838 | [1000] | 119030 |
| BCG | [] | [0.0] | [0.15] | [148] | [0.2] | 1588 | 2627 |
| L∗ galaxies | - | - | - | - | [0.15] | [45] | 17918 |
3.2. Gas distribution and dynamical properties
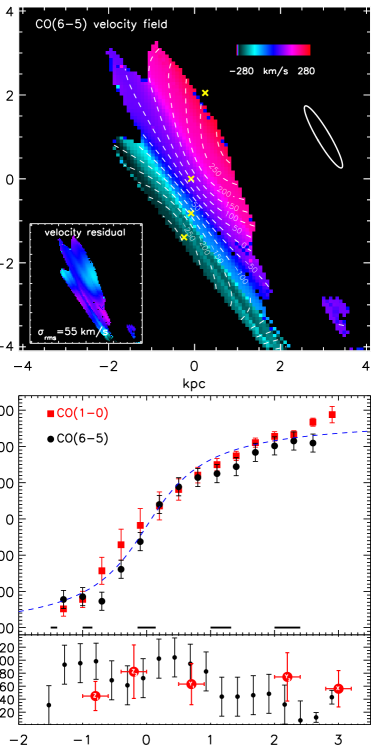
To construct a two-dimensional map of the velocity field from the CO emission in the source plane we use the best-fit lensing model to calculate the mapping between image- and source- plane, and ray-trace each pixel to re-construct the source-plane datacube. We then fit the CO(6–5) emission at each pixel with a Gaussian profile using a minimisation procedure, accepting a fit only if the emission is detected at . Where a fit is made, we measure the central velocity, line width () and line flux. The resulting source-plane velocity field of the gas is shown in Fig. 4 and resembles a rotating system with a peak-to-peak velocity of km s-1 within a radius of kpc. In Fig. 4, we also show the extracted one-dimensional rotation curve of the CO(6–5) emission as well as the line-of-sight velocity dispersion.
In order to estimate the disk inclination and true rotational velocity, we model the velocity field with a rotating disk. We use an arctan function to describe the shape of the rotation curve such that , where is the asymptotic rotational velocity and is the effective radius at which the rotation curve turns over (Courteau, 1997). We construct the two-dimensional kinematic model for the galaxy using six free parameters: , , , (the central position), PA and disk inclination, , and use a genetic algorithm with random initial values to search for a best fit. We demand generations are performed before testing for convergence to a solution. The best-fit kinematic model is overlaid on Fig. 4 and has kpc, and km s-1, providing an estimate of the dynamical mass of M⊙ for an inclination of . We note that the total gas mass from a large velocity gradient (LVG) analysis, M⊙ (Danielson et al., 2011) together with the total stellar mass, 1010 M⊙ (Swinbank et al., 2010), indicates baryon-dominated dynamics within the extent of the gas disk, (Mgas+M∗)/Mdyn=1.10.2, and a gas fraction of 0.60.1. This suggests a total baryonic mass surface density (stars and gas) within the disk of M⊙ kpc-2.
The ratio of rotation/dispersion within a disk provides an important constraint on the amount of turbulence within the ISM. Nebular emission line studies have shown that high velocity dispersions are a common feature of high redshift galaxies (4–10 higher than comparably luminous local galaxies), possibly related to the high gas fractions and star-formation rates (e.g. Lehnert et al., 2009; Förster Schreiber et al., 2009; Genzel et al., 2011). However, measuring the typical local velocity dispersion is not trivial, especially with low ( kpc) spatial resolution, if the velocity gradient within the beam is much larger than the local velocity dispersion. In this case, beam smearing can produce a large bias in the recovered value (Davies et al. 2011).
Since the spatial resolution obtained by our observations is much higher than typically acheived in high-redshift galaxy studies and the orientation of the glaaxy is such that the maximum amplification is aligned roughly parallel to the velocity gradient, beam smearing has less of an effect on our intrinsic, although a small correction is still needed. The maximum velocity gradient in SMM J2135-0102 is km s-1 pc-1, thus over a beam size of 200 pc there is a maximum contribution of 25 km s-1 to the velocity dispersion. To account for this, we therefore correct the local velocity dispersion in each pixel and determine an average line of sight velocity dispersion of 9112 km s-1 across the galaxy image (we note that if instead we simply measure the uncorrected average line-of-sight velocity dispersion we derive km s-1). Thus, we derive an average inclination-corrected . This is larger than that found in many of the star-forming galaxies studied through their nebular emission (e.g. Förster Schreiber et al., 2009; Law et al., 2009), and similar to that found in some local ULIRGs (Downes & Solomon, 1998).
As an independent check of the kinematics of the gas reservoir in SMM J2135 we use our CO(1–0) map from the EVLA. The resolution of this map is slightly poorer, but still comparable to that of the PdBI CO(6–5) observations, but importantly the CO(1–0) line emission encompasses much cooler and less dense gas (400 cm-3 =5.5 K) associated with non-star-forming ISM in addition to the warmer and denser gas, typically found in star-forming regions which is traced by the CO(6–5) emission ( cm-3, 116 K). The velocity field and rotation curves from CO(1–0) in Fig. 2 show good agreement with those from CO(6–5) although it is clear that the CO(1–0) emission extends at least 1′′ ( kpc) further from the critical curve in both images of the lensed galaxy (even accounting for the slightly larger beam). This bias: much broader and more spatially extended low- line emission compared to high- lines has recently been reported for a number of high-redshift sub-millimetre galaxies (Ivison et al., 2011; Riechers et al., 2011a, b) in addition to low redshift starbursts (e.g. Papadopoulos & Seaquist, 1998; Mao et al., 2000; Weiß et al., 2001, 2005; Walter et al., 2002). A detailed comparison between low- and high- CO emission and the radio continuum emission in SMM J2135 on sub 100 pc scales from A-configuration EVLA observations will be discussed in an upcoming paper (R. Ivison et al., in prep).
3.3. The high-pressure molecular ISM in SMM J2135
The pressure in the ISM – overwhelmingly due to the non-thermal, macroscopic motions in the highly supersonic, turbulent molecular gas – is an important parameter for understanding the formation of stars. It effects the normalisation of the –LCO(1-0) relation (Bryant & Scoville, 1996), Larson’s relations (Chieze, 1987; Elmegreen, 1989a) and the star-formation efficiency (Schaye & Dalla Vecchia, 2008). It also plays a fundamental role in the H i H2 phase transition and thus in the formation of molecular clouds in spiral disks (e.g. Elmegreen, 1993; Honma et al., 1995), and their fragmentation into dense cores (e.g. Chieze & Pineau Des Forets, 1987). Finally, high pressure in a molecular inter-cloud medium may be responsible for the shock compression of individual GMCs as they fall into the central regions of ULIRGs and their subsequent burst of star formation (Solomon et al., 1997).
Before computing the average gas pressure in the ISM in SMM J2135 it is important to note that the existence of random macroscopic gas motions does not automatically imply that the corresponding pressure term is physical and thus dynamically important. This requires a mechanism for momentum transfer between the components to transmit the pressure, and one capable of doing so over a short “collision” mean-free path length with respect to the size of the gas distribution. Direct collisions between kinematically distinct components may not easily satisfy these two criteria in highly supersonic molecular clouds. On the other hand, magnetic field lines “threaded” through the various gas clumps may provide a suitable coupling between molecular clouds (Elmegreen, 1989b). However, it must be noted that the molecular gas in compact starbursts (e.g. ULIRGs – perhaps the closest analogues to SMM J2135) may be very different from that found in the disk of the Milky Way, with a much larger – perhaps dominant – gas-mass fraction at densities of cm-3 (e.g. Gao & Solomon, 2004). At such high densities and in the high-extinction environment of ULIRGs and SMGs, the average ionisation fraction of the gas may be very low, allowing ambipolar diffusion to very effectively remove magnetic field lines from the gas, thereby reducing the coupling between components. Nevertheless, for the purposes of this study we assume that the computed gas pressure is physical and dynamically important.
The dynamics and surface density of gas and stars can be used to estimate the ISM pressure, which can then be compared to that seen in gas-rich galaxies locally. For a rotating disk of gas and stars the external hydrostatic pressure at mid-plane is given by:
| (1) |
where and are the surface density of the gas and stars, and and are the vertical velocity dispersion of the gas and the stars, respectively (with no assumption that the gas scale length is smaller than the stars; c.f. Blitz & Rosolowsky 2006). For the Milky Way this yields cm-3 K (Elmegreen, 1989b). To estimate the stellar surface density in SMM J2135, we use the stellar mass estimate from Swinbank et al. (2010), M⊙ to derive M⊙ pc-2 (and assume that the stars and gas have the same spatial distribution, which is reasonable given the HST and Spitzer IRAC morphologies; Fig. 1 and Swinbank et al. 2010), whilst the gas surface density we derived above as M⊙ pc-2.
The average velocity dispersion of the gas in the disk is km s-1, and we have to assume that the velocity dispersion of the stars is comparable, (although we allow this to vary between 50–150 km s-1 in the following results). The resulting mid-plane hydrostatic pressure is K cm-3. This pressure is higher than the typical ISM pressure in the Milky Way ( K cm-3), and approximately 2– higher than seen in other local, gas-rich environments, such as the Galactic Center or the Antennae (Rosolowsky & Blitz, 2005; Keto & Myers, 1986; Wilson et al., 2003). Only the compact disks in local ULIRGs have comparable mid-plane pressures due to their high gas-mass surface densities ( M⊙ pc-2, Downes & Solomon 1998).
We can compare our measured ISM pressures to estimates for five high-redshift disks galaxies from Genzel et al. (2008) with well-constrained kinematics. Although gas masses do not exist for these galaxies directly, they have been inferred indirectly using the H luminosity density and the Schmidt-Kennicutt relation. This provides an estimate of the likely gas surface density to within a factor depending on the choice of parameters (e.g. Genzel et al. 2010 but see also Papadopoulos & Pelupessy 2010).
The (inferred) median gas mass for the Genzel et al. (2008) sample is 1011 M⊙, with stellar masses of – M⊙ in disks of scale length 4–7 kpc and vertical scale heights of –1.6 kpc (Shapiro et al., 2010). Together, these properties suggest ISM pressures in the range – K cm-3, suggesting that high gas pressures may be a ubiquitous feature of high-redshift, gas-rich systems.
3.4. Disk stability and fragmentation scale
Having establish that the ISM pressure is high, we next examine the susceptibility of the gas disk to collapse. In a rotating disk, perturbations smaller than a critical wavelength, , are stabilised against gravity by the velocity dispersion; those larger than some critical wavelength, , are stabilised by centrifugal force. If the dispersion and rotation velocity are too low, and perturbations of intermediate wavelength grow exponentially. The Toomre parameter, , characterises the stability against local axisymmetric perturbations of a disk supported by differential rotation and random motion (Toomre, 1964). Galaxies with are unstable on scales between and and will fragment into giant, dense clumps. This could trigger star formation in clouds of much higher mass and size than GMCs seen in local spiral galaxies with . Dynamical friction, viscosity and tidal interactions may subsequently cause these clumps to migrate toward the center of the galaxy potential, forming a bulge which stabilises the system against further fragmentation (e.g. Genzel et al., 2008).
The Toomre parameter is calculated from
| (2) |
where is the one-dimensional random velocity dispersion, is the epicyclic frequency and is the surface mass density (Toomre, 1964). The value of is uncertain as it depends on the unknown mass distribution; our observations are consistent with a range – corresponding to constant and , respectively. Disk thickness and gas abundance also affect the value of , and we have assumed that the measured velocity dispersion is equal to . Adopting appropriate for a uniform disk, and using the dynamical mass to estimate the surface mass density, , we find an inclination-corrected (the error is contributed equally from the uncertainty in the dynamical mass and the assumed ). The gas disk in SMM J2135 thus appears to be dynamically unstable (), perhaps more gravitationally unstable than the compact, gas-rich disks residing in ULIRGs where is closer to unity (Downes & Solomon, 1998).
Empirically, this instability will cause large, dense gas condensations to form in the molecular gas distribution. This fragmentation should occur on the scale of the Jeans length for dispersion support. In a uniform disk, the largest scale for which velocity dispersion stabilises against gravitational collapse is:
| (3) |
which can be estimated from the dispersion and dynamical mass density. As with , the unknown mass distribution, disk height, gas content and directional dependence of result in an uncertainty of around 30 per cent. The resulting instability scale is pc and the corresponding unstable mass scale is M⊙, equivalent to the entire molecular gas reservoir of a spiral disk such as the Milky Way.
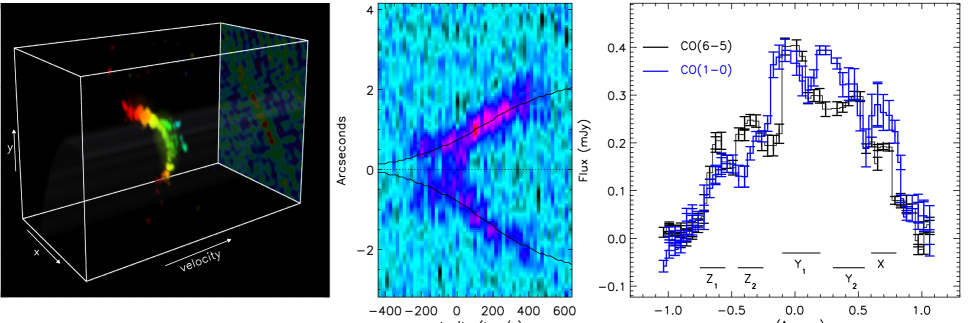
Our previous high-resolution, rest-frame far-infrared imaging has shown that the galaxy contains several bright star-forming regions, with star-formation rates of 30–100 M⊙ yr-1 each (equivalently, luminosities of – L⊙), spread across a radius of kpc (Swinbank et al., 2010). Although the velocity integrated CO(6–5) emission line maps appear smooth, Fig. 3 shows that when the cube is viewed in the three dimensions the CO(6–5) and CO(1–0) have complex morphologies. Hence, to examine the structures in the gas distribution and so examine how these might relate to the rest-frame 260m continuum morphology, we extract position-velocity plots and the one-dimensional intensity profiles of the CO(6–5) and CO(1–0) emission from these PV diagrams and also show these in Fig. 3. These show that the gas morphology is indeed structured, apparently comprising (at least) five clumps across the 5 kpc disk.
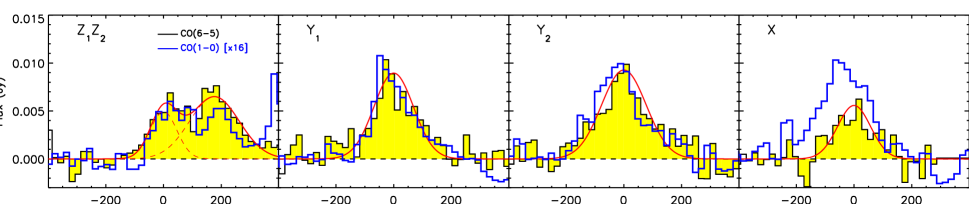
Danielson et al. (2011) demonstrated that to model the integrated multi-transition CO kinematics of SMM J2135 required multiple velocity components which they denoted X, Y, Z1 and Z2. Our high-resolution CO dynamics now allow us to spatially locate these structures and link them to the star-forming regions seen in the rest-frame 260-m emission. Fig. 2& 3 show that the lowest velocity material in Danielson et al. (2011),“Z1” and “Z2” (at =289 and -1679 km s-1 with respect to the systemic respectively) appear to relate to two clumps separated by 0.2′′ in projection on the sky, are associated with the rest-frame 260-m emission closest to the critical curve. Kinematic component “Y” in Danielson et al. (2011) (=16513 km s-1) appears to comprise two or three gas rich clumps between –280 km s-1. This gas-rich component is centered within of the brightest emission at rest-frame 260 m. Finally, the highest velocity material,“X” in Danielson et al. (2011) (=3969 km s-1) corresponds to the highest velocity, faintest emission in the rest-frame 260-m and CO(1–0) and CO(6–5) maps.
Given the correspondence between peaks in the molecular gas and the rest-frame 260-m emission, we will use the rest-frame 260-m map as a guide to isolate the star-forming regions, extracting the properties of the molecular gas at these locations. Clearly this biases our results towards the properties of the brightest star-forming regions, potentially missing some of the gas emission lies outside these actively star-forming regions, however, it has the advantage that we do not need to identify peaks directly from the CO emission – which itself is difficult to accomplish, without introducing biases due to surface brightness effects and signal-to-noise. We therefore restrict the following analysis to the locations of the brightest regions in the rest-frame 260-m emission.
Before extracting the size, luminosity and velocity dispersion of the molecular gas we must first remove the large-scale velocity structure of the galaxy (and hence any rotational contribution to the line widths of the clumps), as well as estimating the contribution of the velocity gradient within the beam. We therefore subtract the best-fit kinematic model for the galaxy velocity field from the cubes and then extract CO(6–5) and CO(1–0) spectra and measure the line luminosity, velocity dispersion and central velocity (Fig. 5). As in § 3.2 we use the model velocity field to estimate the local velocity gradient () within the beam and remove this in quadrature from the velocity dispersion. The largest corrections are in the central regions of the galaxy where the local velocity gradient is large (25 km s-1 over 200 pc). We note that in all four regions from where we extract spectra, the CO has intrinsic velocity dispersions of 45–82 km s-1 from CO(6–5), and that the CO(1–0) line widths are a factor 1.2 0.1 times higher (even after beam-matching the cubes). However, this is as expected if the CO(6–5) traces denser gas regions, more deeply embedded inside molecular clouds, and thus subjected to higher average pressures. To estimate the approximate sizes for the molecular gas associated with the star-forming regions, we collapse the CO(6–5) source-plane datacube over the 2FWHM of the CO line at its systemic velocity and fit an elliptical Gaussian profile to the resulting image – we use the CO(6–5) here since the resolution is slightly higher than the CO(1–0). The resulting sizes in the source plane are rCO=110–300 pc, comparable to the Jeans length computed in §3.3 for the gaseous ISM in this system, which would be the expected from the initial fragmentation scale of a gravitationally-unstable gaseous disk. Since the source-plane reconstruction is sensitive to the lensing model, we also reconstruct and measure the sizes of each of the star-forming regions from the family of lens models which adequately reproduce the lensing configuration, which, on average introduces a 50% error on this size measurement. Since measuring the sizes for gas emission is difficult at these surface brightness levels, for all size measurements, we conservatively allow a factor 2 error, and report these in Table 2. Finally, we estimate the molecular gas mass in the vicinity of the star-forming regions using the CO(1–0) line luminosity, obtaining –108 M⊙ for =2. Together, the gas in the vicinity of the brightest star-forming regions therefore comprises approximately 10–20% of the total gas in the system.
Finally, before investigating the properties of the star-forming regions in detail, it is useful to compare their characteristics with those in comparably luminous galaxies where comparable resolution observations have been made. In particular, Downes & Solomon (1998) (see also Sakamoto et al., 2008) show that the molecular gas within the central regions of local ULIRGs are characterised by , typically with two to three compact, dense regions with radii of –100 pc and masses M⊙ (and hence densities, cm-3) and typical infrared luminosities of – L⊙. These properties are similar to those for the clumps in SMM J2135. However, the key difference is that the bright star-forming regions in local ULIRGs tend to be located within the central 50–200-pc radius of the disk, whereas the star-forming regions within SMM J2135 are distributed across kpc. This shows that while the star formation is occuring in similarly compact clumps, these clumps are more widely distributed across a much larger gas disk in this high-redshift galaxy.
3.5. Cloud scaling relations in a high-pressure environment
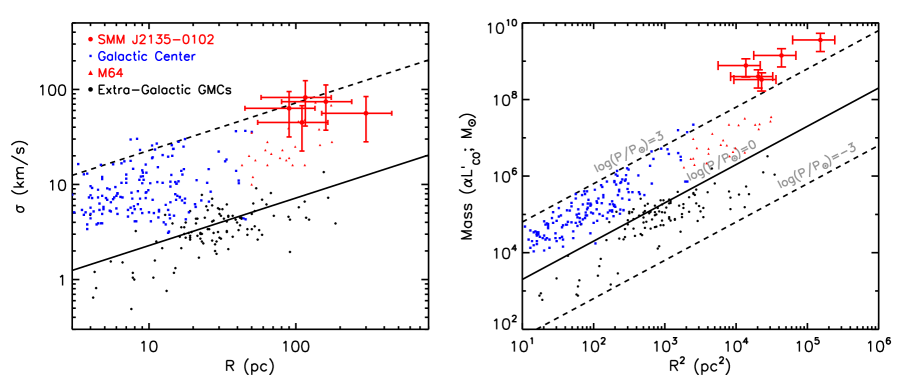
Next, we compare the size, luminosity and velocity dispersion of the star-forming regions to local GMCs and starburst complexes. For the line luminosities and velocity dispersions, we use the average from the CO(1–0) and CO(6–5) measurements, but ensure that the errors include the range of solutions from each of the two transitions separately. In Fig. 6 we compare the size and velocity dispersion of the molecular gas associated with the star-forming regions. This figure shows that the star-forming regions do not lie on the local relation for GMCs in quiescent environments (Bolatto et al., 2008), but are instead systematically offset such that at a fixed size, the velocity dispersion is higher than typical GMCs. Moreover, the offsets of the clumps seen in Fig. 6 from local scaling relations is comparable to that found for GMCs in the Galactic Center and other gas-rich environments. These offsets have been interpreted as a consequence of the high external ISM pressure on the cloud surfaces (Keto et al., 2005; Blitz & Rosolowsky, 2004, 2006).
Table 2: CO properties of the clumps
| Z1 | Z2 | Y1 | Y2 | X | Galaxy Integrated | |
|---|---|---|---|---|---|---|
| (mJy) | 8.22.1 | 8.22.1 | 6.42.1 | 19.12.1 | 7.52.1 | 106.03.5 |
| Amplification () | 6314 | 6314 | 535 | 404 | 202 | 37.54.5 |
| SFR (M⊙ yr-1) | 3110 | 3110 | 3010 | 9714 | 7014 | 400 |
| Vel (km s-1) () | 18519 | 639 | 11612 | 28020 | 38020 | … |
| (Jy km s-1) | 0.060.01 | 0.050.01 | 0.080.01 | 0.110.01 | 0.140.01 | 2.120.02 |
| (108K km s-1 pc2) | 2.00.6 | 1.70.6 | 3.90.4 | 7.10.8 | 1.80.2 | 1739 |
| (Jy km s-1) | 0.570.05 | 1.400.05 | 1.530.05 | 1.800.05 | 1.020.05 | 21.51.1 |
| (108K km s-1 pc2) | 0.540.05 | 1.300.06 | 1.940.07 | 3.10.09 | 3.410.17 | 482 |
| (km s-1) | 4515 | 827 | 6312 | 7412 | 5615 | 21030 |
| (km s-1) | 4720 | 11020 | 5714 | 7915 | 7815 | 21030 |
| (pc)∗ | 110 | 116 | 105 | 160 | 300 | … |
| (pc) | 9020 | 9020 | 9830 | 180230 | [352,452]50 | … |
| MgasCO(1-0) (108 M⊙) | 4.01.5 | 3.31.5 | 7.80.8 | 14.21.6 | 3.60.4 | … |
| MgasCO(6-5) (108 M⊙) | 3.80.4 | 9.20.8 | 13.81.0 | 22.81.0 | 24.31.6 | … |
We can compare the offsets in the size–velocity relation with theoretical expectations for the line width–size relation for GMCs in high-pressure ISM environments. Two important scaling relations deduced for molecular clouds in the Galaxy are the so-called Larson’s scaling laws (Larson, 1981), namely: a) the CO velocity line-width–size relation , and b) the average gas density–size relation . The first is the most robust of the two, and has been found to be remarkably constant in the Galaxy, both in terms of its normalisation and power-law index (Heyer & Brunt, 2004). This reflects the near-universality of turbulence in molecular clouds, while suggesting that the energy injection necessary to drive the turbulence occurs mostly at low spatial frequencies (i.e. large scales). The turbulent molecular clouds found to obey the Larson relations are almost always near-virialised (Larson, 1981); in such a case, the density–size power law can be readily derived from the line-width–size relation and the virial theorem. Indeed following Elmegreen (1989b) (see also Chieze, 1987), application of the virial theorem on molecular gas regions of radius, , and boundary pressure, yields
| (4) |
and
| (5) |
where km s-1 and cm-3, as obtained from studies of molecular clouds in the Galaxy (Larson, 1981; Wolfire et al., 2003; Heyer & Brunt, 2004). Theoretical studies predict similar values to within a factor of two (Chieze, 1987; Elmegreen, 1989b). Equation 5 can be recast as a mass–radius relation (Elmegreen, 1989b) and derived from the velocity–line width relation and the virial theorem applied for gaseous regions with boundary pressure. For the chosen normalisation value of the former, , this yields:
| (6) |
The large mid-plane hydrostatic pressure, K cm-3 in SMM J2135 will correspond to an external cloud boundary pressure cm-3 K for relative cosmic ray and magnetic pressure contributions of and (Elmegreen, 1989b, and references therein). From equations 4 & 5 we then expect and . The former is in very good agreement with the offset for the star-forming regions (a factor 7–10 offset in at a fixed size), whilst the latter implies that the molecular gas is expected to be denser on all scales when compared to the gaseous ISM in the Milky Way. Thus for a typical GMC size of pc in SMM J2135, the average densities would be cm-3 rather than cm-3 as in the Milky Way.
In Fig. 6 we also plot the mass–radius relation for a range of turbulent ISM pressures and overlay observed values of and from Galactic GMCs, ranging from those in the disk to those in the high-pressure environment of the Galactic Center. The star-forming molecular gas regions of SMM J2135 are offset by two orders of magnitude with respect to quiescent GMCs, as expected from Equation 6, and the turbulent pressures deduced for its gaseous ISM.
Whilst our analysis could readily attribute the offsets of the line width–size relation to the independently-derived large ISM pressures, we caution that we may still be probing scales at or just beyond where this relation is valid. Indeed this scaling law is expected to have a cut-off at the scales corresponding to the largest possible virialised molecular cloud structures, or simply to the lowest spatial frequency of turbulent driving (the disk scale-height being an obvious choice). The original study by Larson (1981) extends up to a cloud size of 100 pc, while the most recent and systematic study by Heyer & Brunt (2004) only goes up to 50 pc (a typical GMC size). On larger scales, systematic (streaming) motions between otherwise virialised gas structures could broaden the apparent “cloud” line widths, our removal of regular disk-like motions notwithstanding. Such systematically-broadened line widths could then create apparent offsets from the local scaling relations, similar to those seen in Fig. 6, that are unrelated to increased ISM pressures. Only ALMA will be capable of verifying the true pressure-induced offsets in distant star-forming galaxies, by probing scales 100 pc with sufficient sensitivity and spatial resolution to establish both the slope and the normalisation of the ISM scaling laws at high redshifts. This will be possible for strongly-lensed starburst systems such SMM J2135, allowing an unprecedented insight into key quantities characterising the turbulent molecular gas in star-forming systems at high redshifts.
3.6. Star-formation efficiencies at high ISM pressures
High average volume densities for molecular gas have been revealed by HCN, CS and HCO+ observations of local ULIRGs and interpreted as being responsible for the very high star-formation efficiencies observed for their global molecular gas reservoirs (Greve et al., 2009). The high luminosities of the star-forming regions in SMM J2135 per gas mass suggest high efficiencies, with – L⊙/M⊙, near the radiation-pressure limit recently advocated for extreme starbursts (Andrews & Thompson 2011; see also Scoville 2004 for a first derivation).
However, with estimates for the size, velocity dispersion, mass and star-formation rates of the clumps in SMM J2135, we can estimate the star-formation efficiencies per dynamical time directly. Using the radii of – pc (as measured from the CO(6–5) line emission and the rest-frame 260-m emission), for velocity dispersions of 40–60 km s-1, the crossing time of the clump region is –5 Myr. The inferred star-formation rates of each region is –90 M⊙ yr-1, thus in one dynamical time, 1–5108M⊙ of gas will be converted into stars. Assuming that all of the molecular gas in a GMC is converted into stars (i.e. no gas loss), it takes 2–10 dynamical times to convert 109M⊙ into stars. Conversely, the star-formation efficiency per dynamical time must be –50 per cent, i.e. approaching the star-formation efficiency of dense HCN-bright cores in the Milky Way. This is indeed a natural outcome of the much higher densities expected at every spatial scale in the high-pressure ISM within SMM J2135 (as discussed in §3.5). Clearly these calculations are simplistic since they assume that there is no gas loss and that the star-formation rate remains constant over the gas depletion lifetime. Nevertheless, they demonstrate that the star-formation efficiency in the clumps can be much higher than those in molecular clouds in quiescent GMCs. It is worth noting that the galaxy-averaged star-formation efficiency is much lower, –10% (i.e. closer to the average value seen in the Schmidt-Kennicutt relation; Kennicutt 1998).
We can compare these values to a theoretically-derived maximum efficiency expected for high-pressure molecular gas in star-forming regions. Elmegreen & Efremov (1997) suggest that if both the gas density and the rate of star formation is high enough, most of the gas in a cloud may be consumed before the molecular cloud is dispersed. Elmegreen & Efremov (1997) also show that high-pressure environments result in a lower dispersal rate, which improves the efficiency (resulting from the higher physical density and gravitational binding energy). In this model, the star-formation efficiency depends on the relative rate of star formation (which is proportional to some power of the gas density, ; Kennicutt 1998) and the rate of dispersal (which is proportional to the stellar luminosity and inversely proportional to the gravitational binding energy). By scaling the relative rates of star formation and efficiency from those in the Milky Way, Elmegreen & Efremov (1997) estimate the star-formation efficiency as a function of pressure and cloud mass, and in Fig. 7 we show how the star-formation efficiency scales with ISM pressure and mass. For typical GMC mass scales of M⊙ and external ISM pressures of that of the Milky Way, the star-formation efficiency can be as high as per cent.
4. Implications for star-formation in highly turbulent gas disks
The large line width observed for the high-pressure molecular gas of extreme starbursts like SMM J2135 will alter the so-called sonic or turbulent pressure length . This marks the scale at which supersonic turbulence becomes subsonic and near-thermal, and below which micro-turbulent velocity fields dominate the gas motion (Wolfire et al., 2003; Krumholz & McKee, 2005). In other words marks the smallest scale where the line width–size relation can hold in molecular clouds, below which there are near-constant velocity dispersions that no longer correlate with sizes (Plume et al., 1997). Using a line width–size relation re-cast in terms of the isothermal sound speed , namely , it is clear that a higher normalisation factor implies a difference in between SMM J2135 and the Milky Way of (assuming the same sound speed). This means that in systems such as SMM J2135, much smaller gaseous structures can remain supported against gravitationally-induced fragmentation/collapse by strong turbulence is dominant on smaller scales than in the kinematically quiescent ISM of the Galaxy.
In the context of turbulence-regulated star formation, only regions with overdensities can “escape” the grip of supersonic turbulence and irreversibly proceed towards gravitational collapse (Krumholz & McKee, 2005). For the Milky Way, the critical value is M2 (where is the one-dimensional Mach number). For SMM J2135, our results suggest, (SMM J2135)100(Galaxy). In absolute densities, for (SMM J2135)104.1 cm-3 (Danielson et al., 2011), the critical density will be cm-3. This is an exceptionaly high density, and for perspective the corresponding critical density in the Milky Way is 104–105 cm-3. As such, the normalized star-formation-rate (SFR) per free fall time will be increased substantially (Padoan & Nordlund, 2011). Far from being the exception, star formation in such highly turbulent ISM will not be atypical in the distant Universe where starbursts, such as SMM J2135, represent an important star-forming population. Indeed, half of the stars seen today may have formed in such environments (Blain et al., 1999).
4.1. The thermal state for dense highly turbulent gas
The higher normalization of the linewidth-size relation in the ISM of SMM J2135 translates to a much smaller sonic length controling the onset of near-thermal motions and eventual gravitational collapse. However this assumes isothermal gas, and thus an invariant sound speed . While this has been widely used in numerical simulations (e.g. Padoan & Nordlund, 2002), and analytical models of turbulence-regulated star-formation in individual molecular clouds and gaseous galactic disks (e.g. Krumholz & McKee, 2005), it does not represent a realistic ISM. Indeed, non-isothermal gas may play a crucial role in defining the thermodynamic state of the dense gas and hence on the stellar IMF and its mass scale (i.e. the IMF “knee”; Li et al. 2003; Jappsen et al. 2005; Bonnell et al. 2006)111The polytropic Effective Equation of State is a simple way to incorporate the complexities of strongly evolving gas heating and cooling processes in such numerical simulations and the values of its polytropic index determine the degree of gas fragmentation and the resulting dense gas core mass spectrum (e.g. Li et al., 2003; Jappsen et al., 2005). The dependence of on the properties of the ambient ISM (e.g. metallicity, velocity field, background radiation) have been explored in some detail (Spaans & Silk, 2000).
The very strong turbulence present in the ISM of galaxies such as SMM J2135 (as well as local ULIRGs) will influence the thermodynamic state of their UV-shielded dense gas phase (where the initial conditions for star formation are set) in two important, yet opposing ways. First, it will volumetrically heat this gas phase (i.e. unlike the surface-like heating of far-UV, optical or infrared photons), and second it will enhance molecular line cooling in much deeper and denser regions of the ISM. The latter occurs simply because highly supersonic line widths can now be maintained in much smaller, and thus denser gas regions (cf. Eq. 5). This will reduce the radiative trapping of cooling molecular line photons from such regions deep inside molecular clouds, as molecular line optical depths, , can now remain low at much higher densities because of the much larger velocity gradients, . These two effects can significantly alter the initial conditions for star formation in the highly turbulent ISM by changing the dense core mass spectrum, and/or the density, setting the equation of state inflection point (the latter is the density where the polytropic index flips from 1 (for ) to (for ), its value may determine the IMF mass scale (Larson, 2005)).

The effects of large velocity gradients on the degree of gas fragmentation and the resulting mass function of dense cores have been explored, but only up to the rather low value of km s-1 pc-1 (Spaans & Silk, 2000). In the case of SMM J2135, where strong turbulence can be maintained at cm-3, the average velocity gradient expected from self-gravity-induced gas motions alone will be:
| (7) |
and may approach km s-1 pc-1 (see also Greve et al. 2009). To date, such strongly turbulent media have not been simulated, even for a purportedly starburst-like ISM (e.g. Klessen et al., 2007). The discovery of the extreme kinematic properties of the ISM in SMM J2315 makes such simulations necessary, with preliminary results indicating significant implications for the resulting dense gas fragmentation and its star-formation efficiencies (Hocuk & Spaan, in prep).
5. Conclusions
We have mapped the distribution of molecular gas in the lensed, star-forming galaxy, SMM J2135, through the CO(6–5) and CO(1–0) emission lines, using the PdBI and EVLA respectively. After correcting for lensing, our high-resolution data provide a physical resolution of –200 pc. The dynamics of both the CO(1–0) and CO(6–5) line-emitting material convincingly demonstrate for the first time in a galaxy at , that the molecular gas is located in a large rotating disk, which suggests such structures may be ubiquitous in high-redshift galaxies. From the kinematics we derive an inclination-corrected rotation speed for the disk of km s-1, and a dynamical mass of M⊙ within a radius of 2.5 kpc (the spatial extent of the detected emission in CO(1–0)). The disk is massively unstable, with a toomre parameter, , which is lower than the compact, gas-rich disks residing in local ULIRGs where is closer to unity (Downes & Solomon, 1998). We also find the CO(1–0) emission is slightly more spatially extended than than the higher- CO lines, as has been seen for other high-redshift SMGs and ULIRGs (Ivison et al., 2011; Riechers et al., 2011a, b). Combining with measurements of the stellar mass within this system, we find that the dynamics of the disk are baryon dominated, (Mgas+M∗)/Mdyn=1.10.2, with a molecular gas fraction of , which is comparable to that found in other starburst galaxies at these epochs (Tacconi et al., 2008, 2010; Engel et al., 2010).
We use the gas dynamics and surface mass density to explore the ISM properties, deriving a mid-plane hydrostatic pressure of K cm-3, which corresponds to an external boundary pressure on the GMCs of – cm-3 K, a factor 1000 times higher than the Milky Way. Using established expressions of the (linewidth)-scale and (average density)-scale scaling relations known in the local ISM we deduce that at these high pressures the expected velocity dispersions and densities of molecular gas regions should be and the Galactic values respectively at all scales where supersonic turbulence remains important. We use our high-resolution CO cubes to demonstrate that this is indeed the case for the star-forming regions in SMM J2135, which are similar to the high-pressure ISM environments found in the Galactic Center.
The systematically higher gas densities expected from the higher normalization of the (average density)-(scale) relation (or its equivalent (cloud mass)-(radius) relation) are expected to dramatically elevate the star-formation efficiencies in this system, providing a natural explanation for the high star-formation-rate densities within the compact regions seen in the high resolution rest-frame 260m continuum imaging of this galaxy. We isolate these star-forming regions using their rest-frame 260-m continuum emission and extract the gas velocity dispersions and luminosities in the corresponding regions of the disk. The molecular mass in the vicinity of each of the star-forming regions is – M⊙. Thus, the brightest star-forming regions in the galaxy make up approximately per cent of the total baryonic mass in the disk (see also Genzel et al. 2010; Elmegreen et al. 2009). In all four regions, the velocity dispersions of the molecular gas are 40–85 km s-1.
We then compare the measured star-formation efficiencies of the clumps with those from theoretical expectations of high pressure ISM. Given their sizes and velocity dispersions, the crossing time of each of the star-forming regions is –5 Myr. For star-formation rates of –90 M⊙ yr-1, each star-forming region will convert the M⊙ of molecular gas in their vicinity into stars in just 2–10 dynamical times. Conversely the star-formation efficiency per dynamical time must be –50 per cent, a factor higher than in the GMCs in the Milky Way. Nevertheless, this is compatible with the theoretical expectation for the star-formation efficiency at high-pressure and cloud mass (Elmegreen & Efremov, 1997).
Finally, recasting the linewidth–scale relation in terms of the sound speed in an isothermal medium, as well as in the context of turbulence-regulated star formation, we show that for the highly turbulent ISM of SMM J2135 the turbulence will remain dominant, preventing gravitational collapse for structures that are up to 100 times smaller (and denser) than the corresponding structures in the Milky Way, resulting in a high critical density of 108 cm-3 for the onset of star formation. In the context of a more realistic non-isothermal ISM, we argue that the highly supersonic gas motions maintained at much higher gas densities in the turbulent ISM may alter the thermal state and the effective equation of state of the gas phase from which stars form. Detailed numerical simulations of such highly turbulent ISM are thus urgently needed to explore its mass fragmentation spectrum, the star-formation efficiencies, and the possible impact on the emergent stellar IMF.
Overall, our observations have resolved the molecular gas emission in a high-redshift star-forming galaxy at on 100-200 pc scales. The gas is located in a rotating disk which is highly unstable (Q=0.500.15), and the gas density suggests the ISM should be under a mid-plane hydrostatic 10 that of the Milky Way. We show that the gas in the vicinity of the star-forming regions is 10 denser than that of typical GMCs in the Milky Way, and causes them to be significantly offset from scaling relations which govern the structure of local GMCs. These offsets imply that supersonic turbulence will remain dominant on scales 100 smaller than in the kinematically quiescent ISM of the Milky Way, while the molecular gas will be 50 denser on all scales. Thus, the high star-formation densities seen in SMM J2135 are a consequence of the high gas surface densities and pressures, which result in a low dispersal rate for the clouds and star-formation efficiencies greater than those in quiescent environments. In the era of ALMA under full science operations, such observations should become common place, verifying the effects of pressure-induced offsets from local GMC scaling relations in distant star-forming galaxies.
acknowledgments
We would like to thank the referee for a constructive report which significantly improved the content and clarity of this work. AMS, IRS, RJI and APT gratefully acknowledges support from STFC. We thank Richard Bower, Bruce Elmegreen, Natascha Forster-Schreiber, Reinhard Genzel, Phil Hopkins, Mark Krunholz, Norman Murray, and Linda Tacconi for advice and conversations, and Jim Geach for volume rendering the cube and making the PdBI movie. The observations in this paper were carried out with the IRAM Plateau de Bure Interferometer and the Expanded Very Large Array. PdBI is supported by INSU/CNRS (France), MPG (Germany) and IGN (Spain). The EVLA is a facility of NRAO, operated by AUI, under a cooperative agreement with the NSF.
References
- Andrews & Thompson (2011) Andrews, B. H. & Thompson, T. A. 2011, ApJ, 727, 97
- Blain et al. (1999) Blain, A. W., Smail, I., Ivison, R. J., & Kneib, J.-P. 1999, MNRAS, 302, 632
- Blitz & Rosolowsky (2004) Blitz, L. & Rosolowsky, E. 2004, ApJL, 612, L29
- Blitz & Rosolowsky (2006) —. 2006, ApJ, 650, 933
- Bolatto et al. (2008) Bolatto, A. D., Leroy, A. K., Rosolowsky, E., Walter, F., & Blitz, L. 2008, ApJ, 686, 948
- Bonnell et al. (2006) Bonnell, I. A., Clarke, C. J., & Bate, M. R. 2006, MNRAS, 368, 1296
- Bournaud & Elmegreen (2009) Bournaud, F. & Elmegreen, B. G. 2009, ApJL, 694, L158
- Bryant & Scoville (1996) Bryant, P. M. & Scoville, N. Z. 1996, ApJ, 457, 678
- Chieze & Pineau Des Forets (1987) Chieze, J. & Pineau Des Forets, G. 1987, A&A, 183, 98
- Chieze (1987) Chieze, J. P. 1987, A&A, 171, 225
- Courteau (1997) Courteau, S. 1997, AJ, 114, 2402
- Daddi et al. (2010) Daddi, E., Bournaud, F., Walter, F., Dannerbauer, H., Carilli, C. L., Dickinson, M., Elbaz, D., & Morrison G. et al. 2010, ApJ, 713, 686
- Danielson et al. (2011) Danielson, A. L. R., Swinbank, A. M., Smail, I., Cox, P., Edge, A. C., Weiss, A., Harris, A. I., & Baker, , A. J. et al. 2011, MNRAS, 410, 1687
- Downes & Solomon (1998) Downes, D. & Solomon, P. M. 1998, ApJ, 507, 615
- Ebeling et al. (2001) Ebeling, H., Edge, A. C., & Henry, J. P. 2001, ApJ, 553, 668
- Elmegreen (1989a) Elmegreen, B. G. 1989a, ApJ, 338, 178
- Elmegreen (1989b) —. 1989b, ApJ, 344, 306
- Elmegreen (1993) —. 1993, ApJ, 411, 170
- Elmegreen & Efremov (1997) Elmegreen, B. G. & Efremov, Y. N. 1997, ApJ, 480, 235
- Elmegreen et al. (2009) Elmegreen, B. G., Elmegreen, D. M., Fernandez, M. X., & Lemonias, J. J. 2009, ApJ, 692, 12
- Engel et al. (2010) Engel, H., Tacconi, L. J., Davies, R. I., Neri, R., Smail, I., Chapman, S. C., Genzel, R., & Cox, P. et al. 2010, ApJ, 724, 233
- Förster Schreiber et al. (2009) Förster Schreiber, N. M., Genzel, R., Bouché, N., Cresci, G., Davies, R., Buschkamp, P., Shapiro, K., & Tacconi, L. J.. et al. 2009, ApJ, 706, 1364
- Gao & Solomon (2004) Gao, Y. & Solomon, P. M. 2004, ApJS, 152, 63
- Genzel et al. (2008) Genzel, R., Burkert, A., Bouché, N., Cresci, G., Förster Schreiber, N. M., Shapley, A., Shapiro, K., & Tacconi, L. J., et al. 2008, ApJ, 687, 59
- Genzel et al. (2011) Genzel, R., Newman, S., Jones, T., Förster Schreiber, N. M., Shapiro, K., Genel, S., Lilly, S. J., & Renzini, A. et al. 2011, ApJ, 733, 101
- Genzel et al. (2010) Genzel, R., Tacconi, L. J., Gracia-Carpio, J., Sternberg, A., Cooper, M. C., Shapiro, K., Bolatto, A., & Bouche, N. et al.,. 2010, MNRAS, 407, 2091
- Greve et al. (2009) Greve, T. R., Papadopoulos, P. P., Gao, Y., & Radford, S. J. E. 2009, ApJ, 692, 1432
- Harris & Pudritz (1994) Harris, W. E. & Pudritz, R. E. 1994, ApJ, 429, 177
- Heyer & Brunt (2004) Heyer, M. H. & Brunt, C. M. 2004, ApJL, 615, L45
- Honma et al. (1995) Honma, M., Sofue, Y., & Arimoto, N. 1995, A&A, 304, 1
- Ivison et al. (2011) Ivison, R. J., Papadopoulos, P. P., Smail, I., Greve, T. R., Thomson, A. P., Xilouris, E. M., & Chapman, S. C. 2011, MNRAS, 412, 1913
- Ivison et al. (2010) Ivison, R. J., Swinbank, A. M., Swinyard, B., Smail, I., Pearson, C. P., Rigopoulou, D., Polehampton, E., & Baluteau, J.-P.. et al. 2010, A&A, 518, L35
- Jappsen et al. (2005) Jappsen, A., Klessen, R. S., Larson, R. B., Li, Y., & Mac Low, M. 2005, A&A, 435, 611
- Jones et al. (2010) Jones, T. A., Swinbank, A. M., Ellis, R. S., Richard, J., & Stark, D. P. 2010, MNRAS, 404, 1247
- Jullo et al. (2007) Jullo, E., Kneib, J.-P., Limousin, M., Elíasdóttir, Á., Marshall, P. J., & Verdugo, T. 2007, New Journal of Physics, 9, 447
- Kassiola & Kovner (1993) Kassiola, A. & Kovner, I. 1993, ApJ, 417, 450
- Kennicutt (1998) Kennicutt, Jr., R. C. 1998, ApJ, 498, 541
- Keto et al. (2005) Keto, E., Ho, L. C., & Lo, K. 2005, ApJ, 635, 1062
- Keto & Myers (1986) Keto, E. R. & Myers, P. C. 1986, ApJ, 304, 466
- Klessen (2004) Klessen, R. S. 2004, ApSS, 292, 215
- Klessen et al. (2007) Klessen, R. S., Spaans, M., & Jappsen, A. 2007, MNRAS, 374, L29
- Kneib et al. (1996) Kneib, J.-P., Ellis, R. S., Smail, I., Couch, W. J., & Sharples, R. M. 1996, ApJ, 471, 643
- Kravtsov & Gnedin (2005) Kravtsov, A. V. & Gnedin, O. Y. 2005, ApJ, 623, 650
- Krumholz & McKee (2005) Krumholz, M. R. & McKee, C. F. 2005, ApJ, 630, 250
- Larson (1981) Larson, R. B. 1981, MNRAS, 194, 809
- Larson (2005) —. 2005, MNRAS, 359, 211
- Law et al. (2009) Law, D. R., Steidel, C. C., Erb, D. K., Larkin, J. E., Pettini, M., Shapley, A. E., & Wright, S. A. 2009, ApJ, 697, 2057
- Lehnert et al. (2009) Lehnert, M. D., Nesvadba, N. P. H., Tiran, L. L., Matteo, P. D., van Driel, W., Douglas, L. S., Chemin, L., & Bournaud, F. 2009, ApJ, 699, 1660
- Li et al. (2003) Li, Y., Klessen, R. S., & Mac Low, M. 2003, ApJ, 592, 975
- Mao et al. (2000) Mao, R. Q., Henkel, C., Schulz, A., Zielinsky, M., Mauersberger, R., Störzer, H., Wilson, T. L., & Gensheimer, P. 2000, A&A, 358, 433
- Padoan & Nordlund (2002) Padoan, P. & Nordlund, Å. 2002, ApJ, 576, 870
- Padoan & Nordlund (2011) —. 2011, ApJ, 730, 40
- Papadopoulos & Pelupessy (2010) Papadopoulos, P. P. & Pelupessy, F. I. 2010, ApJ, 717, 1037
- Papadopoulos & Seaquist (1998) Papadopoulos, P. P. & Seaquist, E. R. 1998, ApJ, 492, 521
- Papadopoulos et al. (2011) Papadopoulos, P. P., Thi, W.-F., Miniati, F., & Viti, S. 2011, MNRAS, 414, 1705
- Plume et al. (1997) Plume, R., Jaffe, D. T., Evans, II, N. J., Martin-Pintado, J., & Gomez-Gonzalez, J. 1997, ApJ, 476, 730
- Richard et al. (2009) Richard, J., Pei, L., Limousin, M., Jullo, E., & Kneib, J. P. 2009, A&A, 498, 37
- Richard et al. (2010) Richard, J., Smith, G. P., Kneib, J.-P., Ellis, R. S., Sanderson, A. J. R., Pei, L., Targett, T. A., & Sand, D. J. et al. 2010, MNRAS, 404, 325
- Riechers et al. (2011a) Riechers, D. A., Carilli, L. C., Walter, F., Weiss, A., Wagg, J., Bertoldi, F., Downes, D., & Henkel, C. et al. 2011a, ApJL, 733, L11
- Riechers et al. (2011b) Riechers, D. A., Hodge, J., Walter, F., Carilli, C. L., & Bertoldi, F. 2011b, arXiv/1105.4177
- Rosolowsky & Blitz (2005) Rosolowsky, E. & Blitz, L. 2005, ApJ, 623, 826
- Sakamoto et al. (2008) Sakamoto, K., Wang, J., Wiedner, M. C., Wang, Z., Peck, A. B., Zhang, Q., Petitpas, G. R., & Ho, L., et al. 2008, ApJ, 684, 957
- Schaye & Dalla Vecchia (2008) Schaye, J. & Dalla Vecchia, C. 2008, MNRAS, 383, 1210
- Schweizer et al. (1996) Schweizer, F., Miller, B. W., Whitmore, B. C., & Fall, S. M. 1996, AJ, 112, 1839
- Scoville (2004) Scoville, N. 2004, in Astronomical Society of the Pacific Conference Series, Vol. 320, The Neutral ISM in Starburst Galaxies, ed. S. Aalto, S. Huttemeister, & A. Pedlar, 253–+
- Shapiro et al. (2010) Shapiro, K. L., Genzel, R., & Förster Schreiber, N. M. 2010, MNRAS, 403, L36
- Smail et al. (2007) Smail, I., Swinbank, A. M., Richard, J., Ebeling, H., Kneib, J.-P., Edge, A. C., Stark, D., Ellis, R. S., Dye, S., Smith, G. P., & Mullis, C. 2007, ApJL, 654, L33
- Smith et al. (2009) Smith, G. P., Ebeling, H., Limousin, M., Kneib, J.-P., Swinbank, A. M., Ma, C.-J., Jauzac, M., & Richard, J., et al. 2009, ApJL, 707, L163
- Solomon et al. (1997) Solomon, P. M., Downes, D., Radford, S. J. E., & Barrett, J. W. 1997, ApJ, 478, 144
- Spaans & Silk (2000) Spaans, M. & Silk, J. 2000, ApJ, 538, 115
- Spergel et al. (2003) Spergel, D. N., Verde, L., Peiris, H. V., Komatsu, E., Nolta, M. R., Bennett, C. L., Halpern, M., & Hinshaw, G., et al. 2003, ApJS, 148, 175
- Swinbank et al. (2010) Swinbank, A. M., Smail, I., Longmore, S., Harris, A. I., Baker, A. J., De Breuck, C., Richard, J., & Edge, A. C. et al. 2010, Nature, 464, 733
- Tacconi et al. (2010) Tacconi, L. J., Genzel, R., Neri, R., Cox, P., Cooper, M. C., Shapiro, K., Bolatto, A., & Bournaud, F., et al. 2010, Nature, 463, 781
- Tacconi et al. (2008) Tacconi, L. J., Genzel, R., Smail, I., Neri, R., Chapman, S. C., Ivison, R. J., Blain, A., & Cox, P., et al. 2008, ApJ, 680, 246
- Toomre (1964) Toomre, A. 1964, ApJ, 139, 1217
- Walter et al. (2002) Walter, F., Weiss, A., & Scoville, N. 2002, ApJL, 580, L21
- Weiß et al. (2001) Weiß, A., Neininger, N., Hüttemeister, S., & Klein, U. 2001, A&A, 365, 571
- Weiß et al. (2005) Weiß, A., Walter, F., & Scoville, N. Z. 2005, A&A, 438, 533
- Wilson et al. (2003) Wilson, C. D., Scoville, N., Madden, S. C., & Charmandaris, V. 2003, ApJ, 599, 1049
- Wolfire et al. (2003) Wolfire, M. G., McKee, C. F., Hollenbach, D., & Tielens, A. G. G. M. 2003, ApJ, 587, 278