A High Resolution Study of the Hi–H2 Transition
across the Perseus Molecular Cloud
Abstract
To investigate the fundamental principles of H2 formation in a giant molecular cloud, we derive the Hi and H2 surface density ( and ) images of the Perseus molecular cloud on sub-pc scales (0.4 pc). We use the far-infrared data from the Improved Reprocessing of the IRAS Survey and the -band extinction image provided by the COMPLETE Survey to estimate the dust column density image of Perseus. In combination with the Hi data from the Galactic Arecibo L-band Feed Array Hi Survey and an estimate of the local dust-to-gas ratio, we then derive the distribution across Perseus. We find a relatively uniform 6–8 M⊙ pc-2 for both dark and star-forming regions, suggesting a minimum Hi surface density required to shield H2 against photodissociation. As a result, a remarkably tight and consistent relation is found between and . The transition between the Hi- and H2-dominated regions occurs at (8–14) 1020 cm-2. Our findings are consistent with predictions for H2 formation in equilibrium, suggesting that turbulence may not be of primary importance for H2 formation. However, the importance of warm neutral medium for H2 shielding, internal radiation field, and the timescale of H2 formation still remain as open questions. We also compare H2 and CO distributions and estimate the fraction of “CO-dark” gas, 0.3. While significant spatial variations of are found, we do not find a clear correlation with the mean -band extinction.
1 Introduction
Most of the dense molecular gas in galaxies is assembled into giant molecular clouds (GMCs) with masses from 104 M⊙ to 107 M⊙ and radii from 50 pc to a few hundred pc (e.g., Fukui & Kawamura 2010). As stars, the “atoms” of galaxies, are exclusively formed in these GMCs, physical processes that govern the conversion of Hi into H2 clearly play an important role in determining the properties of GMCs and consequently the initial conditions for star formation. Therefore, understanding the properties of the interstellar regions where gas transitions from Hi–H2-dominated (Hi–H2 transition hereafter) is an important step toward a complete theory of star formation.
From an observational point of view, the Hi–H2 transition has been investigated in the Galaxy mainly via ultraviolet (UV) absorption measurements toward background sources. For example, Savage et al. (1977) and Gillmon et al. (2006) measured H2 column densities, (H2), along the lines of sight to early-type stars and AGNs using the Copernicus and FUSE satellites and combined them with Hi column densities, (Hi), to estimate H2 fraction, = 2(H2)/((Hi(H2)). They found that sharply rises at (H) = (Hi(H2) (3–5) 1020 cm-2. Several far-infrared (FIR) studies of interstellar clouds have revealed the presence of H2 based on the comparison between dust and atomic gas contents (e.g., Reach et al. 1994; Meyerdierks & Heithausen 1996; Douglas & Taylor 2007). Reach et al. (1994) found a significant positive deviation from a linear relation between IR intensity at 100 m and (Hi) for cirrus clouds, indicating a substantial amount of H2. The threshold (Hi) at which (H2) implied by the FIR data becomes significant was found to be 4 1020 cm-2, consistent with the results from Savage et al. (1977) and Gillmon et al. (2006).
More recently, the Hi–H2 transition has been observationally inferred by an absence of high (Hi). For example, Barriault et al. (2010) observed two high Galactic latitude clouds in the OH and Hi transitions and found that (Hi) saturates at 5 1020 cm-2 for high values of (OH), suggesting that there is molecular gas not traced by Hi. Extragalactic studies have found this saturation as well. Wong & Blitz (2002), Blitz & Rosolowsky (2004, 2006), Bigiel et al. (2008), and Wong et al. (2009) observed nearby galaxies in the CO and Hi transitions and found that Hi surface density, , saturates at 10 M⊙ pc-2. Most extragalactic studies have a spatial resolution of 700 pc at best, where most GMCs are unresolved and several are likely to be blended along a line of sight. In addition, at this resolution it is impossible to compare H2 with the corresponding Hi associated with the cloud envelopes.
From a theoretical point of view, the Hi–H2 transition has been studied in the context of the structure of photodissociation regions (PDRs). As UV photons filling up the bulk of the interstellar medium (ISM) photodissociate H2, predominantly molecular gas is only found in the dense regions where high enough shielding is achieved by both dust grains and H2 self-shielding. These molecular regions are bounded by PDRs where the gas predominantly exists in the atomic phase (e.g., Hollenbach & Tielens 1997). The structure of PDRs has been mainly investigated for 1D geometries that include uni-directional or bi-directional beams of radiation propagating into semi-infinite slabs or purely radial radiation fields hitting the surfaces of spherical clouds (e.g., van Dishoeck & Black 1986; Draine & Bertoldi 1996; Browning et al. 2003). However, this 1D approximation is not appropriate for GMCs that are embedded in a radiation field produced by the combination of many single stars and star clusters. In addition, when GMCs are surrounded by large Hi envelopes, which have been frequently observed in the Galaxy (e.g., Wannier et al. 1983, 1991), the curvature of the PDRs and the finite size of the molecular regions are no longer negligible. A higher dimensional approach is required in this case, but as it requires a treatment of the angular dependence of the radiation field, all previous studies have been purely numerical (e.g., Spaans & Neufeld 1997; Liszt & Lucas 2000; Liszt 2002). These numerical studies do not provide a simple analytic estimate of the structure of PDRs that allows us to extrapolate the models over a wide range of ISM environments and to easily compare with observations.
Recently, Krumholz et al. (2008, 2009; KMT08 and KMT09 hereafter) performed analytic studies on a PDR in a spherical cloud that is bathed in a uniform and isotropic interstellar radiation field (ISRF). They investigated the steady-state equilibrium formation and photodissociation of H2 and approximated the Hi–H2 transition as being infinitely sharp. Their calculation of where exactly inside a molecular cloud this transition happens resulted in two important analytic predictions. First, they found that a certain amount of is required to provide enough shielding for H2 formation. For GMCs with solar metallicity, this is 10 M⊙ pc-2. Once the minimum is achieved to shield H2 against photodissociation, all excess Hi is converted into H2 and the H2 abundance increases. Second, they derived an analytic function for H2-to-Hi ratio, = /, and showed that depends on the total gas surface density and metallicity but is interestingly almost independent of the strength of the ISRF. This is a very powerful prediction, suggesting that for a given ISM environment, the total gas surface density determines the H2-to-Hi ratio. If confirmed by observations, this “easy” prescription of H2 formation will be invaluable for numerical simulations of galaxy formation and evolution. From a purely practical perspective, as the above predictions are functions of direct observables (total gas surface density and metallicity), they are much easier to test observationally. Most of the previous models of H2 formation (e.g., van Dishoeck & Black 1986; Draine & Bertoldi 1996; Browning et al. 2003) require the intensity of the UV radiation field and the number density of H nuclei as input parameters, which cannot be easily determined by observations.
KMT09’s predictions specifically focus on the properties of GMCs on galactic scales (kpc). Several recent studies investigated the Hi and H2 properties of nearby spiral and dwarf galaxies on kpc scales and found reasonable agreement with KMT09’s prediction of as a function of total gas surface density and metallicity (e.g., KMT09; Fumagalli et al. 2009, 2010). On the other hand, KMT09’s simplified treatment of the thermal and chemical processes in PDRs may be less suited for studies of individual PDRs. For example, KMT09’s model does not consider the temperature dependence of H2 formation rate coefficients, H2 dissociation by cosmic rays, or absorption of Lyman-Werner (LW) photons by molecules other than H2. Nevertheless, KMT09’s model provides strong physical insights into the fundamental principles of H2 formation.
In this paper, we test KMT09’s predictions on the Perseus molecular cloud (Perseus hereafter) on sub-pc scales (0.4 pc) for the first time in an attempt to understand the fundamental principles of H2 formation in GMCs. Perseus is a nearby molecular cloud located at a distance ranging from 200 pc to 350 pc (Herbig & Jones 1983; Černis 1990) and has roughly a projected angular size of 6∘ by 3∘ on the sky (based on CO emission111In this paper, all 12CO(1–0) data are quoted as CO.). We adopt the distance to Perseus of 300 pc throughout this paper. Perseus is part of the large Taurus–Auriga–Perseus molecular cloud complex and lies below the Galactic plane (), resulting in slightly less confused Hi spectra compared to other Galactic GMCs. With M⊙ (Sancisi et al. 1974; Ungerechts & Thaddeus 1987), this is a low mass cloud with an intermediate level of star formation (Bally et al. 2008). Figure 1 shows the -band extinction image of Perseus with CO contours to emphasize the locations of several prominent dark and star-forming regions. IC348 (age = 0.7–12 Myr; Herbig 1998) and NGC 1333 (age < 1 Myr; Lada et al. 1996) are active star-forming regions, while B5, B1E, B1, L1455, L1448, and L1451 are dark regions with low levels of star formation. A wealth of multi-wavelength observations exist for Perseus; we provide details in Section 2. One of the recent observational advances is the high resolution Hi data set of Perseus and its outskirts provided by the GALFA–Hi survey (Peek et al. 2011). This data set nicely matches the angular resolution of FIR images, 4′, allowing us to estimate across and around Perseus and to compare the results to KMT09’s predictions.
This paper is organized in the following way. We start with a description of the data sets used in this study (Section 2). We then describe details of our methodology to derive (Hi) and (H2) images (Sections 3 and 4). In Section 5, we examine the dust temperature image closely and discuss the implications for the strength of the radiation field across Perseus. In Section 6, we summarize KMT09’s model and predictions. In Section 7, we compare our and images with KMT09’s predictions. We then compare the derived H2 distribution with the existing CO observations and investigate the existence of the “CO-dark” H2 gas (Section 8). Finally, we discuss and summarize our conclusions (Sections 9 and 10).
2 Data
2.1 Hi
We use Hi data from the Galactic Arecibo L-band Feed Array Hi Survey (GALFA–Hi). GALFA–Hi uses ALFA, a seven-beam array of receivers mounted at the focal plane of the 305-m Arecibo telescope, to map Hi emission in the Galaxy. Each of seven dual polarization beams has an effective beamsize of 3.9′ 4.1′ and a gain of 8.5–11 Jy K-1 (Peek et al. 2011). The GALFA–Hi spectrometer, GALSPECT, has a velocity resolution of 0.184 km s-1 (872 Hz) and covers km s-1 < < km s-1 (7 MHz) in the Local Standard of Rest (LSR) frame222In this paper, all velocities are quoted in the LSR frame..
GALFA–Hi adopts two different scanning modes, the drift and basketweaving modes. In the drift mode, the telescope is fixed at azimuth of 0∘ or 180∘ and the sky is allowed to drift by. In the basketweaving mode, on the other hand, the telescope is fixed at the meridian and is driven up and down in zenith angle over the chosen declination (Dec) range. For each day of observations, the starting point of the telescope is shifted in right ascension (RA) by 12′ such that the entire proposed region is covered. ALFALFA (Giovanelli et al. 2005) and GALFACTS (Guram & Taylor 2009), two large area surveys with which GALFA–Hi commensally observes, use the drift and basketweaving mode, respectively.
GALFA–Hi combines Hi data from many individual projects, both in solo and commensal modes. Reduction of Hi data is performed with the GALFA–Hi Standard Reduction (GSR) pipeline. Full details of GSR are presented in Peek et al. (2011), but here we briefly describe its most important steps. First, Hi spectra are corrected for the intermediate frequency (IF) gain by dividing them by a reference spectrum. This reference spectrum is obtained via the least-squares frequency switching (LSFS) technique (Heiles 2005). The LSFS observation is performed at the beginning of each observing period and the obtained IF gain spectrum is used for the whole period’s data. Second, the Hi spectra are searched for baseline ripples produced by reflections in the signal chain, the primary reflector, and the Gregorian dome. This initial calibration is done by examining the Hi data in the Fourier space and removing the Fourier components that correspond to the reflection patterns. Third, the gain calibration is applied to the Hi spectra. The relative gains of each beam over each day of observations are determined by finding the points where beam tracks intersect and comparing the Hi spectra of each beam. This gain calibration is most effective for the scans obtained in the basketweaving mode, where a large number of intersection points are produced. Lastly, the fully calibrated Hi spectra are gridded onto the image plane in Cartesian coordinates. The gridded Hi data are then calibrated for the first sidelobe and the final brightness temperature scale. The lower angular resolution Hi data from the Leiden–Argentine–Bonn (LAB) Survey (Kalberla et al. 2005) are used for the final brightness temperature calibration.
The GALFA–Hi first data release (DR1) has been presented by Peek et al. (2011). The DR1 data cover 7520 deg2 of sky and have been produced using 3046 hours of data obtained from 12 individual projects. RMS noise in a 1 km s-1 channel ranges from 140 mK to 60 mK, with a median of 80 mK. The DR1 data can be downloaded at https://purcell.ssl.berkeley.edu/. The Hi data used in this paper are part of DR1 and have been obtained from TOGS2 (Turn-On GALFA Spectrometer2; PI: C. Heiles & S. Stanimirović), a2004 (Hi Survey of the Taurus Molecular Cloud; PI: P. Goldsmith), and a2174 (Hi Survey of the Perseus Molecular Cloud; PI: L. Knee). We combined the scans from these three projects and produced an Hi cube centered at (RA,Dec) = (03h29m52s,30∘34′1′′) in J2000333In this paper, all coordinates are quoted in J2000. with a size of 14.8∘ 9∘.
2.2 Infrared
We use 60 m and 100 m images from the Improved Reprocessing of the IRAS Survey (IRIS) (Miville-Deschnes & Lagache 2005). IRIS provides an improved zero point calibration and correction for the zodiacal light and striping in the images, as well as increased angular resolution compared to the original IRAS images. The angular resolution at 60 m and 100 m is 4′ and 4.3′, respectively, comparable to that of the GALFA–Hi data. The noise level in the IRIS images is approximately 0.07 MJy sr-1 and 0.48 MJy sr-1 at 60 m and 100 m, respectively.
2.3 CO
We use the CO integrated intensity image provided by Dame et al. (2001). Dame et al. (2001) combined CO surveys of the Galactic plane and local molecular clouds and produced a composite survey of the entire Galaxy at an angular resolution of 8.4′. The CO data were obtained by the 1.2-m telescope at the Harvard-Smithsonian Center for Astrophysics (CfA). The spectra were sampled with an angular spacing of 7.5′ and the final data cube has a uniform RMS noise of 0.25 K per a 0.65 km s-1 channel. To estimate CO integrated intensity, , Dame et al. (2001) integrated CO emission from km s-1 to km s-1. See Section 2 of Dame et al. (2001) for details of the observations and analysis.
While we use the CfA CO data for the most of our analysis, 13CO(1–0) data provided by the COMPLETE survey (Ridge et al. 2006a) are used in Section 7. As 13CO(1–0) is a better tracer of dense molecular gas than CO, we use the image with a size of 6.25 to set the boundaries of the dark and star-forming regions in Perseus. The 13CO(1–0) data were obtained by the 14-m Five College Radio Astronomy Observatory (FCRAO) telescope at an angular resolution of 44′′. To study Perseus, Ridge et al. (2006a) integrated 13CO(1–0) emission from km s-1 to km s-1 with a velocity resolution of 0.07 km s-1 and estimated an average RMS noise per channel of 0.17 K.
2.4
We use the image provided by the COMPLETE survey. This image was constructed from the Two Micron All Sky Survey (2MASS) Point Source Catalog using the NICER algorithm (Lombardi & Alves 2001) at an angular resolution of 5′. The NICER algorithm estimates reddening along a line of sight by comparing the observed colors of background stars to the intrinsic colors (measured in a nearby control field, where the extinction is negligible). Note that this method does not assume a grain-size distribution or dust emissivity and therefore provides the most reliable estimate of the total gas column density in a molecular cloud (e.g., Goodman et al. 2009; GPS09 hereafter). In this paper, however, we do not directly use the 2MASS image to derive the total gas column density because it only covers the central region of Perseus, while we are mainly interested in the cloud outskirts. Instead, we use the 2MASS image to calibrate our image derived from the IRIS data (see Section 4.4).
2.5 Treatment of Angular Resolution
In this paper, we combine the data sets described above in several ways. In each case, we first bring all input data sets to common angular resolution determined by the lowest angular resolution data set. This is done by performing convolution with an appropriate Gaussian kernel. For example, to determine the velocity range of Hi emission based on the correlation between (Hi) and the dust column density, we smooth the Hi data to the angular resolution of the 2MASS image, 5′ (Section 3.2). To derive (H2), the IRIS and Hi data are convolved with a Gaussian kernel to have an angular resolution of 4.3′. Consequently, our final , , and images have an angular resolution of 4.3′ (Sections 4.5 and 7).
3 Methodology: Steps in Deriving N(Hi)
3.1 General Properties of Hi Spectra
The main component of the Hi emission in Perseus is centered at = km s-1. Compared to the molecular gas traced by CO, the peak of the Hi emission is offset by 2–3 km s-1. As an example, we compare the Hi and CO spectra at the position of IC348 in Figure 2. There are (at least) two components in the Hi spectrum and the stronger one peaks at 5 km s-1. Interestingly, the location of the dip between the two Hi components corresponds to the CO peak at 8 km s-1. This dip is likely from Hi self-absorption (HISA) and indicates the presence of very cold neutral medium (spin temperature K; e.g., Gibson 2010). The correction for HISA requires a knowledge of the relative contributions from cold and warm gas to the Hi emission, which can be obtained via Hi absorption measurements. However, only two Hi absorption measurements exist for Perseus (e.g., Heiles & Troland 2003a). This is clearly too sparse to interpolate the relative contributions from cold and warm gas throughout the whole molecular cloud. Therefore, we do not apply the correction for HISA to (Hi) but we investigate the optical depth effect in Section 7.1.1 by applying the first order opacity correction.
3.2 Determining the Velocity Range
To determine the velocity range of Hi emission associated with Perseus, we investigate the correlation between (Hi) and the dust column density. The correlation between Hi emission and FIR emission has been well-established for high Galactic latitudes (e.g., Boulanger et al. 1996). We use the 2MASS image as a tracer of the dust column density and smooth the Hi data to the angular resolution of the 2MASS image. We fix the central velocity of Hi emission at 5 km s-1 based on Section 3.1 and integrate Hi emission using a velocity width increasing from 2 km s-1 to 80 km s-1 with 2 km s-1 intervals. For each derived (Hi) image, we calculate the correlation coefficient between (Hi) and 2MASS . Only data points with signal-to-noise ratio (SNR) in the 2MASS image are used for this calculation. Figure 3 shows the correlation coefficient as a function of . Although the correlation coefficient is never very high, there is a clear peak at km s-1. The lack of strong correlation between and (Hi) has been noticed before and is mostly ascribed to the presence of molecular gas (e.g., Reach et al. 1994; Dame et al. 2001; Leroy et al. 2009). We take the correlation coefficient of 0.15 (half of the maximum) as a threshold and use the corresponding of 20 km s-1 to derive (Hi) under the assumption of optically thin Hi gas444For optically thin Hi gas, (Hi) is calculated by (Hi) = 1.823 (cm-2), where is the brightness temperature.. The derived (Hi) ranges from 3.5 1020 cm-2 to 1.3 1021 cm-2, with a median of 7.9 1020 cm-2. We present the (Hi) image in Figure 4.
Sancisi et al. (1974) and Imara & Blitz (2011) estimated (Hi) for Perseus independently and their results are essentially consistent with ours. Sancisi et al. (1974) obtained Hi data for Perseus using the 25-m Dwingeloo telescope and estimated (Hi) by integrating Hi emission from km s-1 to km s-1. In addition, they attempted to subtract the foreground and background (Hi) by comparing the Hi emission in the direction of Perseus to the Hi emission measured in a nearby field spatially offset by a few degrees. They found an average (Hi) associated with Perseus 5 1020 cm-2. This is close to our median (Hi). On the other hand, Imara & Blitz (2011) used Hi data from the LAB survey and estimated (Hi) by integrating Hi emission from km s-1 to km s-1. To determine the velocity range for (Hi), they assumed that Hi spectra can be approximated with Gaussian functions and set to be equal to four times the standard deviation of the Gaussian component associated with Perseus. In summary, both Sancisi et al. (1974) and Imara & Blitz (2011) derived (Hi) under the assumption of optically thin Hi gas and their velocity ranges for (Hi) are consistent with ours.
4 Methodology: Steps in Deriving N(H2)
4.1 Removal of Point Sources from the IRIS Data
Before further processing, we remove point sources from the 60 m and 100 m images. We identify compact point sources from the IRAS Point Source Catalog that have MJy sr-1 and remove them by applying a circular mask with a radius equal to twice the angular resolution of the 100 m image. These masks are shown as blank pixels in Figures 6, 7, 10, and 14.
4.2 Exclusion of Possible Contaminations
As Perseus belongs to the Taurus–Auriga–Perseus molecular cloud complex and our data cover a large area on the sky (15), there is a concern of including molecular gas not associated with Perseus in our analysis. To investigate this, we plot and as a function of (Hi) in Figure 5. As /(Hi) and /(Hi) are approximations of dust-to-gas ratio (DGR), an overall linear relation, implying a single DGR, is a reasonable expectation for a single molecular cloud. Figure 5 shows that the data points are segregated into two possible distinct features at (Hi) 6 1020 cm-2. The majority of the data points shows a global linear relation between (Hi) and FIR emission. These data points are shown in gray and we assume that they mostly trace Perseus. However, the data points in black have a slightly different slope. We selected the black data points as having (Hi) < 6 1020 cm-2. In Figure 6, we show the spatial distribution of the black data points by overlaying them on the 100 m image. Clearly, they are all found at the southeast edge of the image in the direction of Taurus. Taurus is centered at (RA,Dec) = (04h30m,) and has = km s-1 (e.g., Narayanan et al. 2008). As a distinct molecular cloud, Taurus would have a different DGR. To avoid any possible contamination, we exclude (blank) the black data points from the IRIS images and further analysis.
In addition to the above consideration, the warm dust ring that stands out in the dust temperature image (see Section 4.3) is an additional source of contamination and we exclude it from further analysis.
4.3 and
For optically thin dust grains at an equilibrium temperature , the optical depth at 100 m, , is determined by:
| (1) |
where is the measured intensity at 100 m and is the intensity of a blackbody of temperature at 100 m. To estimate , we first estimate using the ratio . Under the assumption that the mass absorption coefficient, , has a wavelength dependence such as , can be estimated from:
| (2) |
where is the Planck constant and is the Boltzmann constant. The emissivity spectral index, , can vary between 1 (for amorphous carbon) and 2 (for metallic and crystalline dielectric material), depending on the grain composition and size. Throughout this paper, we adopt based on the discussions in Schnee et al. (2005; S05 hereafter). To estimate , we smooth the 60 m image to the angular resolution of the 100 m image.
may include a significant contribution from stochastically heated very small grains (VSGs) that must be accounted for. To do this, we adopt the method used by S05. First, we smooth the 60 m and 100 m images to the angular resolution of the map derived by Schlegel et al. (1998; SFD98 hereafter). SFD98 used the low resolution DIRBE 100 m and 240 m data to derive ; the contribution from VSGs is expected to be negligible at these wavelengths (e.g., Li & Draine 2001). Second, we calculate based on 100% of and a lesser percentage of , assuming . The fraction of is chosen to minimize the average difference between our and SFD98’s . We find that the best matching fraction is 22%, meaning that 78% of is due to VSGs. This result is consistent with S05, who found 26%, but lower than the prediction of interstellar dust model for the solar neighborhood (40%; Désert et al. 1990).
We present the image in Figure 7. Our image is generally consistent with the image derived by S05, but shows systematically slightly lower . The difference between our and S05’s , , has a median of K. This discrepancy likely arises from the fact that S05 adopted a -dependent formula for and used a different fitting algorithm. Their -dependent formula for considered the observed inverse relation between and and had two free parameters (see Equation 2 of S05). To simultaneously fit these two free parameters, S05 used the IDL routine amoeba, which adopts the downhill method of Nelder & Meade (1965), while we estimated the best matching parameter using the least-squares method.
across Perseus ranges from 16 K to 22 K. The lowest regions spatially correlate with the highest , in agreement with the expectation for dense and cold molecular gas. Several localized regions with high stand out; two are the star-forming regions, IC348 and NGC1333, while the third is a ring-like feature located at (RA,Dec) = (03h39m30s,32∘) with a radius of 56′. Ridge et al. (2006b) investigated this ring in detail using IRAS, MSX, 2MASS , and CO data and concluded that the ring, the product of an Hii region driven by the B-type star HD 278942, is likely located behind IC348. However, they also argued that the ring is interacting with Perseus, based on the spatial correlation between 8 m emission and 2MASS . The ring is visible in the 2MASS image but at a much lower contrast, implying that the ring is not as significant column density feature as one might infer from the IRIS data. Therefore, we exclude it from further analysis by applying a circular mask of radius of 56′. This mask size is consistent with what Ridge et al. (2006b) used to separate the ring from the Perseus cloud component, 50′.
At this point, we refined the zero point of the image by assuming that the dust column density traced by is proportional to (Hi) for the regions dominated by diffuse atomic gas. Under this assumption, would approach zero as (Hi) approaches zero and any offset from this relation is likely due to the uncertainties in the zero points of the IRIS images. As a result of this exercise, we added 1.8 10-4 to the image. The observed offset in implies a small additional uncertainty in , which is of order of 0.03–0.6 K.
4.4
Once we estimate using the VSG–corrected , we convert to by:
| (3) |
where is the conversion factor that relates the dust column density to the extinction in the -band. The conversion factor = 720 is estimated by finding the best agreement between our derived image and the 2MASS image for the region where the two images overlap. Our and 2MASS have a 1:1 relation but with an average scatter of 0.5 mag. This scatter around the 1:1 relation is mostly attributed to the variation in along a line of sight (e.g., GPS09).
We note that the bootstrapping of our image derived from the IRIS data with the image derived from the 2MASS extinction data is motivated by GPS09. For Perseus, GPS09 inter-compared three methods for measuring total gas column density; extinction mapping at near-infrared (NIR) wavelengths, thermal emission mapping at FIR wavelengths, and CO emission mapping. They found that the dust-based measures (NIR extinction and FIR emission) are superior to the gas-based measure (CO emission) and particularly suggested the NIR extinction as the best probe of total gas column density. Any molecular transition, such as CO emission, traces a limited range of volume densities due to the critical density for excitation, opacity, and depletion. The dust-based measures have a wider dynamic range, but the NIR extinction measure saturates at high extinctions where background sources cannot be observed and the FIR emission measure is limited at low extinction values. In addition, the FIR emission measure suffers from its intrisic uncertainty, the variation of along a line of sight. Overall, the NIR extinction measure is the best probe up to its saturation level. Therefore, our calibration of to the 2MASS image would provide a better estimate of the total gas column density, compared to the total gas column density derived solely from the IRIS data.
4.5 Dust-to-Gas Ratio and
Finally, we calculate (H2) by:
| (4) |
where DGR is defined by DGR = and .
To measure DGR in Perseus, we plot as a function of over the whole cloud in Figure 8. As we expect for the regions dominated by diffuse atomic gas (which correspond to the majority of data points in Figure 8), the fitted slope mag cm2 is a good measure of DGR. Our estimate is 2 times higher than the typical Galactic DGR, 5.3 10-22 mag cm2 (e.g., Bohlin et al. 1978). This is not concerning as notable variations have been found for the Galactic DGR. For example, Kim & Martin (1996) compiled /(H) values for the Galaxy derived from UV absorption measurements from literature and found that /(H) can be higher than the typical Galactic value by a factor of three (see their Figure 4).
We also compare our DGR estimate with values obtained from two independent methods:
(1) Copernicus/FUSE absorption measurements:
Toward HD 22951, HD 23180, and BD,
Copernicus/FUSE measured H2 directly in absorption
(Savage et al. 1977; Rachford et al. 2002).
HD 22951 and HD 23180 are B1 stars and BD is a B5 star.
Towards BD, Snow et al. (1994) measured mag
and combined this with the observed and ,
resulting in mag cm2.
However, extinction parameters are not known for HD 22951 and HD 23180.
Considering that HD 22951, HD 23180, and BD are close to each other on the sky,
if we apply measured for BD to both HD 22951 and HD 23180,
we obtain = (4.6–6) mag cm2.
While these estimates are close to the typical Galactic DGR,
we note that they are likely lower limits on the DGR of Perseus,
considering that most of the lines of sight surveyed by the Copernicus/FUSE
are composed of two or more diffuse clouds (e.g., Rachford et al. 2002, 2009).
Rachford et al. (2002) compared the observed high rotational transition column densities of H2
to the model of H2 formation, destruction, and ro-vibrational excitation developed by Browning et al. (2003)
and found that it is impossible to reproduce the observed column densities under a single cloud assumption.
Instead, models with multiple clouds along the line of sight, and/or multiple pathways of incident UV radiation,
match much better the observed column densities.
Stars preferentially form in regions with high DGR,
where dust grains provide both high shielding against photodissociation and sites for H2 formation.
Therefore, if several diffuse clouds exist along the line of sight toward Perseus,
the component associated with Perseus likely has a higher DGR.
In this case, the DGR measured along the whole line of sight is lower than the actual DGR of Perseus.
(2) Upper limit on the DGR:
Equation (4) itself provides an upper limit on the DGR.
If the DGR is too high, a large number of data points will have a negative value of (H2).
For example, if DGR > 1.5 10-21 mag cm2,
more than 50% of the pixels with > 1 mag will have a negative value of (H2).
Therefore, it is most likely that the DGR in Perseus is less than 1.5 10-21 mag cm2.
Conclusion: Based on two independent constraints on the DGR, we conclude that our estimate of mag cm2 is midway between the lower and upper limits and therefore represents a very reasonable estimate.
4.6 Uncertainty in N(H2)
We estimate the uncertainty in for each pixel by performing a series of Monte Carlo simulations. In these simulations, we take into account the uncertainties in and and how they propagate into .
For the uncertainty in , we generate 1000 (Hi) images by using 1000 velocity widths randomly drawn from a Gaussian distribution that peaks at 20 km s-1 with 1 of 4 km s-1 (based on Section 3.2). The median 1 of due to the systematic uncertainty in using a particular velocity width is 5.6 1019 cm-2.
For the uncertainty in , we assess the range of by varying the input parameters and deriving each time. We add/subtract 1 noise to/from the 60 m and 100 m images (0.07 MJy sr-1 at 60 m and 0.48 MJy sr-1 at 100 m) and use or 2. Therefore, we derive the images with 8 different combinations of the input parameters and for each case the contribution from VSGs to and for are determined by finding the best matching parameters. To include the uncertainties of the zero point, we also derive the images with and without the zero point calibration. We find that the contribution from VSGs to varies from 0.12 to 0.24 with a median of 0.17, while varies from 630 to 810 with a median of 728. Finally, we compare the 16 images and find the maximum and minimum estimates of for each pixel.
The uncertainty in and the maximum/minimum estimates of are incorporated in a Monte Carlo simulation to produce 1000 images. We use the distribution of the simulated to estimate the uncertainty in on a pixel-by-pixel basis. The median 1 of (H2) is 3.6 1019 cm-2.
In addition to the above considerations, several systematic effects are also likely to affect ; (1) the assumption of a single dust population and temperature along a line of sight, (2) the assumption of a single DGR, and (3) the assumption that H2 is the dominant source of excess dust emission. As it is difficult to estimate the magnitude of these effects, we do not include them in our Monte Carlo simulations.
5 General Results
5.1
across Perseus ranges from 16 K to 22 K with a median of 17 K. This is in agreement with SFD98 who found 17 K for the same region and S05 who found a slightly higher 18 K for the main body of Perseus. Similarly, Stepnik et al. (2003) derived 17 K for the outskirts of Taurus using the DIRBE data at 140 m and 240 m.
As shown in Figure 7, the lowest regions spatially correlate with the AV and CO images, in agreement with the expectation for dense and cold clouds. The prominent minima in correspond to B5, B1E, B1, L1448, L1451, and L1455. These dark regions contain a number of IR sources and Herbig-Haro objects that are considered to be associated with pre-main sequence stars (e.g., Bally et al. 2008), but the luminosities of these objects are so low that their influence on the overall energy budget of the clouds would be negligible. Therefore, within these dark regions is determined by the external ISRF and dust grain properties. Low in B5, B1E, B1, L1448, L1451, and L1455 compared to the surrounding regions suggests that the inside of these regions gas is dense enough to have sufficient shielding against the external ISRF, leading to efficient cooling. For example, B5 has limb-brightening in CO, indicating a cold cloud interior surrounded by a photo-heated exterior (e.g., Beichman et al. 1988).
Figure 7 also shows several localized regions with high . One of the prominent features is the warm dust ring at (RA,Dec) = (03h39m30s,), already discussed in Section 4.3. The other high features include IC348 and NGC1333. To quantify how much hotter these star-forming regions are, we plot the histograms of in Figure 9. For the histograms, we use the data points in the rectangular boxes shown in Figure 10. Each box has either a dark or a star-forming region and extends up to the edge of the image. The width of each box is set based on the COMPLETE 13CO(1–0) data to include the whole region of interest. While all regions have a similar median of 17 K, the star-forming regions have data points with higher . For example, for IC348 and NGC1333, 11% and 2% of data points have > 18 K, while for B5, B1E, and B1, all data points have < 18 K. The data points with > 18 K are found in the central parts of IC348 and NGC1333, where B-type stars are located (blue crosses and red stars in Figure 7), and this implies that the internal radiation field may play a significant role in heating dust grains inside IC348 and NGC1333. This possibility is discussed further in the next section.
5.2 ISRF: External or Internal?
We now investigate possible heating sources that can result in the measured . As we mentioned in Section 1, KMT09’s model assumes a uniform external ISRF. Understanding the origin of ISRF is therefore important for comparison between observations and the model. There are two possible sources of ISRF that are responsible for the measured across Perseus; (1) the UV flux from the B-type stars in Perseus (local) and (2) the UV radiation field determined by the overall stellar distribution in the Galaxy (global).
(1) We consider two B5 V-type stars in Perseus (red stars in Figure 7) as possible sources of the local ISRF. All other stars have spectral types later than B5555Two B8 V-type stars in NGC1333 (blue crosses in Figure 7) contribute negligibly to the UV flux. We do not consider the B4 IV–V-type star (red triangle in Figure 7) due to its uncertain stellar classification (e.g., Lesh 1969; Klochkova & Kopylov 1985; Černis 1990). Nevertheless, inclusion of this star does not change our result.. We assume that the spectral energy distribution of a B-type star is approximately a black body curve (e.g., Spaans et al. 1994) and adopt = 15600 K for a B5 V-type star (Morton & Adams 1968). For = 912–2066 Å, two B5 V-type stars emit 2.12 1012 erg cm-2 s-1. If a distance of 15 pc from each star, which corresponds to 1/3 of the longitudinal size of our sky coverage, is assumed, the UV flux from the two B5 V-type stars is reduced to 3.04 10-5 erg cm-2 s-1 (1/ geometrical dilution). For dust grains in thermal equilibrium, is determined by (Lequeux 2005):
| (5) |
where is the UV flux and is the size of dust grains. An absorption efficiency = 1, appropriate for large dust grains that dominate the FIR emission and have a size comparable to UV wavelengths, and a dust emissivity spectral index = 2 are assumed for Equation (5). Therefore, dust grains with a radius = 0.1 m in the UV radiation field of 3.04 10-5 erg cm-2 s-1 would have 9.3 K. Note that we do not consider the decrement of UV flux by dust attenuation. Therefore, if the B-type stars are the only sources of the ISRF, we would expect K in the outskirts of Perseus.
(2) We consider the global Galactic ISRF of Porter & Strong (2005). Porter & Strong (2005) adopted the Galactic stellar and dust distribution models and calculated the radiation field from stars at = 0.1–1000 m. The ISRF was found to be the most intense in the inner Galaxy, to decrease toward the Galactic poles, but to remain steady up to 5 kpc from the Galactic plane. For (Galactocentric radius) = 0 and (Galactocentric height) = 0, the radiation field at 0.1 m is 0.08 eV cm-3 and for = 0 and = 5 kpc, the radiation field at 0.1 m is 0.01 eV cm-3 (see Figure 2 of Porter & Strong 2005). If we assume that this 87.5% decrement of the UV radiation field at = 0 from = 0 to 5 kpc would be applicable for 8 kpc, the UV radiation field at pc (the location of Perseus; 8 kpc and pc) would be between 2.7 10-3 (the UV radiation field in the solar neighborhood at = 912–2066 Å; ) and 3.4 10-4 erg cm-2 s-1 (12.5% of ). Applying Equation (5), this corresponds to 14 K < < 20 K. As our median 17 K is indeed in this range, the UV ISRF determined by the overall stellar distribution in the Galaxy could be the dominant heating source for dust grains across Perseus.
Therefore, we conclude that Perseus is embedded in the uniform Galactic ISRF that heats dust grains up to 17 K, except for the central parts of IC348 and NGC1333 where the radiation from the B-type stars is dominant.
6 The Hi– Transition in Perseus: Theoretical Perspective
KMT08 modeled H2 formation and photodissociation for a spherical cloud that is bathed in a uniform ISRF. They assumed that the Hi–H2 transition is infinitely sharp and found that the location of the transition inside an atomic-molecular complex is solely determined by two dimensionless numbers:
| (6) |
| (7) |
Here 0.1 is the fraction of absorptions of LW photons that produce H2 dissociation rather than decay back to a bound state, is the dust absorption cross section per H nucleus in the LW band, is the number density of LW photons, is the number density of CNM in the Hi shielding layer, is the H2 formation rate coefficient on dust grains, and is the cloud radius. is the ratio of the rate at which LW photons are absorbed by dust grains to the rate at which they are absorbed by H2. We can consider as a dimensionless measure of the strength of the ISRF. For example, in strong radiation fields, H2 molecules are easily photodissociated and therefore the absorption of LW photons is dominated by dust grains (large ). On the contrary, in weak radiation fields, H2 molecules survive and due to their large resonant cross section the absorption of LW photons is dominated by H2 molecules (small ). is simply the dust optical depth that the cloud would have if its density is equal to .
Using and , KMT08 derived , the fraction of the cloud radius where the Hi–H2 transition occurs:
| (8) |
where
Then, the dust optical depth through the Hi shielding layer, , can be determined by:
| (9) |
The Hi shielding surface density for H2 formation, , is simply:
| (10) |
where is the mass per H nucleus.
To investigate what fraction of the gas in an atomic-molecular complex is molecular, KMT09 simplified the above equations as follows. First, as both and are the measures of dust surface area, their ratio is nearly unity and drops out of Equation (6). Second, is determined from the condition of pressure balance between the cold neutral medium (CNM) and warm neutral medium (WNM) phases:
| (11) |
Here is the incident UV radiation field and is the metallicity. The primes indicate that quantities are normalized to the values in the solar neighborhood. There is a maximum temperature at which CNM can be in pressure balance with WNM and the corresponding density is the minimum CNM density, (Wolfire et al. 2003). Typically, 1–10. As , and drop out of Equation (6) and becomes purely a function of and :
| (12) |
To estimate , KMT09 started from the mean column density, , of a spherical cloud that consists of a molecular core of number density and a Hi shielding layer of number density :
| (13) |
Here is the ratio of to . Once , the dust optical depth that the cloud would have if its Hi and H2 are uniformly mixed, is defined by:
| (14) |
can be expressed as a function of , , and :
| (15) |
As a consequence of these simplified functions, the H2 mass fraction, , can be expressed with the following analytic function:
| (16) |
where is the H2 mass and is the total cloud mass. Finally, the H2-to-Hi ratio, , can be expressed as:
| (17) |
With being a function of and , and being a function of the cloud gas column density, is determined by the total gas column density, , , and , and is independent of the strength of the ISRF. While the total gas column density and are direct observables, and are not. KMT09 adopted = 3 and = 10 as fiducial values. Note that the H2-to-Hi ratio can observationally be expressed as .
Another important model prediction is that has a dependence on and is almost independent of the strength of the ISRF. Based on Equation (9) and (10), slightly increases with via and and increases with via = . Therefore, decreases with to a power less than unity as . For solar metallicity, KMT09 predict 10 M⊙ pc-2.
7 The Hi– Transition in Perseus: Observational Perspective
From our derived (Hi) and (H2) images, we calculate and by:
| (18) |
We find that is relatively constant across Perseus with a range of 5–11 M⊙ pc-2, while has a wider range of 0–73 M⊙ pc-2. This results in a small dynamic range of , from 8 M⊙ pc-2 to 30 M⊙ pc-2 across most of the Perseus cloud.
We then derive = /, which allows us to directly test KMT09’s predictions. The image is presented in Figure 10. We find that the derived ranges from 0 to 10, with a median of 0.1. This suggests that diffuse molecular gas is pervasive in Perseus. For example, the data points with > 1, which can be considered to be molecular-dominated, comprise only 9% of the total data points. We note that spatial variations in the distribution are mainly determined by the distribution, due to the small dynamic range of . The high features spatially correlate with the and CO images and correspond to the dark and star-forming regions in Perseus.
7.1 vs for the Dark and Star-forming Regions
To investigate KMT09’s predictions, we focus on several dark and star-forming regions in Perseus and measure radially to probe the cloud envelopes with the lowest . In Figure 11, we plot as a function of for B5, IC348, B1E, B1, and NGC1333. For each plot we use the data points in the rectangular boxes shown in Figure 10. The overlaid curves are KMT09’s predictions for particular combinations of input parameters, , , and . These parameters will be determined and discussed in Section 7.2.1.
We find an almost constant 6–8 M⊙ pc-2 for each region. This is consistent with the small range of found across the whole Perseus cloud. However, the median value of slightly changes between the regions. For example, B5 has the lowest median M⊙ pc-2 and NGC1333 has the highest median M⊙ pc-2. A similar result for Perseus was pointed out by Sancisi et al. (1974) who found that remains approximately constant at 8 M⊙ pc-2 for a wide range of interstellar extinction. Several extragalactic studies have also noticed that does not exceed 10 M⊙ pc-2 for nearby galaxies (e.g., Wong & Blitz 2002; Blitz & Rosolowsky 2004, 2006; Bigiel et al. 2008; Wong et al. 2009).
In KMT09’s model, H2 formation requires a certain amount of to shield H2 against photodissociation. Once this minimum is achieved, H2 forms out of Hi and remains constant. KMT09’s model predicts 10 M⊙ pc-2 for solar metallicity and this is indeed consistent with what we find in Figure 11. For all five regions, we find saturation of 6–8 M⊙ pc-2. However, in the case of B5 and NGC1333, we do not probe the regions of purely atomic gas, which correspond to the linear portion of the model curves in Figure 11. For IC348, B1E, and B1, we see hints of a possible turnover between atomic- and molecular-dominated zones at = 5–8 M⊙ pc-2, yet our observations do not sample well the purely atomic zones. This inability to probe purely atomic regions is not due to the sensitivity of our and images. In Figure 11, we show the median 3 values of and for the whole Perseus cloud as the black dashed lines. All data points are clearly above the 3 values and this suggests that the lack of turnover detection is due to the highly extended atomic envelopes. For example, in the case of B5 and NGC1333, we are probing radial profiles up to 15–20 pc from the centers of the regions. Therefore, the purely atomic envelopes are likely located more than 20 pc from the molecular peaks.
7.1.1 Effect of High Optical Depth
An alternative or additional explanation for the relatively constant we measured could be a high optical depth of Hi in Perseus. If Hi gas is optically thick, the measured brightness temperature levels off at a temperature close to the kinetic temperature . Therefore, under the assumption of optically thin Hi gas (which we used to calculate our ), would saturate as and therefore be underestimated. There are a few lines of evidence that indicate the presence of cold, optically thick CNM in Perseus. For example, HISA features were found toward the centers of several dark and star-forming regions (e.g., Ridge et al. 2006a). In addition, Heiles & Troland (2003b) analyzed the Hi emission/absorption spectra obtained toward two radio sources behind Perseus, 3C93.1 and NRAO140, and found CNM components in Perseus (based on radial velocity information) that have optical depths 1 and 7.
The best way to estimate the effect of optical depth is to measure CNM in absorption in the direction of many background radio sources behind Perseus. This provides the total column density of atomic hydrogen gas () along each line of sight, which can be compared with the column density we measured in Section 3.2 to derive the optical depth corrections for the whole cloud. As only two such measurements exist so far, we are in the process of obtaining additional Hi absorption measurements. Here we investigate only the magnitude of the optical depth effect.
If we assume = 70 K as measured by Heiles & Troland (2003b), the corrected (Hi) will need to be calculated using the following equation:
| (19) |
If we apply this equation to our (Hi) image, we find that changes by a factor of 1.2–2. Another approach involves using the statistics of CNM and WNM from Heiles & Troland (2003b). Their Table 1 summarizes the CNM and WNM column densities for all sources in their survey. We can then estimate the fraction of CNM column density (relative to the total column density) as a function of WNM column density. Using only the table entries for a region centered on Perseus and 1200 deg2 in size, we find that the CNM fraction is close to 50% for WNM column density less than 1.2 1021 cm-2. This again suggests that our (Hi) or could be underestimated by a factor of two.
Our excercise shows that a high optical depth along each line of sight could result in a factor of two spread in for Perseus. This is not substantial and therefore the almost constant we measured is likely a real physical feature, possibly driven by the conversion of Hi into H2. However, the magnitude of the optical depth effect we estimated is approximate and measuring the true distribution across Perseus needs a more sophisticated investigation.
7.2 vs for the Dark and Star-forming Regions
We now investigate KMT09’s prediction of vs for the dark and star-forming regions in Perseus. In Figure 12, we plot as a function of for B5, IC348, B1E, B1, and NGC1333. For each plot we use the data points in the rectangular boxes shown in Figure 10.
We find that the relation between and is remarkably consistent for all dark and star-forming regions. Each plot in Figure 12 shows a very sharp rise of at low , a turnover around 1, and a slow increase toward higher . For the two star-forming regions, reaches a value of 10, while for the three dark regions, is less than 5.
7.2.1 Best-fit Curves
In Figure 12, we overlay KMT09’s predictions as red solid curves and find excellent agreement. The overlaid curves were derived using Equation (17) with the assumption of and for all dark and star-forming regions. The fiducial value was adopted following the discussion in KMT09. We note that does not make a significant change in . For example, between and 50, at = 100 M⊙ pc-2 only varies by a factor of 1.1. Our assumption of a single is based on the result of González Hernández et al. (2009) and our DGR investigation in Section 4.5. González Hernández et al. (2009) studied the chemical composition of Černis 52, an A3 V-type star in the direction of Perseus and derived a metallicity of [Fe/H] = (corresponding to 0.7–1.4 Z⊙). They determined a distance to Černis 52 of 231 pc and in conjuction with the radial velocity information concluded that Černis 52 is likely a member of IC348. As a single DGR fits most of the diffuse regions in Perseus, there is probably no significant variation of across the cloud. Therefore, we adopt for all dark and star-forming regions in Perseus throughout this paper and constrain only from our fitting666 We have attempted to determine the best-fit curve for vs by using both and as free parameters but have found that the results are consistent with the case of and varying within 1..
We performed Monte Carlo simulations to determine the best-fit curves with consideration of uncertainties in both and . We added random offsets to and and repeated this process 1000 times. For each variable, offsets were drawn from a Gaussian distribution with the standard deviation equal to the measured noise. For each realization, we determined the best-fit curve by assuming and and finding that minimizes the sum of the squares of the residuals. IDL routine mpfitfun (Markwardt 2009) was used for the fitting. Finally, we estimate the median among the simulated 1000 and use it as the best-fit parameter. We summarize this best-fit for each region in Table 1.
7.2.2 Fitting Results
We find that ranges from 6 to 10. As determines the typical CNM number density via , = 6–10 translates into = 60–75 K under the assumption of thermal pressure allowing the coexistence of CNM and WNM (see Equation 19 of KMT09). This temperature range is indeed consistent with typical CNM properties in the solar neighborhood. Heiles & Troland (2003b) examined Hi emission/absorption spectra obtained toward 79 radio sources and found a median of 70 K for CNM.
While appears to systematically decrease toward the west of Perseus, we find no significant difference in between the dark and star-forming regions. This implies that Hi envelopes surrounding these regions have similar . We estimate = 20–30 cm-3 using = = 0.4 derived from Equation (5) with = 17 K. The similar further suggests a similar normalized radiation field of 1–1.5. As measures the relative importance of dust shielding and H2 self-shielding, implies that dust shielding and H2 self-shielding are equally important for H2 formation in Perseus.
7.2.3 Column Density at The Hi–H2 Transition
KMT09 assume an infinitely sharp Hi–H2 transition and in this case would be zero at the Hi shielding column density. However, in reality, the transition cannot be infinitely sharp and KMT09 estimate 0.25 at the Hi shielding column density by comparing the theoretical Hi shielding column densities with the detailed numerical radiative transfer calculations. For solar metallicity, KMT09 predict (as shown with the red solid curves) that 0.25 occurs at = 7–10 M⊙ pc-2. This is indeed consistent with what we see in Figure 12; 0.25 at = 6–12 M⊙ pc-2 or = (8–14) 1020 cm-2. This transition column density is a factor of 2–3 larger than what previous studies found in the Galaxy via UV absorption measurements (e.g., Savage et al. 1977; Gillmon et al. 2006). However, considering that the previous studies defined the transition column density at 0.1 and linearly increases with , our result is consistent with the previous studies.
7.3 Radial Profiles
To investigate how radially changes from a molecular peak, we plot as a function of distance from the center of each dark and star-forming region in Figure 13. We use the data points in the rectangular boxes (see Figure 10) and calculate the mean in three-pixel size bins (bin size = 12.9′, corresponding to 1.1 pc at the distance of 300 pc) to remove small-scale fluctuations.
For all five regions, we find two power-law functions () in their radial profiles up to . Beyond , the radial profiles show slight fluctuations due to the presence of small-scale structure in the image and/or become flat. We perform a linear least-squares fit to each radial profile up to and summarize the results in Table 2 with other properties of the radial profiles. We list the slopes of power-law functions ( and ), the radius where the transition from the shallow to steep power-law functions occurs (), at (), the radius where the Hi–H2 transition occurs (), the radius where hydrogen is predominantly in the form of Hi (), and the thickness of the Hi–H2 transition region (). We define as a radius at 0.25, as a radius at 0.1, and as .
We find no significant difference between the dark and star-forming regions in terms of their radial distribution. The shallow portion of the radial profiles has a slope of = 0.4–0.7, while the steep portion has a slope of = 1.4–3.7. The transition from the shallow to the steep power-law function occurs at 30–90′ or 3–8 pc. At this , ranges from 0.5 to 1.2. In addition, we find that H2 extends up to 200′ or 17 pc from the centers of the dark and star-forming regions. This suggests that molecular clouds are much more extended than what is suggested by molecular tracers such as CO. The Hi–H2 transition, however, seems to be relatively sharp. We estimate = , which measures the size of diffuse H2 layer and therefore could be considered as the thickness of the transition region, and find 30–60′, corresponding to 3–5 pc. We then estimate the ratio of the thickness of the Hi–H2 transition region to the region size, < = 0.2–0.4. As we do not know the exact size of the dark and star-forming regions, provides only an upper limit on .
The other interesting thing to note is that the radial distribution becomes smoother toward the west of Perseus. Namely, becomes smaller from B5 to NGC1333. This may be related to decreasing from B5 to NGC1333 (inferred from decreasing from B5 to NGC1333 with the same ; see Section 7.2.1), even though it is not clear how affects the smoothness of radial distribution. In KMT09’s model, determines the location of the Hi–H2 transition and due to the assumption of the infinitely sharp transition, there is no such relation between and the smoothness of the radial distribution. This systematic variation of across Perseus could be resulted from the change of internal density structure and/or the complicated viewing geometry.
8 Comparison of H2 and CO Distributions
In Figure 14, we compare the H2 and CO distributions. The black and gray contours show the CfA data and our data, respectively. To ease the comparison, we plot only 3 contours for both data sets. Figure 14 shows that H2 is found wherever significant CO exists. However, the reverse is not true; a considerable amount of H2 exists beyond the 3 contour of . While H2 is generally more extended than CO, there are significant spatial variations. For example, CO and H2 trace each other remarkably well in the southwest part of Perseus, while H2 is significantly more extended elsewhere (particularly around B5, B1E, B1, IC348, and NGC1333).
8.1 Relative Distribution of and CO
To quantify the relative distribution of H2 and CO, we plot and as a function of distance from the center of each dark and star-forming region in Figure 15. We first smooth the image to the angular resolution of the CfA image and use the data points in the rectangular boxes shown in Figure 10. We then calculate the mean and in two-pixel size bins (bin size = 16.8′, corresponding to 1.5 pc at the distance of 300 pc). Finally, each radial profile is normalized by its peak value and therefore Figure 15 shows the relative distribution of H2 and CO. As spatial averaging improves SNR, the radial profiles of and allow us to investigate the relative distribution of H2 and CO more reliably than the visual comparison of 3 contours.
We find that all five regions have extended H2 compared to CO at all radii. For IC348, B1E, and NGC1333, H2 radial profiles show slight fluctuations and/or become flat at , which has been seen in Figure 13. We measure the radius where each H2 and CO radial profile drops off to 1/4 of its peak value ( and ) and calculate the ratio of to . We find that the ratio, , ranges from 1.2 to 2, with a median of 1.4. This suggests that on average H2 is 1.4 times more extended than CO in Perseus, implying the existence of a substantial amount of “CO-dark” gas.
8.2 Comparison to Wolfire et al. (2010): “CO-dark” Gas
The “CO-dark” gas refers to interstellar gas that exists in the form of H2 along with Ci and Cii, but little or no CO. Such gas has been predicted from theoretical models of PDRs, which showed that the Cii–CO transition occurs deeper into an interstellar cloud than the Hi–H2 transition due to the more effective self-shielding for H2 than CO (e.g., van Dishoeck & Black 1988; Tielens & Hollenbach 1985).
Recently, Wolfire et al. (2010; WHM10 hereafter) modeled the “CO-dark” gas and explored how the fraction of H2 gas mass in this “CO-dark” component depends on the mass of a cloud (), the UV radiation field (), the metallicity (), and the mean -band extinction (). They used a PDR code to calculate the H2, Ci, and Cii abundances in a spherical cloud and found that the fraction of “CO-dark” gas, , is 0.3 for solar metallicity over a wide range of and . Here is defined as = ()/, where and is the radius of the H2 and CO part of the cloud, respectively. Formally, is defined as the radius where 2 and is defined as the radius where the optical depth from the cloud surface to is 1. More simply, when expressed in terms of , depends only on the ratio . This is because is a measure of the “CO-dark” gas mass and is a measure of the H2 gas mass. Interestingly, WHM10 found that is a weak function of and is almost constant. Therefore, is strongly dependent only on . For example, for a cloud with CO mass of M⊙ and solar metallicity, is expected at mag, while is expected at mag.
To compare our observations to WHM10’s prediction, we calculate the H2 mass within the 3 boundary of () and compare it with the H2 mass within the 3 boundary of (). We find = ()/ 0.3. Note that our definition of is different from that of WHM10. This is because cannot be directly measured from observations. Nevertheless, and of WHM10 represent the total H2 and CO masses and therefore our is conceptually similar with what WHM10 used. We estimate 1.5 mag for the data points within . As WHM10 do not provide a prediction of at < 2 mag, we extrapolate it from their Figure 11; 0.8 is expected at 1.5 mag. Note that the expected 0.8 at 1.5 mag is for a cloud that has a much higher mass ( M⊙) and a stronger radiation field () than Perseus. Considering the predicted insensitivity of to the cloud mass and the strength of radiation field, however, we measure a factor of three lower value, 0.3.
To investigate this discrepancy between our and WHM10’s prediction, we first examine the dependence of on the DGR. As shown in Section 4.5, our estimate of and consequently depends on the DGR via Equation (4). In the same section, we discussed the lower and upper limits on the DGR. If we use the lower limit on the DGR instead of our adopted DGR, decreases to 1.1 mag and increases to 0.6. Our estimate is a factor of two lower than WHM10’s prediction at 1.1 mag, 0.9. Similarly, if we use the upper limit on the DGR, increases to 1.9 mag and decreases to 0.2. Our estimate is now a factor of four lower than WHM10’s prediction at 1.9 mag, 0.8. Note that “CO-dark” gas exists in Perseus even for these extreme cases and the discrepancy with the model persists.
Second, we test if is a strong function of as WHM10 predicted. For this purpose, we divide the image into four regions (see Figure 14) and estimate and for each region. We use the image derived from our adopted DGR, 1.1 10-21 mag cm2. In Table 3, we list the estimated and for the four regions. We find 0.3 for regions 1 and 2 and = 0.1–0.2 for regions 3 and 4. All regions have similar mean extinction, = 1.4–1.7 mag. While we have only four data points covering a small range of , we measure a relatively large range of , from 0.1 to 0.3. The large variation we find in is not consistent with WHM10, but echos the observations of other diffuse clouds in the Galaxy. For example, the Polaris cloud has 0.3 mag (Heithausen & Thaddeus 1990) and 0.36 (Abdo et al. 2010). On the other hand, the Pegasus cloud has 0.6 mag (Yamamoto et al. 2006) and 0.6 (Grenier et al. 2005).
This region-to-region variation we find in could be due to the DGR systematically changing across Perseus. For example, a factor of two lower DGR would allow regions 3 and 4 to have similar as regions 1 and 2. However, we do not find any evidence for such systematic change of the DGR when examining the correlation between (Hi) and FIR emission (see Section 4.2). As an alternative, the complicated viewing geometry of the H2 and CO distributions could result in the regional variation in .
9 Discussion
The excellent agreement between our data and KMT09’s predictions (Sections 7.1 and 7.2) suggests that KMT09’s model captures the fundamental physics of H2 formation reasonably well even on sub-pc scales. This is certainly encouraging, but slightly surprising considering how simple KMT09’s model is. Essentially, for a spherical cloud bathed in a uniform and isotropic ISRF, the most important factor for H2 formation is the Hi shielding surface density . Once enough shielding against photodissociation is achieved by , all additional is fully converted into , resulting in a uniform distribution and therefore a linear increase of with .
Before going into a more detailed discussion of several important aspects of KMT09’s model, we would like to remind the reader that two main predictions summarized in Section 6 are not independent. The predicted behavior of as a function of is a consequence of saturation of . Therefore, the excellent agreement between our data and KMT09’s predictions in Figure 12 is entirely driven by the constant . While we are not able to probe the purely atomic envelope of Perseus, the constant of 6–8 M⊙ pc-2 we find is in agreement with KMT09’s prediction of for solar metallicity.
In addition, we caution that our data do not allow us to fully test the dependence of on metallicity and ISRF. KMT09’s model predicts that depends on metallicity, while being almost insensitive to the strength of ISRF. While our findings are in agreement with KMT09’s predictions for solar metallicity and 2/5 of the Galactic ISRF, the lack of metallicity and ISRF variations across Perseus does not permit more detailed model testing. Future studies of high-latitude molecular clouds and GMCs in external galaxies with sub-solar metallicity will provide crucial tests of KMT09’s model. We now turn to several crucial model assumptions and discuss their possible limitations.
9.1 Equilibrium vs Non-equilibrium Formation
The most fundamental principle underlying KMT09’s model is H2 formation in equilibrium. In equilibrium, H2 formation and photodissociation are balanced and H2 abundance is locally constant. Several authors have investigated the time evolution of H2 and found a typical timescale of H2 formation in equilibrium, = 10–30 Myr (e.g., Goldsmith et al. 2007; Liszt 2007)
As is comparable to or longer than the estimated lifetime of GMCs, Myr (McKee & Ostriker 2007 and references therein), the role of interstellar turbulence in accelerating H2 formation has received significant attention in recent years (e.g., Hartmann et al. 2001; Bergin et al. 2004; Glover & Mac Low 2007; Glover et al. 2010). The main idea behind the models of H2 formation in turbulent media is that shocks induced by cloud–cloud collisions, spiral density waves, supernovae explosions, etc., compress diffuse atomic gas, allowing H2 to form in the postshock gas where high enough shielding is achieved against photodissociation. While earlier studies have been limited to 1D, Glover & Mac Low (2007) and Glover et al. (2010) performed 3D magnetohydrodynamical (MHD) simulations of turbulence with detailed chemical modeling. They showed that a significant amount of H2 could form within 1–2 Myr, due to the turbulence-driven clumping that accelerates H2 formation. However, the H2 abundance keeps increasing over time and never reaches equilibrium by 20–30 Myr. Eventually, the gas will become fully molecular unless the H2 formation is terminated by destruction of GMCs via stellar feedback, e.g., photoevaporation by Hii regions and protostellar outflows. This sharply contrasts with KMT09’s model.
Our results are consistent with the model of H2 formation in equilibrium and suggest that turbulence may play a secondary role in the H2 formation. Clearly, further studies are needed to compare abundances of H2 and other molecular species with the predictions from both stationary and turbulent models.
9.2 The Importance of WNM in the Envelopes of GMCs
We find that is uniform across Perseus with a range of 6–8 M⊙ pc-2, consistent with KMT09’s prediction of for solar metallicity. However, as CNM is far more effective at shielding against photodissociation than WNM, the predicted comes purely from CNM, while our measured includes the contributions from both CNM and WNM. As we discussed in Section 7.1.1, our measured could be underestimated by a factor of two for high optical depth gas (CNM). While corrected for high optical depth would likely still be comparable to KMT09’s prediction, the importance of WNM in the envelopes of atomic-molecular complexes clearly needs to be taken into account in the models of H2 formation. This is also supported by Bolatto et al. (2011) who found a relatively good agreement between KMT09’s prediction and the observed vs in the Small Magellanic Cloud, where WNM dominates the total Hi (Dickey et al. 2000). At the same time, it is essential to observationally constrain the relative contribution from CNM and WNM to . We are in the process of obtaining Hi absorption measurements for Perseus, which will allow us to separate the contributions from cold and warm gas.
9.3 The Importance of Internal Radiation
As we showed in Section 5.2, in the case of IC348 and NGC1333, the embedded B-type stars are the dominant sources of the radiation field. KMT09’s model does not take into account the role of internal radiation in determining , with the assumption that massive stars producing significant amounts of dissociating photons do not stay inside their parent molecular clouds for a long time. While we clearly see the importance of the B-type stars for dust heating, we find no significant difference in our analysis of for the dark and star-forming regions. This supports the idea that the internal radiation is not important for H2 formation. However, as we show below, this is valid for Perseus because it does not contain any stars earlier than the B5 V-type.
When O- or B-type stars suddenly turn on in a molecular cloud, UV photons from the stars photodissociate H2 and create Hi dissociation regions around Hii regions. This variation of the UV radiation field has a much shorter timescale (103 yr) than H2 formation (107 yr) and therefore totally changes the thermal and chemical structures of the molecular cloud (e.g., Hollenbach & Natta 1995; Bertoldi & Draine 1996). However, the sphere of photodissociation influence depends greatly on the stellar type.
Roger & Dewdney (1992) studied the properties of Hi dissociation regions around O- and B-type main sequence stars. Their source list includes SVS3, the B5 V-type star in NGC1333 (red star in Figure 7). An Hi region associated with SVS3 was measured to have = 0.017 M⊙ and = 0.03 pc (Rodríguez et al. 1990). This is consistent with an Hi dissociation region created by a star of K in a dense medium of cm-3. The size of the Hi dissociation region around this particular B5 star is only 1/10 of our spatial resolution. Therefore, the Hi dissociation regions around the individual B-type stars in Perseus are below our spatial resolution and therefore are negligible for our consideration of .
However, the internal radiation is still important for dust heating inside IC348 and NGC1333. This can be understood by the fact that not every UV photon produces photodissociation of H2. While UV and visible photons heat dust grains, only the UV photons in the narrower LW band (912–1120 Å) photodissociate H2. In addition, only 10% of the LW photons actually photodissociate H2 (). Therefore, the UV photons from the B-type stars in IC348 and NGC1333 could be dominant for dust heating, while relatively ineffective for photodissociation of H2.
If any stars earlier than B3 V resided in Perseus, on the other hand, the role of the internal radiation in determining would be no longer negligible. For example, Roger & Dewdney (1992) found that an Hi region associated with IRAS 235456508 has = 1.4 M⊙ and = 0.4 pc and these properties are consistent with an Hi dissociation region created by a B3 V type star in a medium of cm-3. The size of the Hi dissociation region is now comparable to our spatial resolution and therefore around the stars earlier than B3 V would be significantly modified. Therefore, depending on the stellar type of stars residing inside GMCs, the internal radiation should not be ignored.
10 Summary
In this paper, we study the Hi–H2 transition across the Perseus molecular cloud on sub-pc scales (0.4 pc). We use the highest resolution Hi data for Perseus from the GALFA–Hi survey, which allow us to probe the outskirts as well as the main body of the cloud. The velocity range of the Hi emission associated with Perseus is determined based on the correlation between (Hi) and the dust column density traced by the 2MASS image. We then derive the (Hi) image under the assumption of optically thin Hi gas. The dust column density is estimated using the IRIS 60 m and 100 m images and is calibrated with the 2MASS image. In combination with the (Hi) image and the derived DGR, we use the dust column density to derive the (H2) image.
The (Hi) and (H2) images and the existing CO data for Perseus allow us to test two recent models of H2 and CO formation in equilibrium. For several dark and star-forming regions (B5, B1E, B1, IC348, and NGC1333), we investigate and as a function of and compare the results to KMT09’s predictions. We also compare the H2 and CO distributions and estimate the fraction of H2 mass in the “CO-dark” component, . We investigate as a function of and compare the result to WHM10’s prediction. Several of the main results can be summarized as follows:
1. For both dark and star-forming regions in Perseus, we find an almost uniform 6–8 M⊙ pc-2. This is consistent with KMT09’s prediction of the Hi shielding surface density for solar metallicity, M⊙ pc-2.
2. The purely atomic envelopes are located more than 20 pc from the centers of the dark and star-forming regions. We probe the and distributions up to 20–30 pc from the centers of the regions and barely detect the turnover between atomic- and molecular-dominated zones for IC348, B1E, and B1.
3. The relation between and on a log-linear scale is remarkably consistent for all dark and star-forming regions, having a very sharp rise of at low , a turnover around 1, and a slow increase toward higher .
4. The dark and star-forming regions have similar = 6–10, which implies that these regions are embedded in the atomic envelopes with = 20–30 cm-3. In addition, = 6–10 indicates a similar normalized radiation field , suggesting that dust shielding and H2 self-shielding are equally important for H2 formation.
5. We measure the Hi–H2 transition gas column density of = (8–14) 1020 cm-2 or = 6–12 M⊙ pc-2 at 0.25. This is consistent with the previous estimates for the Galaxy.
6. We estimate the fraction of “CO-dark” gas, , for Perseus, a factor of three lower than WHM10’s prediction. This implies that a significant amount of H2 gas is not traced by Galactic CO surveys.
7. We investigate the dependence of on and find a relatively large variation of 0.1–0.3 for similar mag. This is not consistent with WHM10’s prediction that is a strong function of .
While we generally find good agreement with KMT09’s predictions, several outstanding questions remain. Our estimated 6–8 M⊙ pc-2 is likely dominated by WNM, while KMT09’s model predicts shielding by CNM alone. Clearly, the WNM in the atomic envelopes of GMCs needs to be considered in the models of H2 formation as a source of shielding against photodissociation. The importance of gravitationally bound vs diffuse gas is another important aspect, as explored in Ostriker et al. (2010). In addition, KMT09’s model does not take into account the role of internal radiation for H2 formation. This is valid for Perseus as it does not contain early-type stars to photodissociate a significant amount of H2 that could be detected at our spatial resolution. However, if GMCs are young enough to harbor early-type stars that are able to change the thermal and chemical structures of the GMCs, the internal radiation cannot be ignored. Most importantly, our Perseus data on sub-pc scales are consistent with KMT09’s model for H2 formation in equilibrium and suggest that turbulence may not be of primary importance for H2 formation. Yet, the timescale for equilibrium H2 formation is longer than the estimated lifetime of most GMCs. This problem remains to be resolved. Future detailed comparisons of observations with non-equilibrium, turbulence-driven H2 formation models will be important to investigate the role of turbulence for formation of H2 and various molecular species.
We thank the anonymous referee for suggestions that improved this work. We also thank Ron Allen, Joss Bland-Hawthorn, Alberto Bolatto, Bruce Elmegreen, Fabian Heitsch, Mordecai Mac Low, Chris McKee, Eve Ostriker, Rene Plume, and Mark Wolfire for stimulating discussions. M.-Y.L., S.S., M.E.P., C.H., E.J.K., J.E.G.P., A.B., J.G., N.P., and D.S. acknowledge support from NSF grants AST-0707597, 0917810, 0707679, and 0709347. M.-Y.L. and S.S. thank the Research Corporation for Science Advancement for their support. K.A.D. acknowledges funding from the European Community’s Seventh Framework Program under grant agreement no PIIF-GA-2008-221289. J.E.G.P. was supported by HST-HF-51295.01A, provided by NASA through a Hubble Fellowship grant from STScI, which is operated by AURA under NASA contract NAS5-26555. The Arecibo Observatory is part of the National Astronomy and Ionosphere Center, which is operated by Cornell University under a cooperative agreement with the National Science Foundation. The National Radio Astronomy Observatory is a facility of the National Science Foundation operated under cooperative agreement by Associated Universities, Inc. We credit the use of the KARMA visualization software (Gooch 1996).
References
- Abdo, A. A., Ackermann, M., Ajello, M. et al. 2010, ApJ, 710, 133
- (1) Bally, J., Walawender, J., Johnstone, D., Kirk, H., & Goodman, A. A. 2008, Handbook of Star Forming Regions, Volume I: The Northern Sky, ed. B. Reipurth (ASP Monograph Publications, Vol. 4; San Francisco, CA: ASP), 308
- (2) Barriault, L., Joncas, G., Lockman, F. J., & Martin P. G. 2010, MNRAS, 407, 2645
- (3) Beichman, C. A., Wilson, R. W., Langer, W. D., & Goldsmith, P. F. et al. 1988, ApJ, 332, L81
- (4) Bergin, E. A., Hartmann, L. W., Raymond, J. C., & Ballesteros-Paredes, J. 2004, ApJ, 612, 921
- (5) Bertoldi, F., & Draine, B. T. 1996, ApJ, 458, 222
- (6) Bigiel, F., Leroy, A. K., Walter, F. et al. 2008, AJ, 136, 2846
- (7) Blitz, L., & Rosolowsky, E. 2004, ApJ, 612, 29
- (8) Blitz, L., & Rosolowsky, E. 2006, ApJ, 650, 933
- (9) Bolatto, A., Leroy, A. K., Jameson, K. et al. 2011, ApJ, 741, 12
- (10) Browning, M. K., Tumlinson, J., & Shull, J. M. 2003, ApJ, 582, 810
- (11) Bohlin, R. C., Savage, B. D., & Drake, J. F. 1978, ApJ, 224, 132
- (12) Boulanger, F., Abergel, A., Bernard, J.-P. et al. 1996, A&A, 312, 256
- (13) Černis, K. 1990, Ap&SS, 166, 315
- (14) Dame, T. M., Hartmann, D., & Thaddeus, P. 2001, ApJ, 547, 792
- (15) Désert, F.-X., Boulanger, F., & Puget, J. L. 1990, A&A, 237, 215
- (16) Dickey, J. M., Mebold, U., Stanimirović, S., Staveley-Smith, L. 2000, ApJ, 536, 756
- (17) Douglas, K. A., & Taylor, A. R. 2007, ApJ, 659, 426
- (18) Draine, B. T., & Bertoldi, F. 1996, 468, 269
- (19) Fukui, Y., & Kawamura, A. ARA&A, 2010, 48, 547
- (20) Fumagalli, M., Krumholz, M. R., Prochaska, J. X., Gavazzi, G., & Boselli, A. 2009, ApJ, 697, 1811
- (21) Fumagalli, M., Krumholz, M. R., & Hunt, L. K. 2010, ApJ, 722, 919
- (22) Gibson, S. J. 2010, ASPC, 438, 111
- (23) Gillmon, K., Shull, J. M., Tumlinson, J., & Danforth, C. 2006, ApJ, 636, 891
- (24) Giovanelli, R., Haynes, M. P., Kent, B. R. et al. 2005, AJ, 130, 2598
- (25) Glover, S. O. C., & Mac Low, M.-M. 2007, ApJ, 659, 1317
- (26) Glover, S. O. C., Federrath, C., Mac Low, M.-M., & Klessen, R. S. 2010, MNRAS, 404, 2
- (27) Goldsmith, P. F., Li, D., & Krčo, M. 2007, ApJ, 654, 273
- (28) González Hernández, J., Iglesias-Groth, S., Rebolo, R. et al. 2009, ApJ, 706, 866
- (29) Gooch, R. 1996, Astronomical Data Analysis Software and Systems V (ASP Conf. Ser. 101), ed. G. H. Jacoby & J. Barnes (San Francisco, CA: ASP), 80
- (30) Goodman, A. A., Pineda, J. E., & Schnee, S. L. 2009, ApJ, 692, 91 (GPS09)
- (31) Grenier, I. A., Casandjian, J.-M., & Terrier, R. 2005, Science, 307, 1291
- (32) Guram, S. S., & Taylor, A. R. 2009, The Low-Frequency Radio Universe (ASP Conf. Ser. 407), ed. D. J. Saikia et al. (San Francisco, CA: ASP), 282
- (33) Hartmann, L. W., Ballesteros-Paredes, J., & Bergin, E. A. 2001, 562, 852
- (34) Heithausen, A., & Thaddeus, P. 1990, ApJ, 353, L49
- (35) Heiles, C. 2005, Obtaining the IF Bandpass Using Least-Squares Frequency Switching (LSFS), http://www.naic.edu/ astro/aotms/performance/lsfs.ps
- (36) Heiles, C., & Troland, T. H. 2003a, ApJS, 145, 329
- (37) Heiles, C., & Troland, T. H. 2003b, ApJ, 586, 1067
- (38) Herbig, G. H., & Jones, B. F. 1983, AJ, 88, 1040
- (39) Herbig, G. H. 1998, ApJ, 497, 736
- (40) Hollenbach, D., & Natta, A. 1995, ApJ, 455, 133
- (41) Hollenbach, D., & Tielens, A. G. G. M. 1997, ARA&A, 35, 179
- (42) Imara, N., & Blitz, L. 2011, ApJ, 732, 78
- (43) Kalberla, P. M. W., Burton, W. B., & Hartmann, D. et al. 2005, A&A, 440, 775
- (44) Klochkova, V. G., & Kopylov, I. M. 1985, Astrofiz. Issled. Izv. Spets. Astrofiz. Obs., 20, 3
- (45) Kim, S.-H., & Martin, P. G. 1996, ApJ, 462, 296
- (46) Krumholz, M. R., McKee, C. F., & Tumlinson, J. 2008, ApJ, 689, 865 (KMT08)
- (47) Krumholz, M. R., McKee, C. F., & Tumlinson, J. 2009, ApJ, 693, 216 (KMT09)
- (48) Lada, C. J., Alves, J., & Lada, E. A. 1996, AJ, 111, 1964
- (49) Lequeux, J. 2005, The Interstellar Medium (Berlin: Springer)
- (50) Leroy, A. K., Bolatto, A. D., Bot, C. et al. 2009, ApJ, 702, 352
- (51) Lesh, J. R. 1969, AJ, 74, 891
- (52) Li, A. & Draine, B. T. 2001, ApJ, 554, 778
- (53) Liszt, H. S., & Lucas, R. 2000, A&A, 355, 333
- (54) Liszt, H. S. 2002, A&A, 389, 393
- (55) Liszt, H. S. 2007, A&A, 461, 205
- (56) Lombardi, M. & Alves, J. 2001, A&A, 377, 1023
- (57) Luhman, K. L., Stauffer, J. R., Muench, A. A. et al. 2003, ApJ, 593, 1093
- (58) Markwardt, C. B. 2009, ASP Conf. Ser. 411, Astronomical Data Analysis Software and Systems XVIII, ed. D. A. Bohlender, D. Durand, & P. Dowler (San Francisco, CA: ASP), 251
- (59) McKee, C. F., & Ostriker, E. C. 2007, ARA&A, 45, 565
- (60) Meyerdierks, H. & Heithausen, A. 1996, A&A, 313, 929
- (61) Miville-Deschnes, M.-A. & Lagache, G. 2005, ApJS, 157, 302
- (62) Morton, D. C., & Adams, T. F. 1968, ApJ, 151, 611
- (63) Nelder, J., & Meade, R. 1965, Comput. J., 7, 308
- (64) Narayanan, G., Heyer, M. H., Brunt, C. et al. 2008, ApJS, 177, 341
- (65) Ostriker, E. C., McKee, C. F., & Leroy, A. K. 2010, ApJ, 721, 9750
- (66) Peek, J. E. G., Heiles, C., Douglas, K. A. et al. 2011, ApJS, 194, 20
- (67) Porter, T. A. & Strong, A. W. 2005, ICRC (Pune), arXiv:astro-ph/0507119
- (68) Rachford, B. L., Snow, T. P., Tumlinson, J. et al. 2002, ApJ, 577, 221
- (69) Rachford, B. L., Snow, T. P., Destree, J. D. et al. 2009, ApJS, 180, 125
- (70) Reach, W. T., Koo, B.-C., & Heiles, C. 1994, ApJ, 429, 672
- (71) Ridge, N. A., Di Francesco, J., Kirk, H. et al. 2006a, AJ, 131, 2921
- (72) Ridge, N. A., Schnne, S. L., Goodman, A. A., & Foster, J. B. 2006b, ApJ, 643, 932
- (73) Rodríguez, L. F., Escalante, V., Lizano, S., Canto, J., & Mirabel, I. F. 1990, 365, 261
- (74) Roger, R. S., & Dewdney, P. E. 1992, ApJ, 385, 536
- (75) Sancisi, R. Goss, W. M., Anderson, C., Johansson, L. E. B., & Winnberg, A. 1974, A&A, 35, 445
- (76) Savage, B. D., Bohlin, R. C., Drake, J. F., & Budich, W. 1977, ApJ, 216, 291
- (77) Schlegel, D. J., Finkbeiner, D. P., & Davis, M. 1998, ApJ, 500, 525 (SFD98)
- (78) Schnee, S. L., Ridge, N. A., Goodman, A. A., & Li, J. G. 2005, ApJ, 634, 442 (S05)
- (79) Snow, T. P., Hanson, M. M., Seab, G. C., & Saken, J. M. 1994, ApJ, 420, 632
- (80) Spaans, M., Tielens, A. G. G. M., van Dishoeck, E. F., & Bakes, E. L. O. 1994, ApJ, 437, 270
- (81) Spaans, M., & Neufeld, D. A. 1997, ApJ, 484, 785
- (82) Stepnik, B., Abergel, A., Bernard, J.-P. et al. 2003, A&A, 398, 551
- (83) Tielens, A. G. G. M., & Hollenbach, D. 1985, ApJ, 291, 772
- (84) Ungerechts, H., & Thaddeus, P. 1987, ApJS, 63, 645
- (85) van Dishoeck, E. F., & Black, J. H. 1986, ApJS, 62, 109
- (86) van Dishoeck, E. F., & Black, J. H. 1988, ApJ, 334, 771
- (87) Wannier, P. G., Lichten, S. M., & Morris, M. 1983, ApJ, 268, 727
- (88) Wannier, P. G., Lichten, S. M., Andersson, B.-G., & Morris, M. 1991, ApJS, 75, 987
- (89) Wolfire, M. G., McKee, C. F., Hollenbach, D., & Tielens, A. G. G. M. 2003, ApJ, 587, 278
- (90) Wolfire, M. G., Hollenbach, D., & McKee, C. F. 2010, ApJ, 716, 1191 (WHM10)
- (91) Wong, T., & Blitz, L. 2002, ApJ, 569, 157
- (92) Wong, T., Hughes, A., Fukui, Y. et al. 2009, ApJ, 696, 370
- (93) Yamamoto, H., Kawamura, A., Tachihara, K. et al. 2006, ApJ, 642, 307
- (94)
TABLE 1
Fitting Results for vs
| Region | |
|---|---|
| B5 | |
| IC348 | |
| B1E | |
| B1 | |
| NGC1333 |
a Uncertainties in are estimated from the distribution of simulated 1000 .
TABLE 2
Properties of Radial Profiles
| Region | |||||||||
|---|---|---|---|---|---|---|---|---|---|
| (J2000) | (J2000) | (′) | (′) | (′) | (′) | ||||
| B5 | 03 47 39 | 32 51 28 | 90 | 0.7 | 120 | 160 | 30 (< 0.19) | ||
| IC348 | 03 44 13 | 32 04 13 | 70 | 1.2 | 120 | 150 | 50 (< 0.33) | ||
| B1E | 03 36 45 | 31 12 40 | 30 | 1.2 | 90 | 150 | 60 (< 0.40) | ||
| B1 | 03 33 18 | 31 08 23 | 60 | 0.8 | 110 | 170 | 50 (< 0.29) | ||
| NGC1333 | 03 29 17 | 31 21 16 | 60 | 0.5 | 100 | 190 | 40 (< 0.21) |
a Central position of each region.
For B5 and B1, the centers correspond to the peaks as their peaks are masked.
For IC348, B1E, and NGC1333, the centers correspond to the peaks.
b Radius where the transition from the steep to shallow power-law functions occurs.
c at .
d Radius where the Hi–H2 transition occurs. This radius is defined at 0.25.
e Radius where gas is mainly in Hi. This radius is defined at 0.1.
f Thickness of the Hi–H2 transition region. This is measured as .
The values in parantheses are .
b,c,d,e Estimated by eye.
b,d,e,f 1′ corresponds to 0.09 pc at the distance of 300 pc.
TABLE 3
and for Perseus
| Region | (mag)a | |
|---|---|---|
| 1 | 0.32 | 1.71 |
| 2 | 0.31 | 1.73 |
| 3 | 0.18 | 1.58 |
| 4 | 0.10 | 1.43 |
a 1 uncertainty is less than 1% of each quantity.
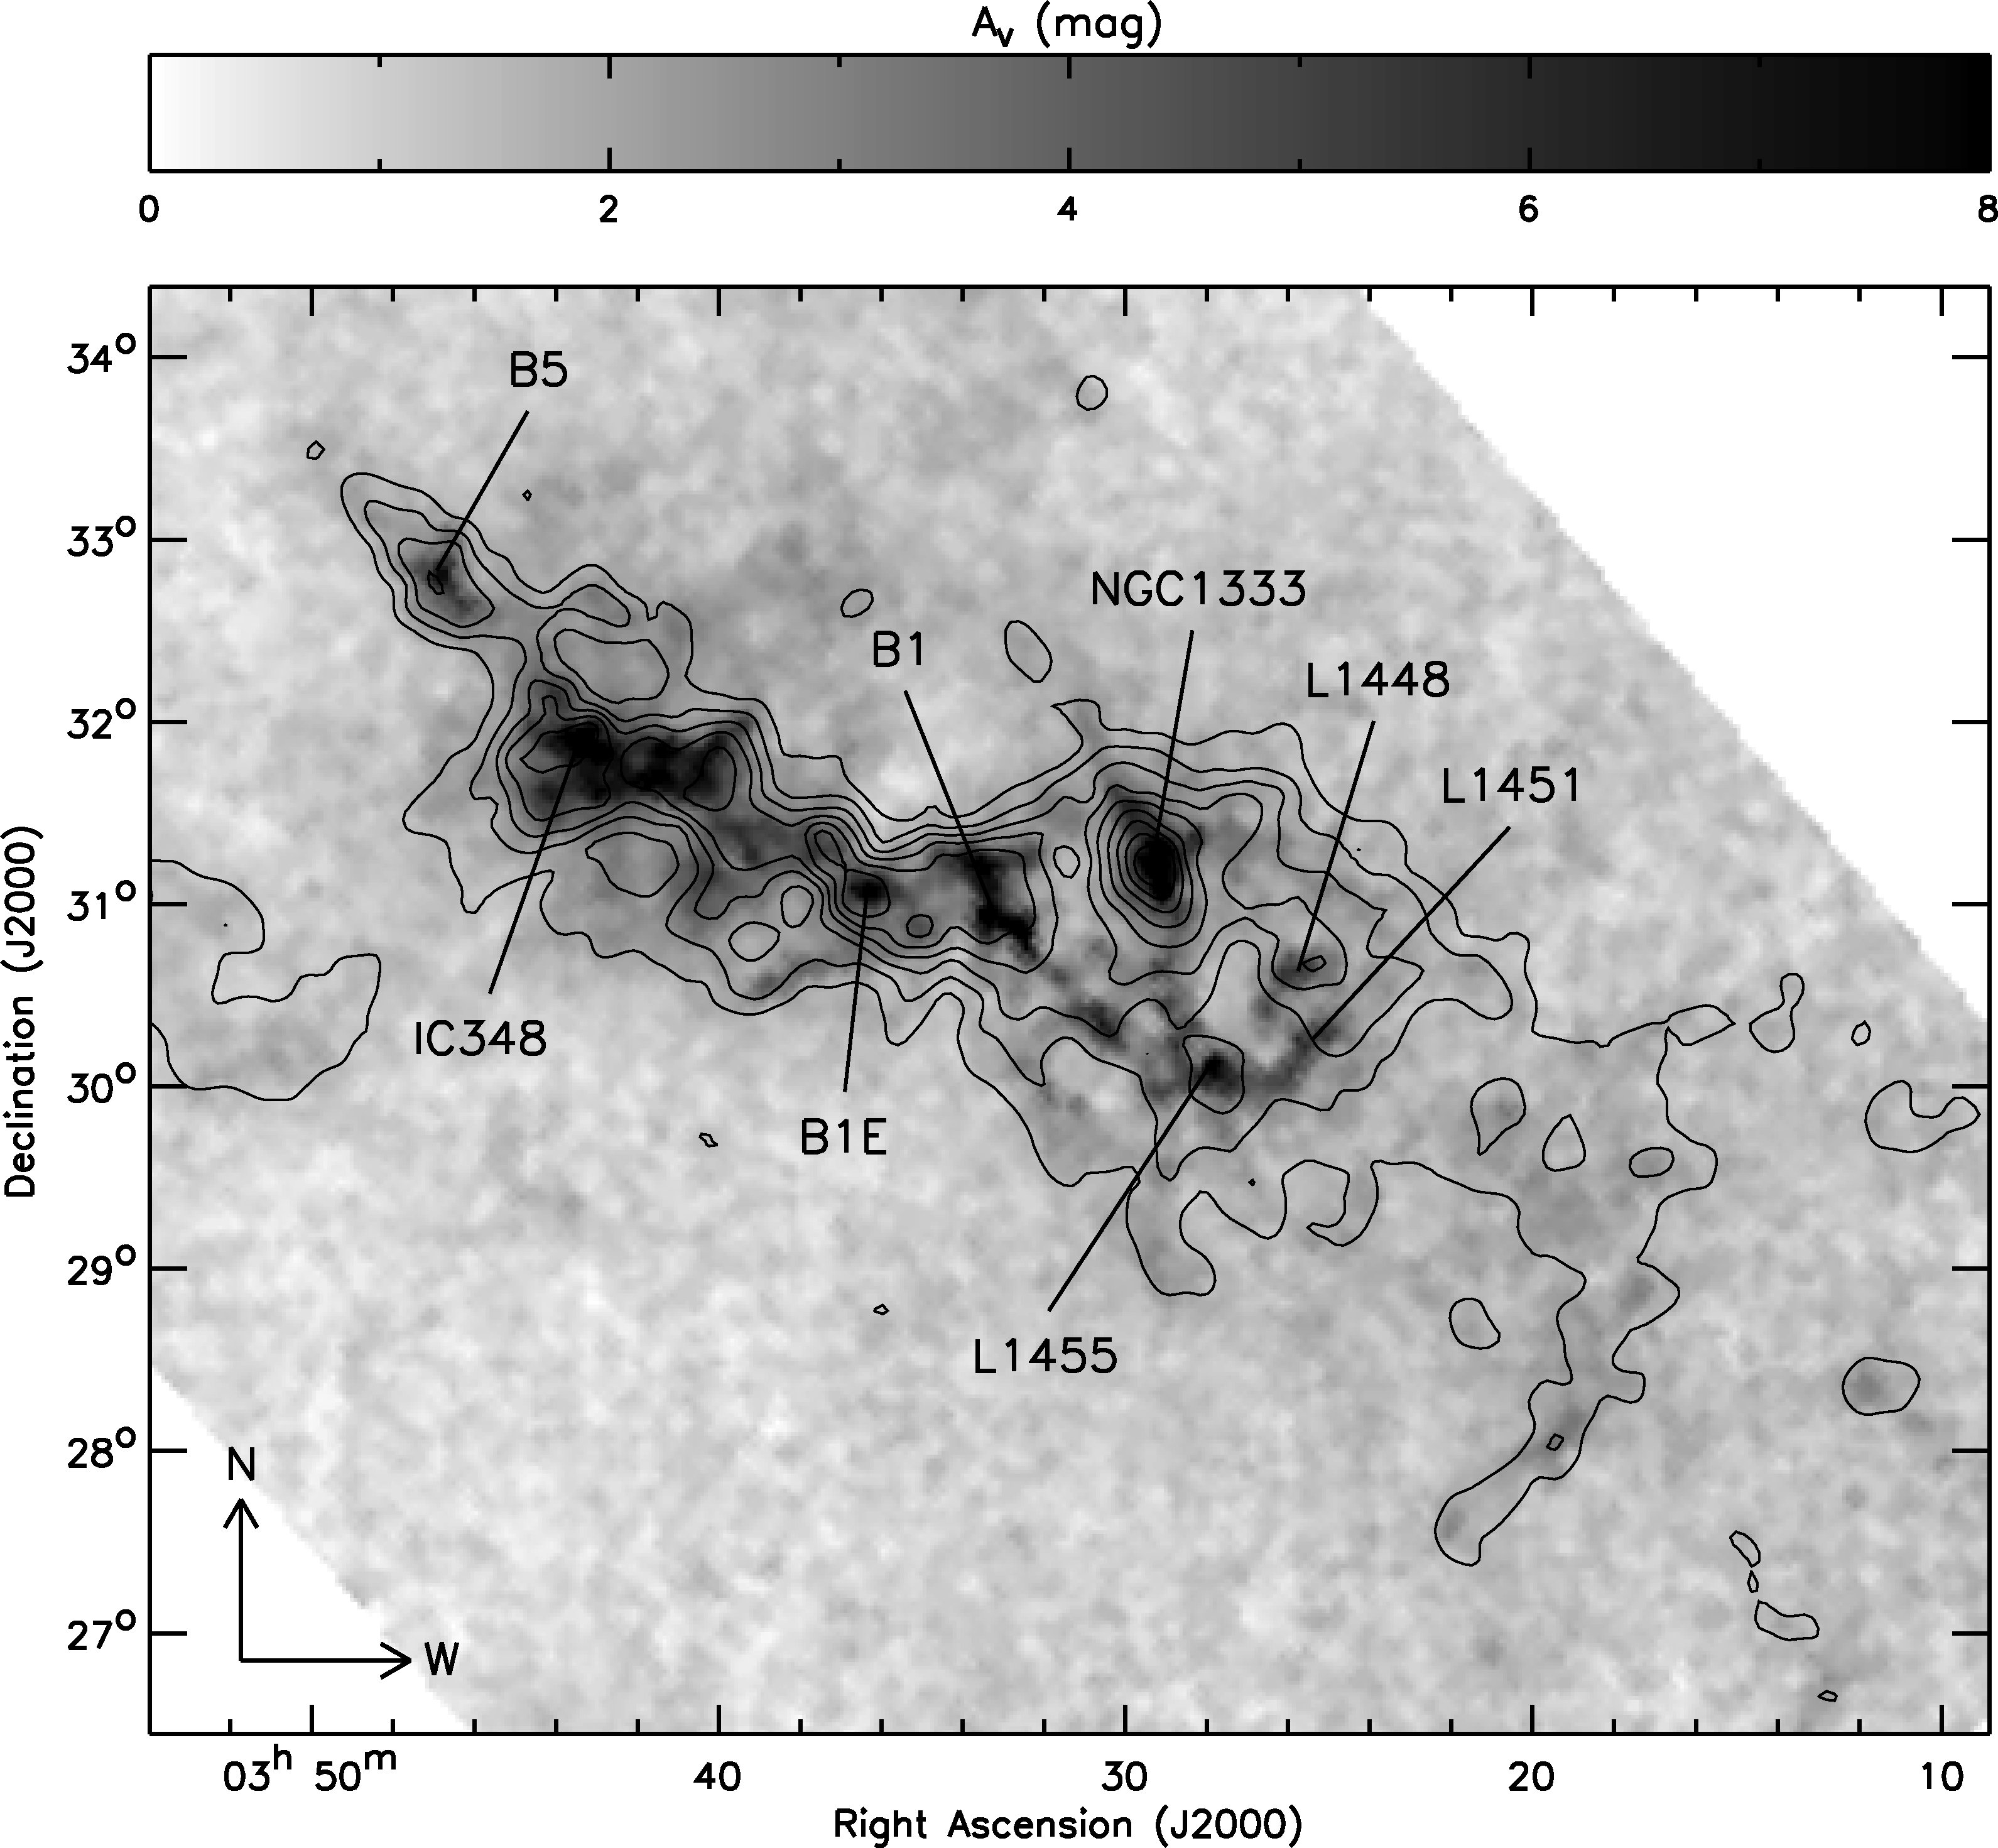
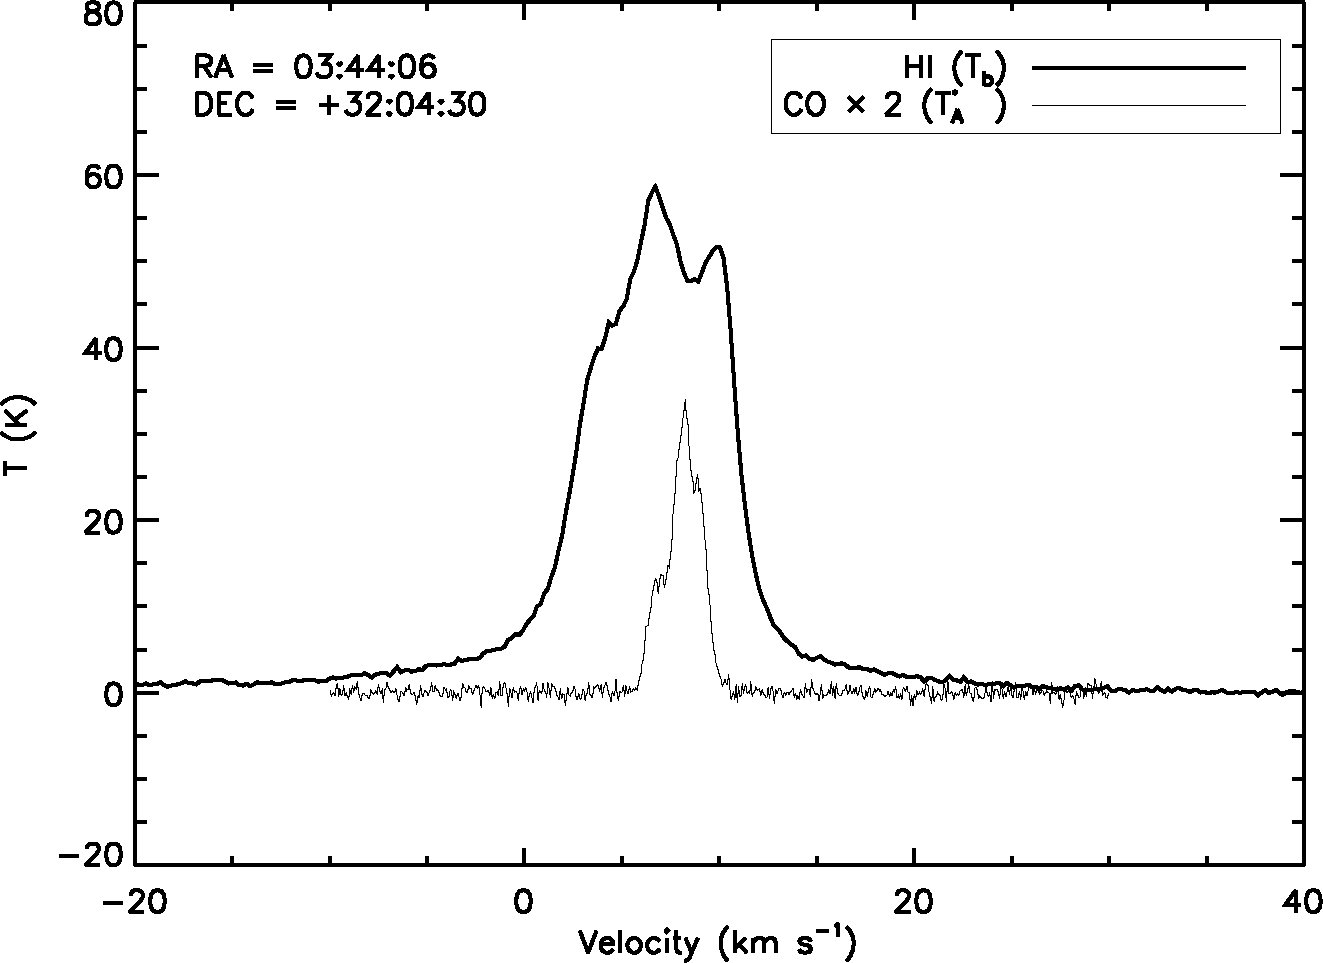
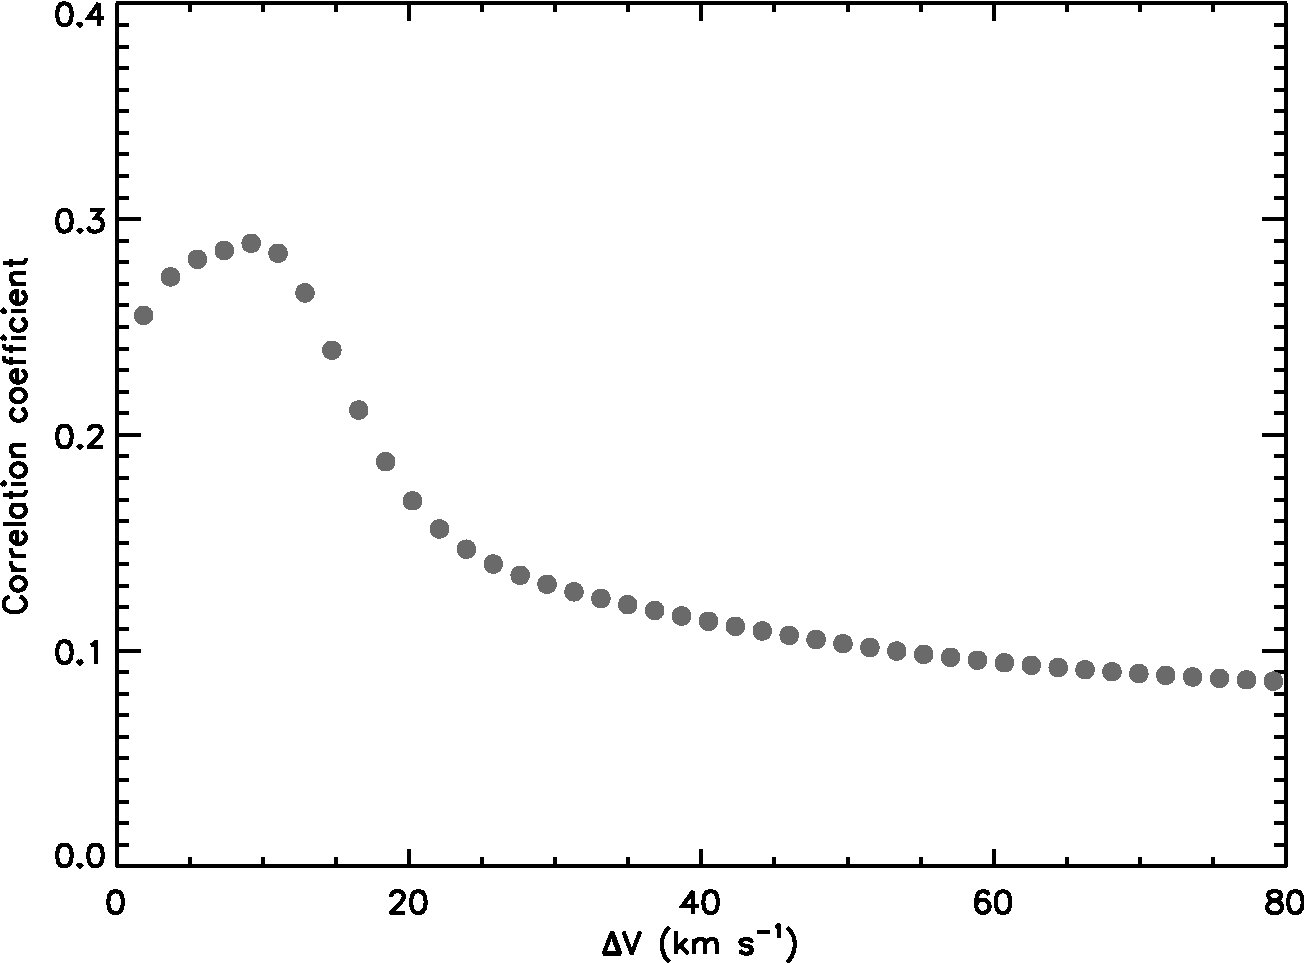
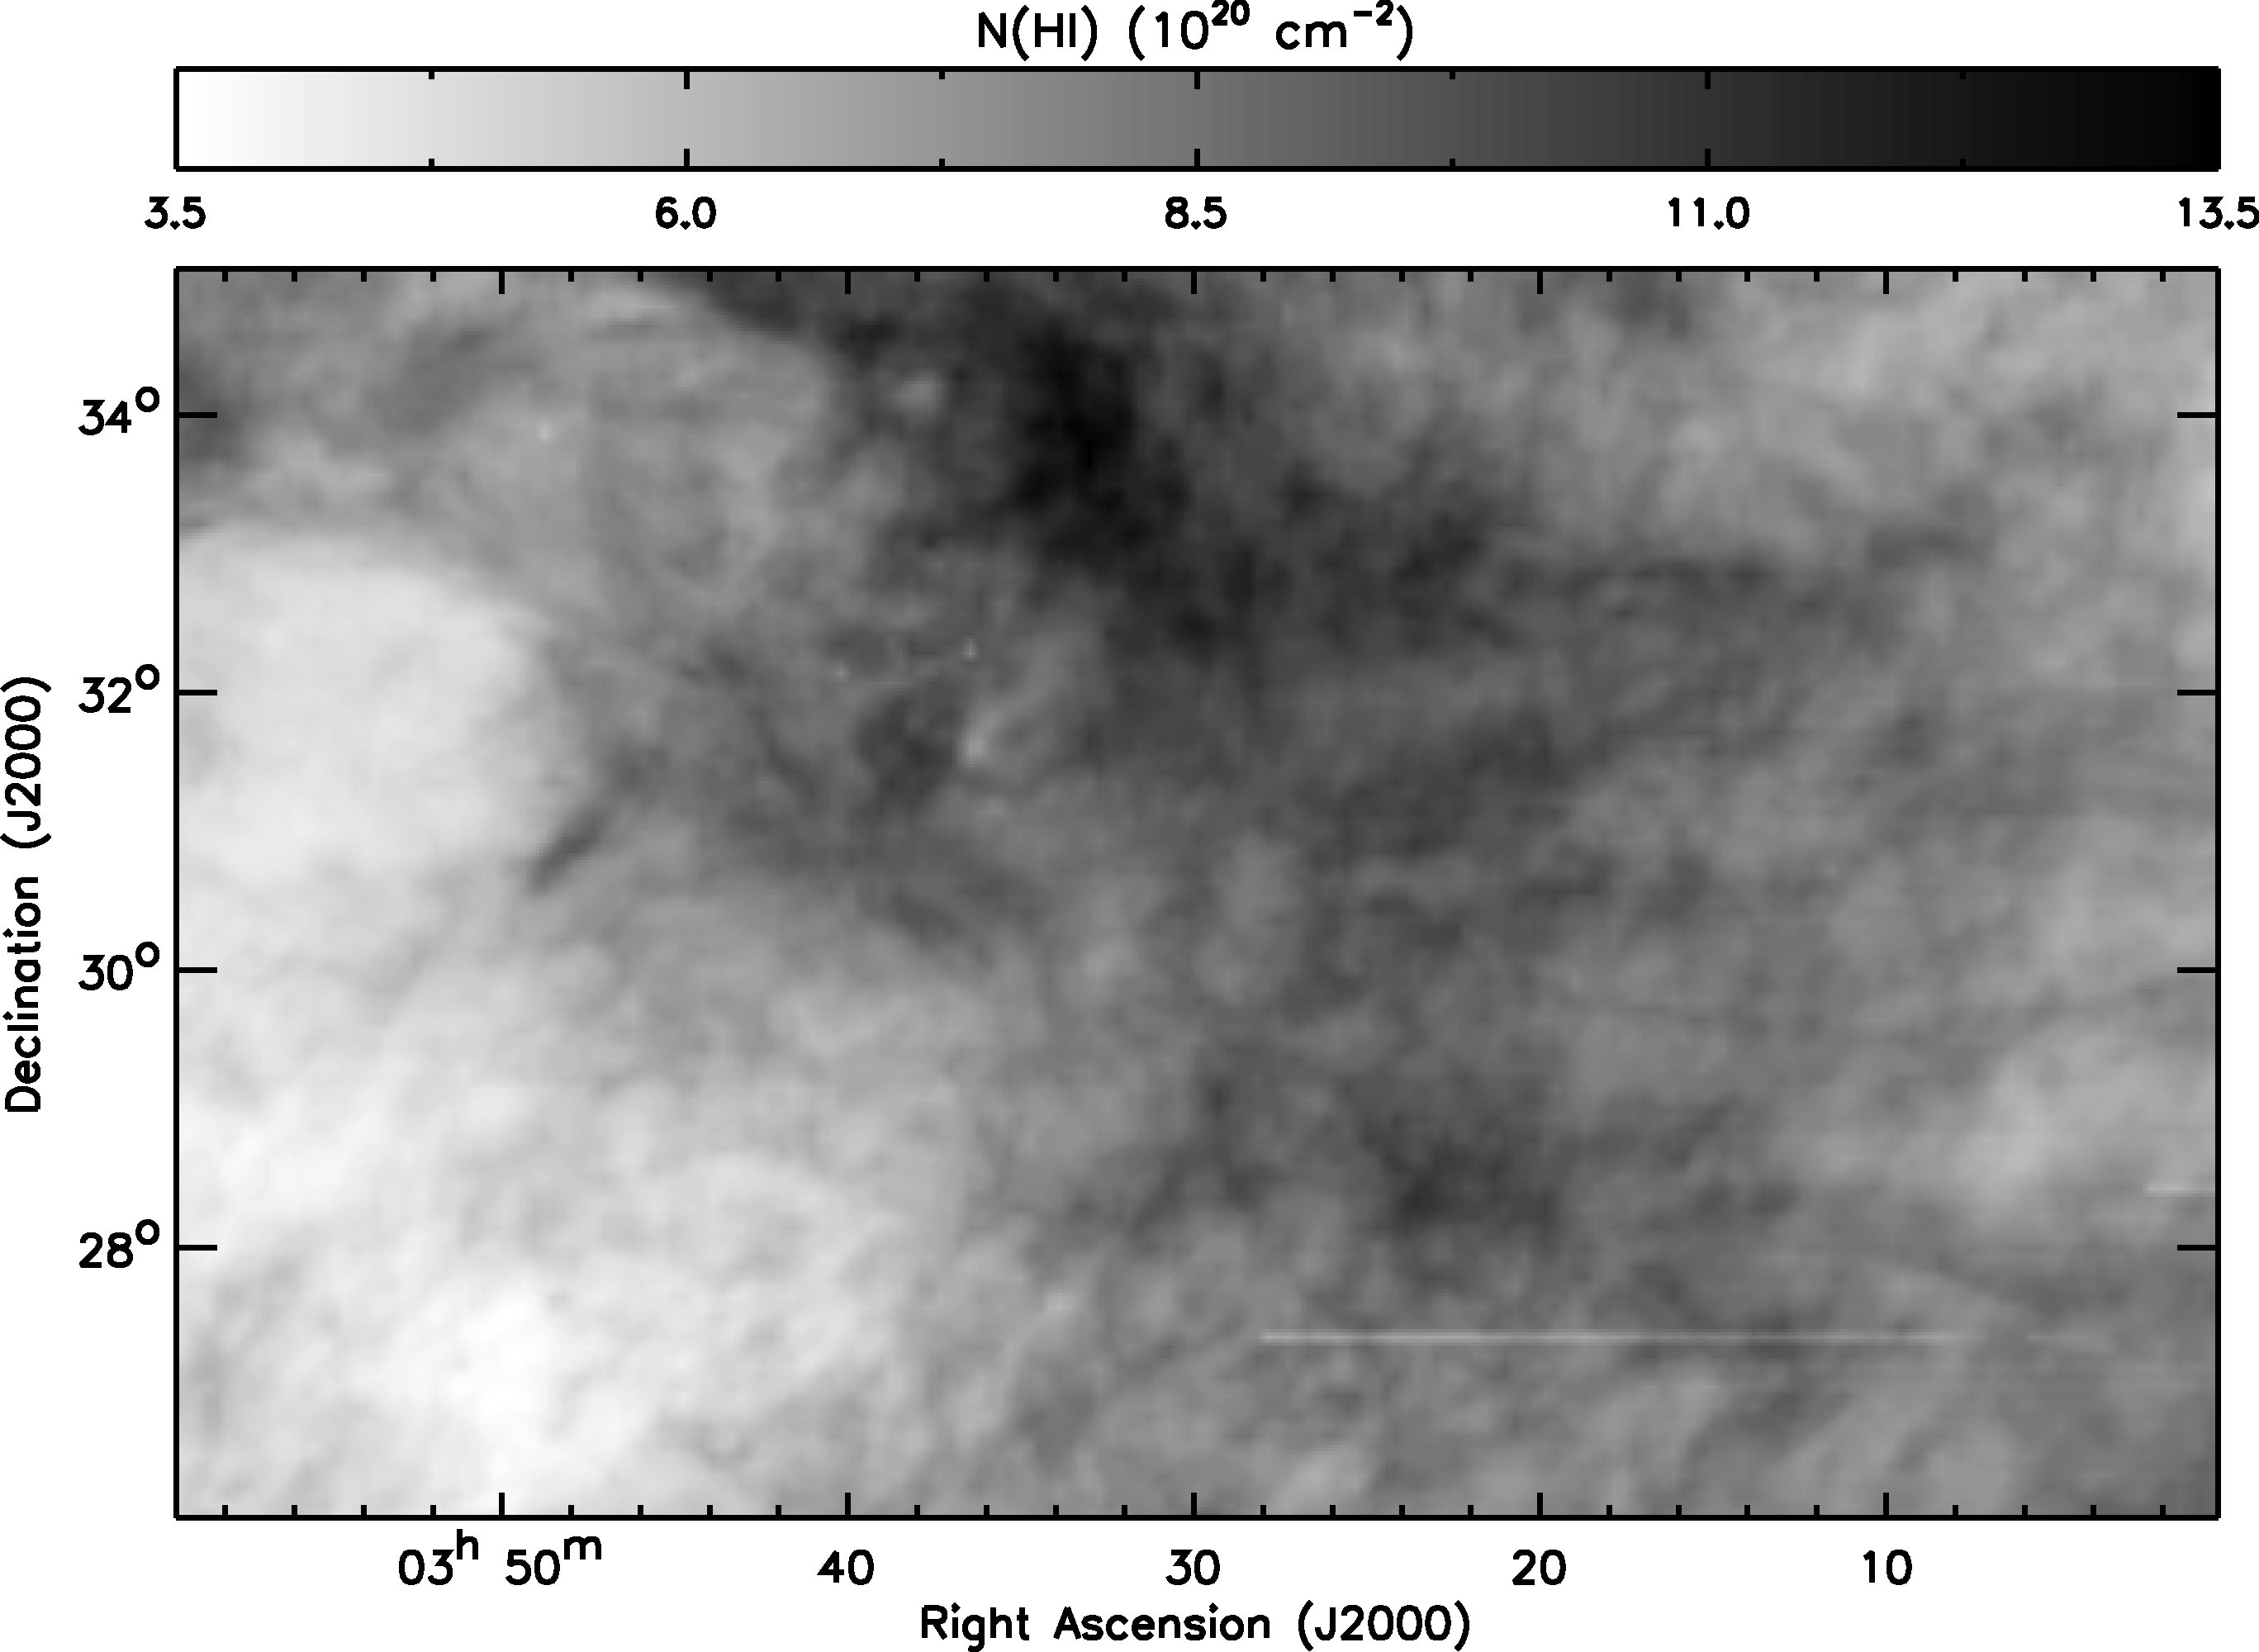
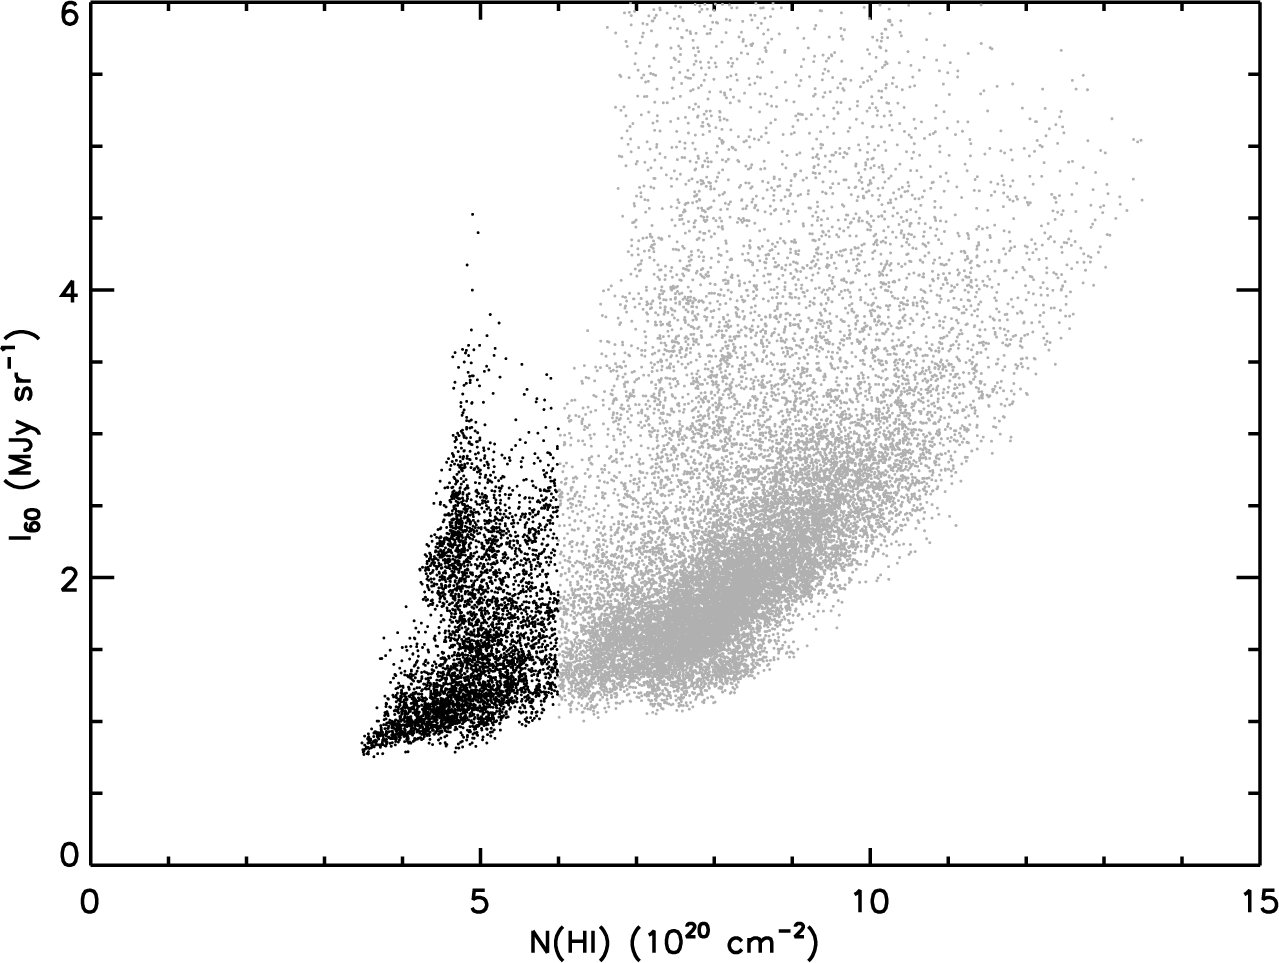
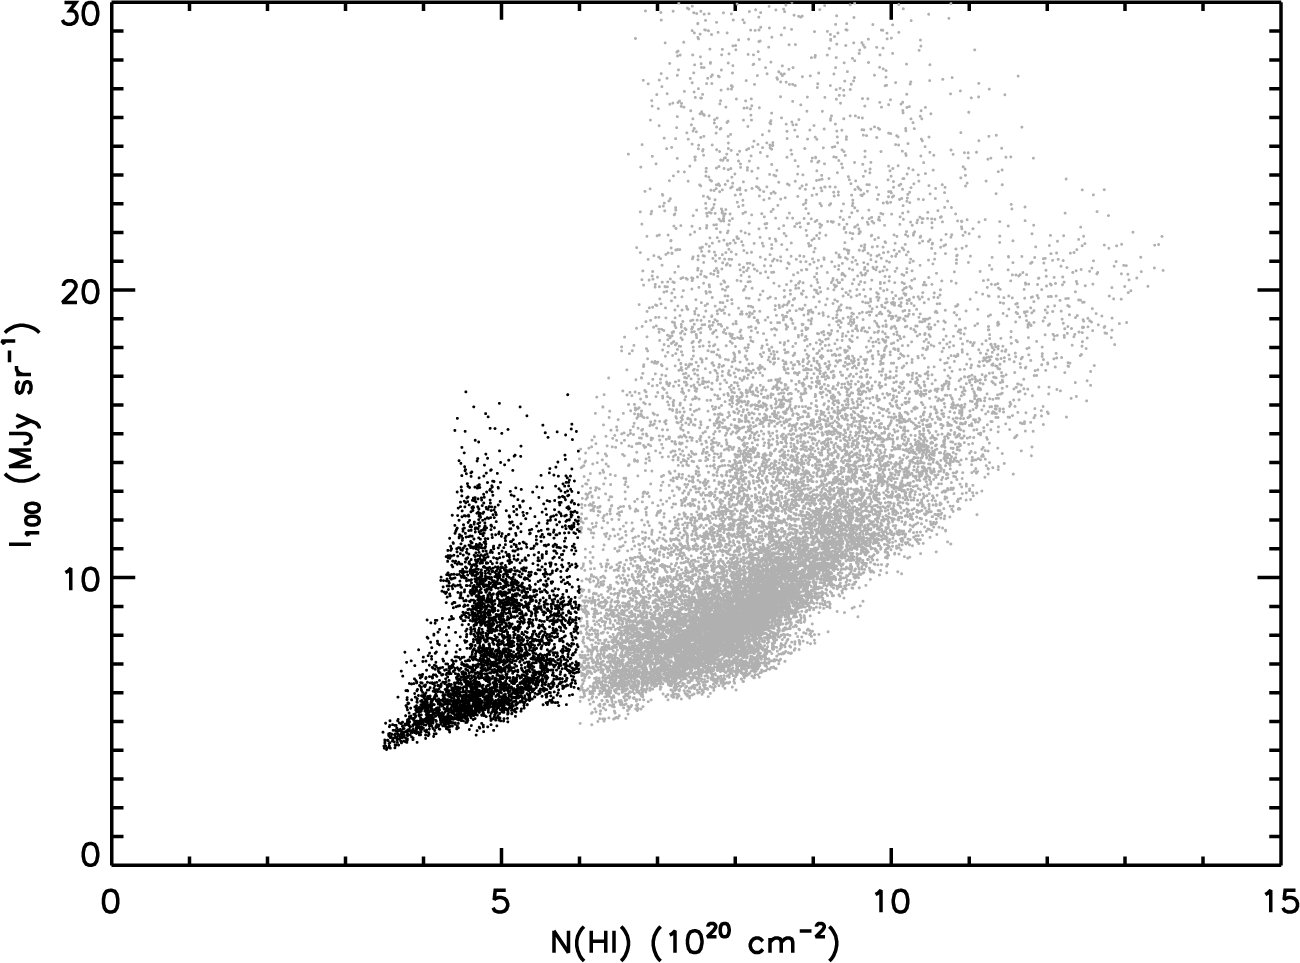
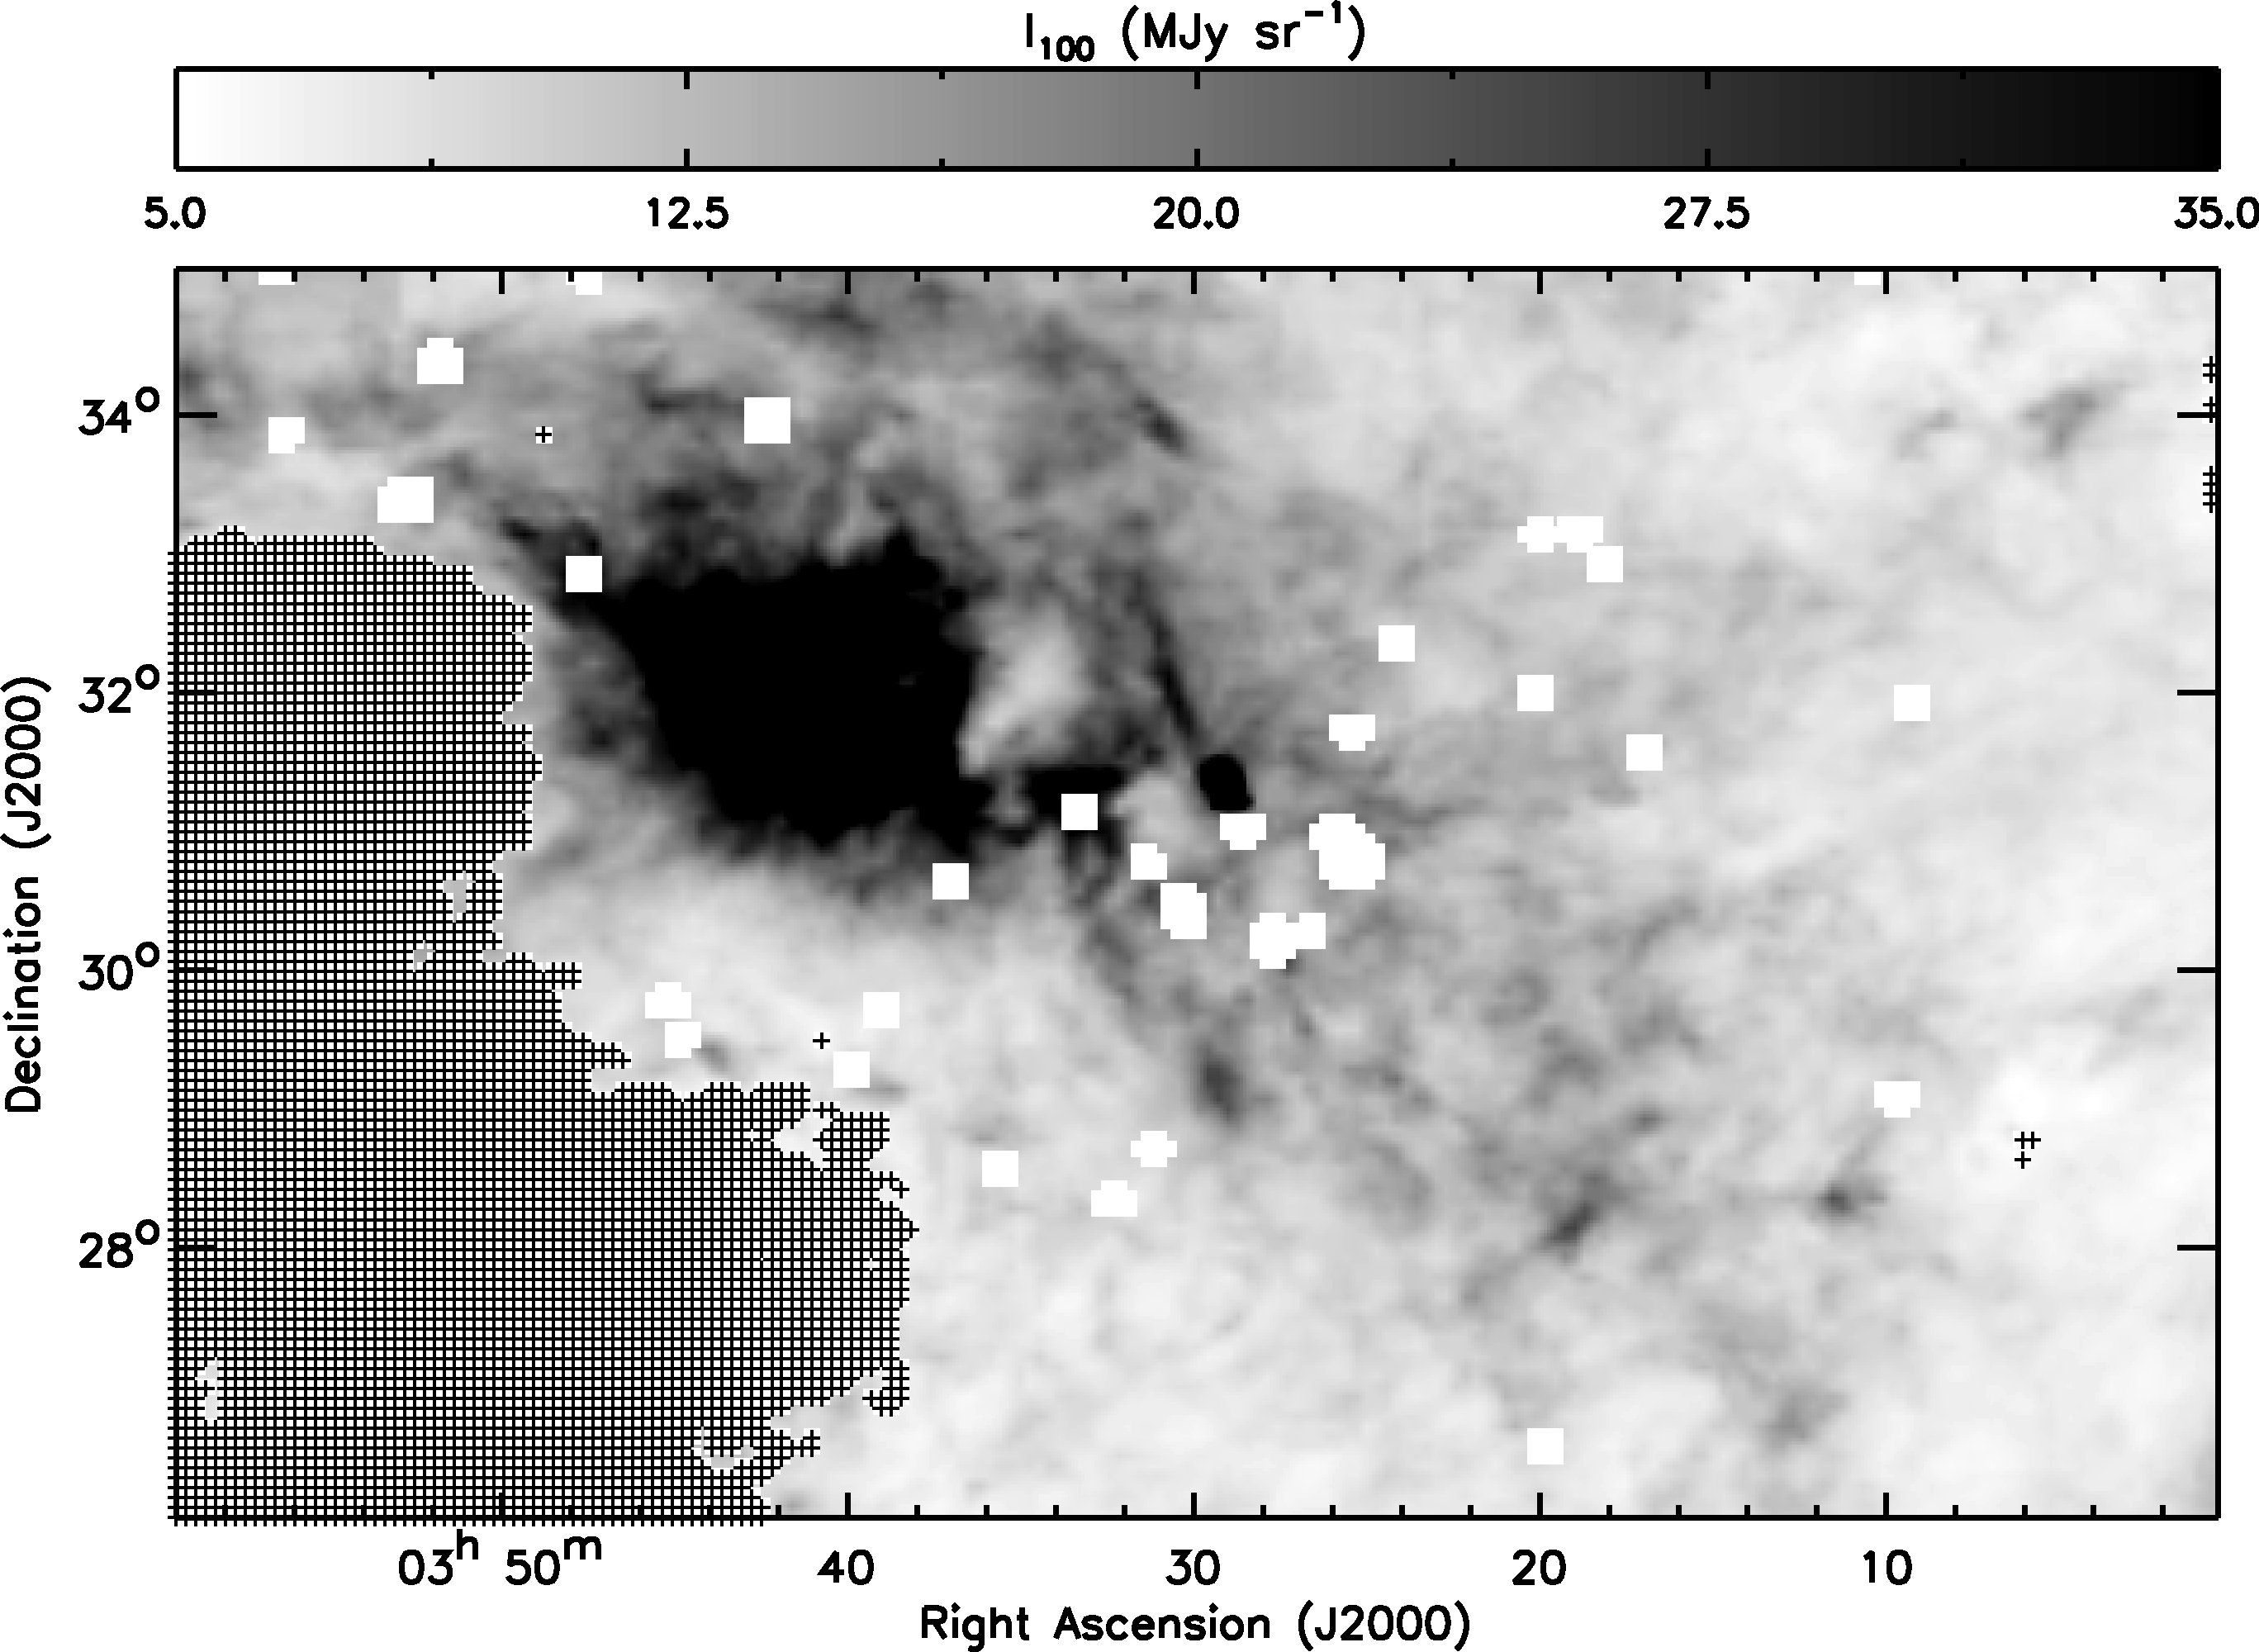
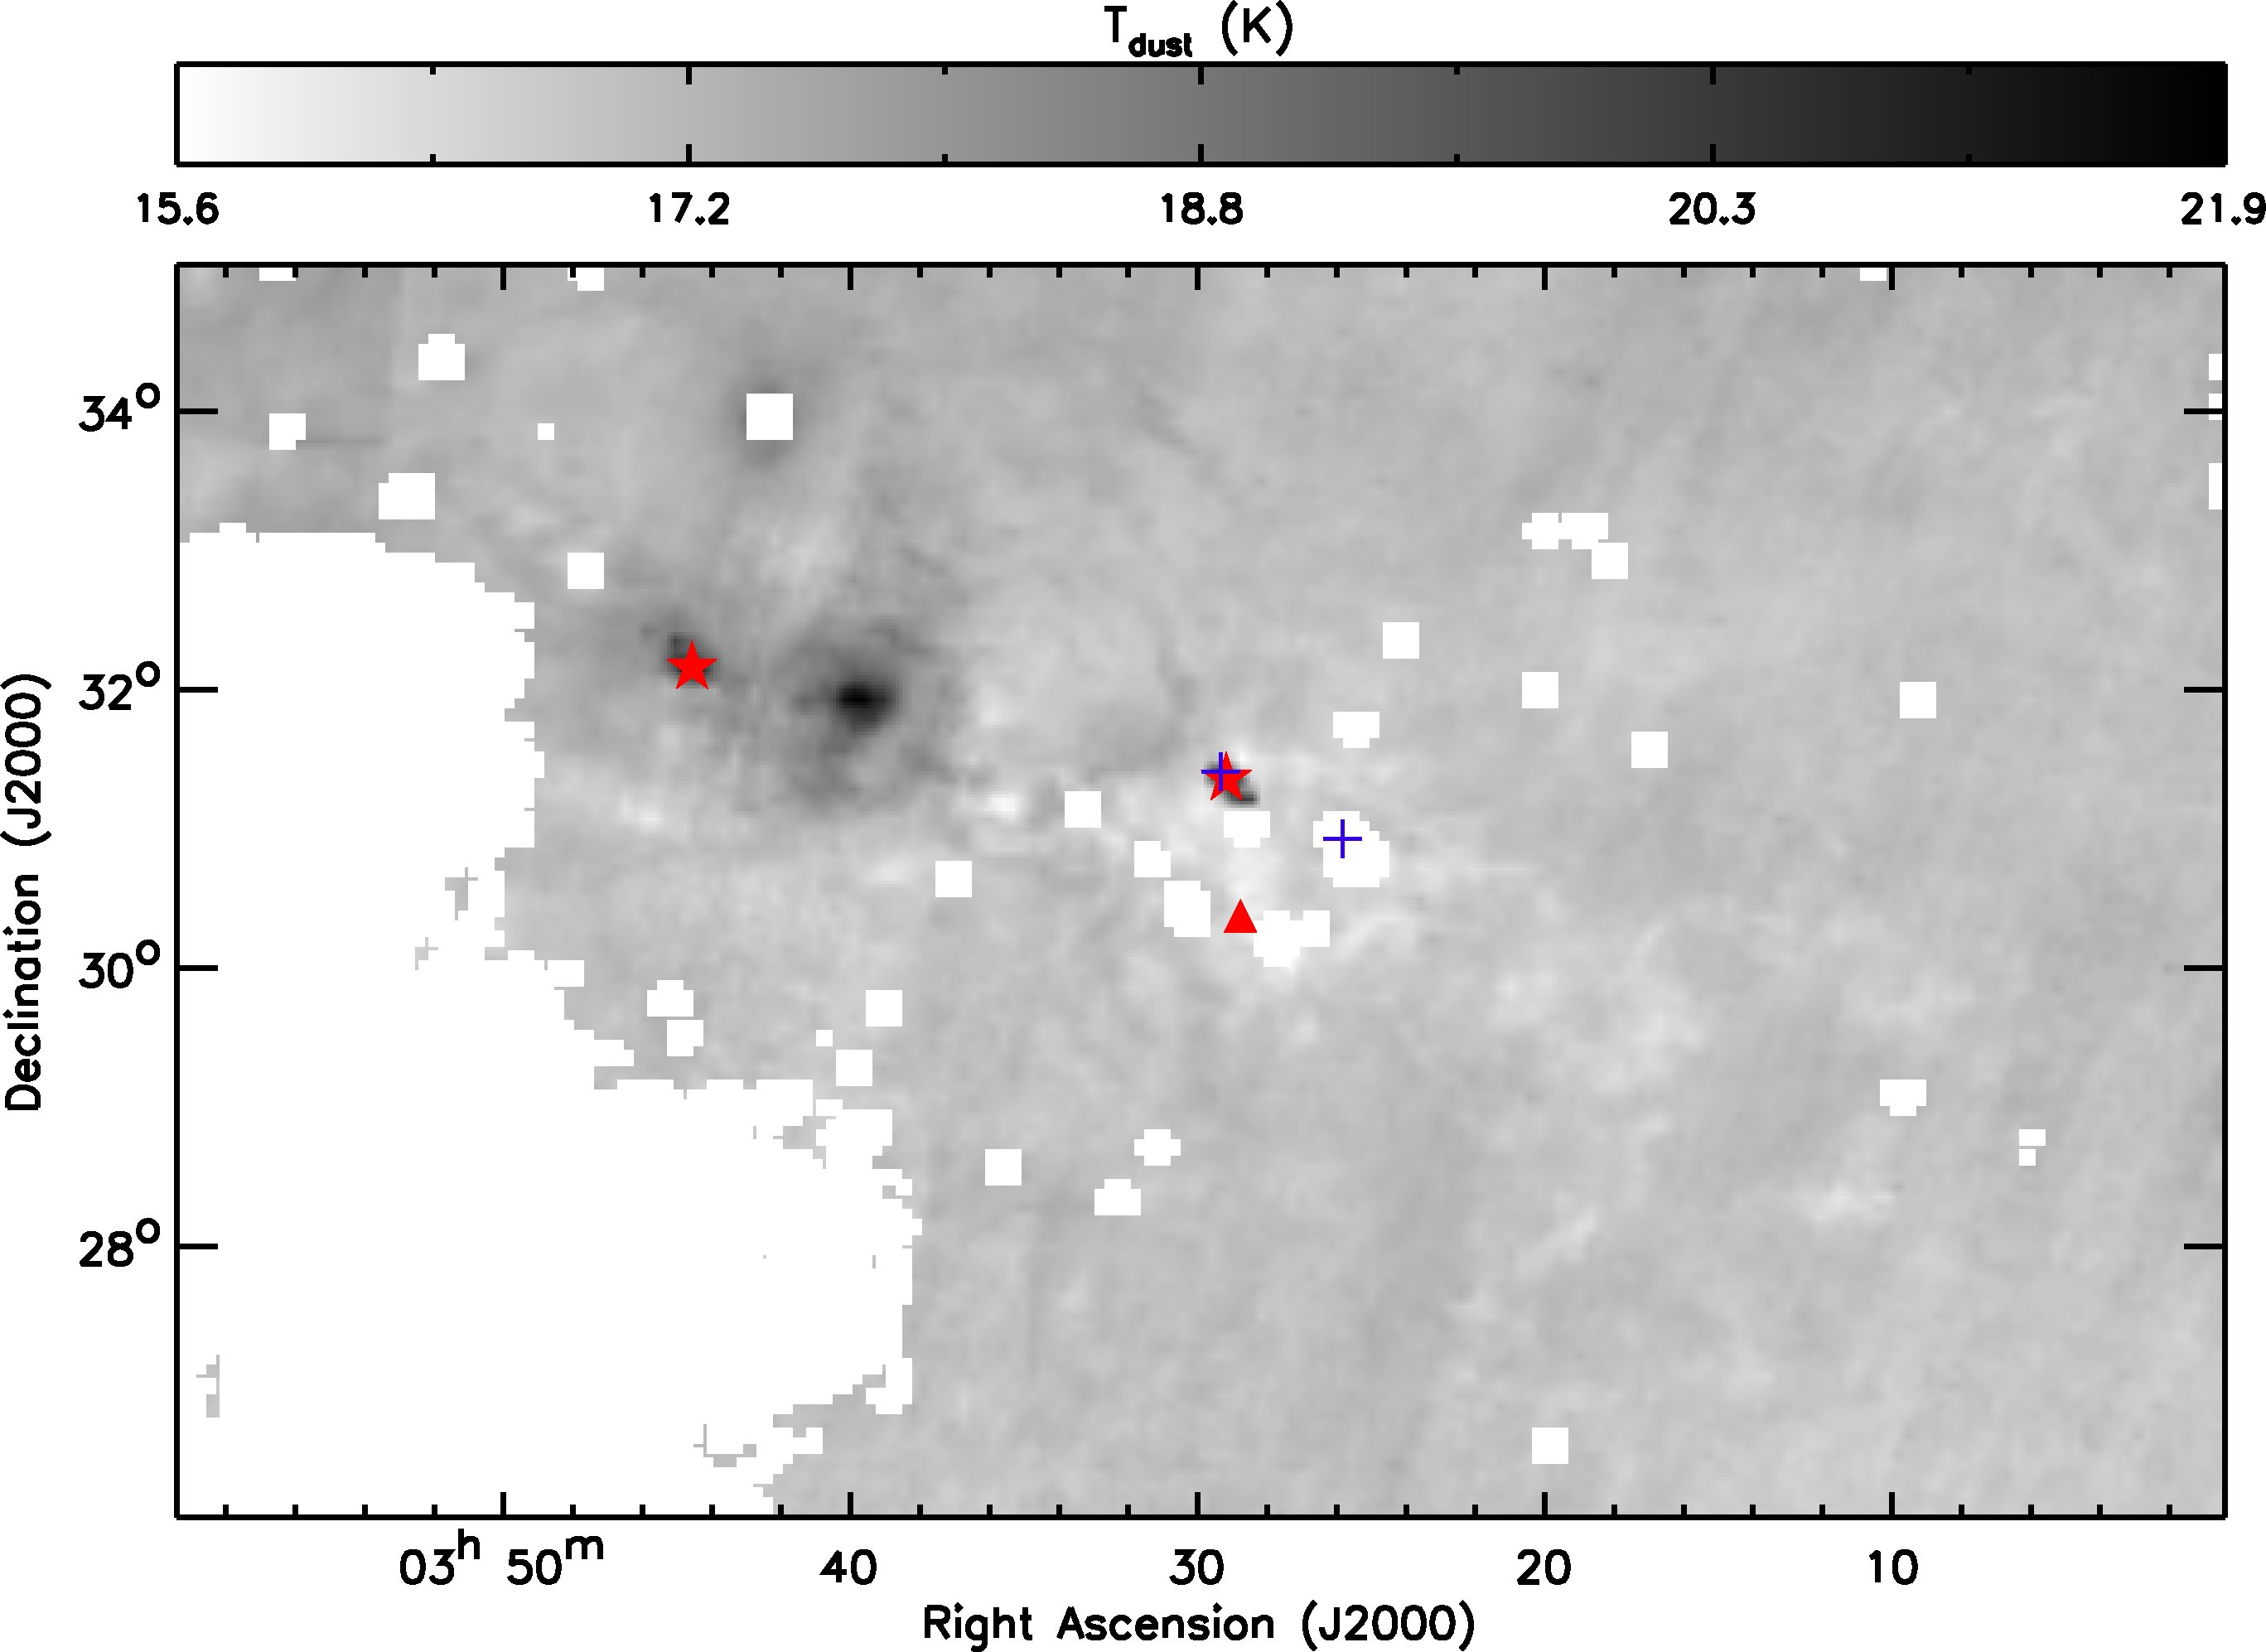
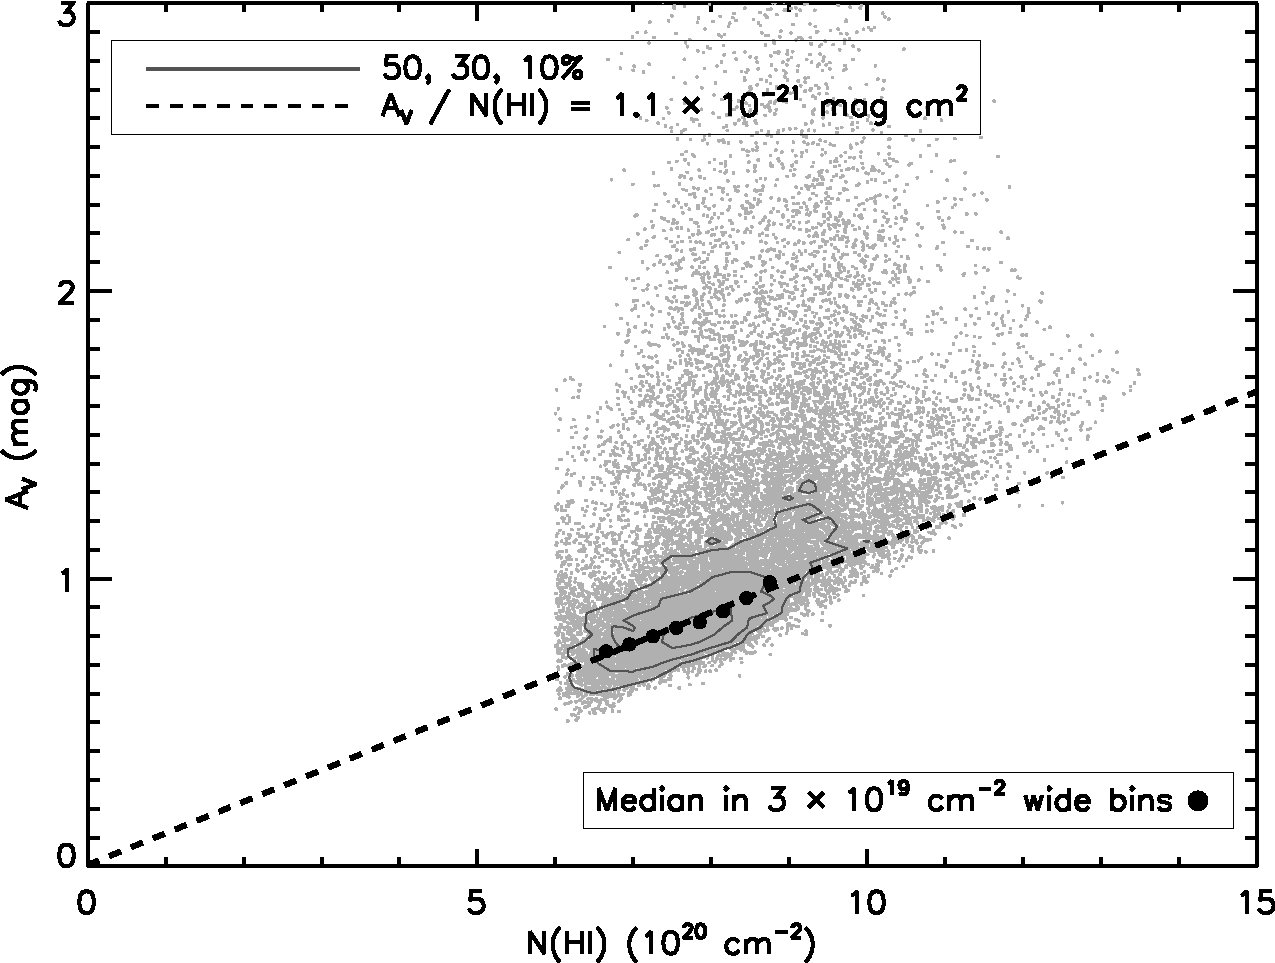
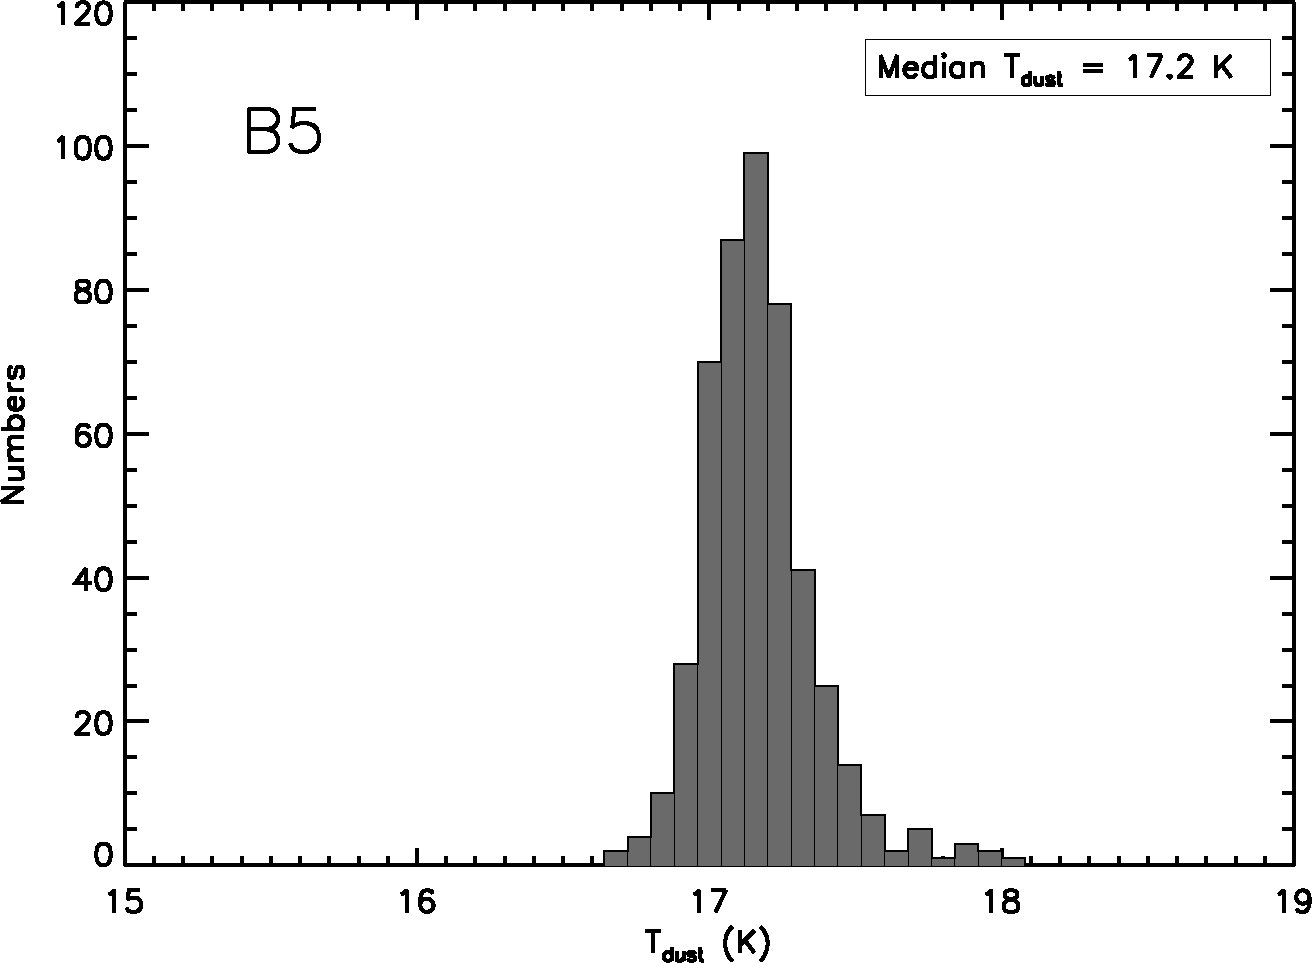
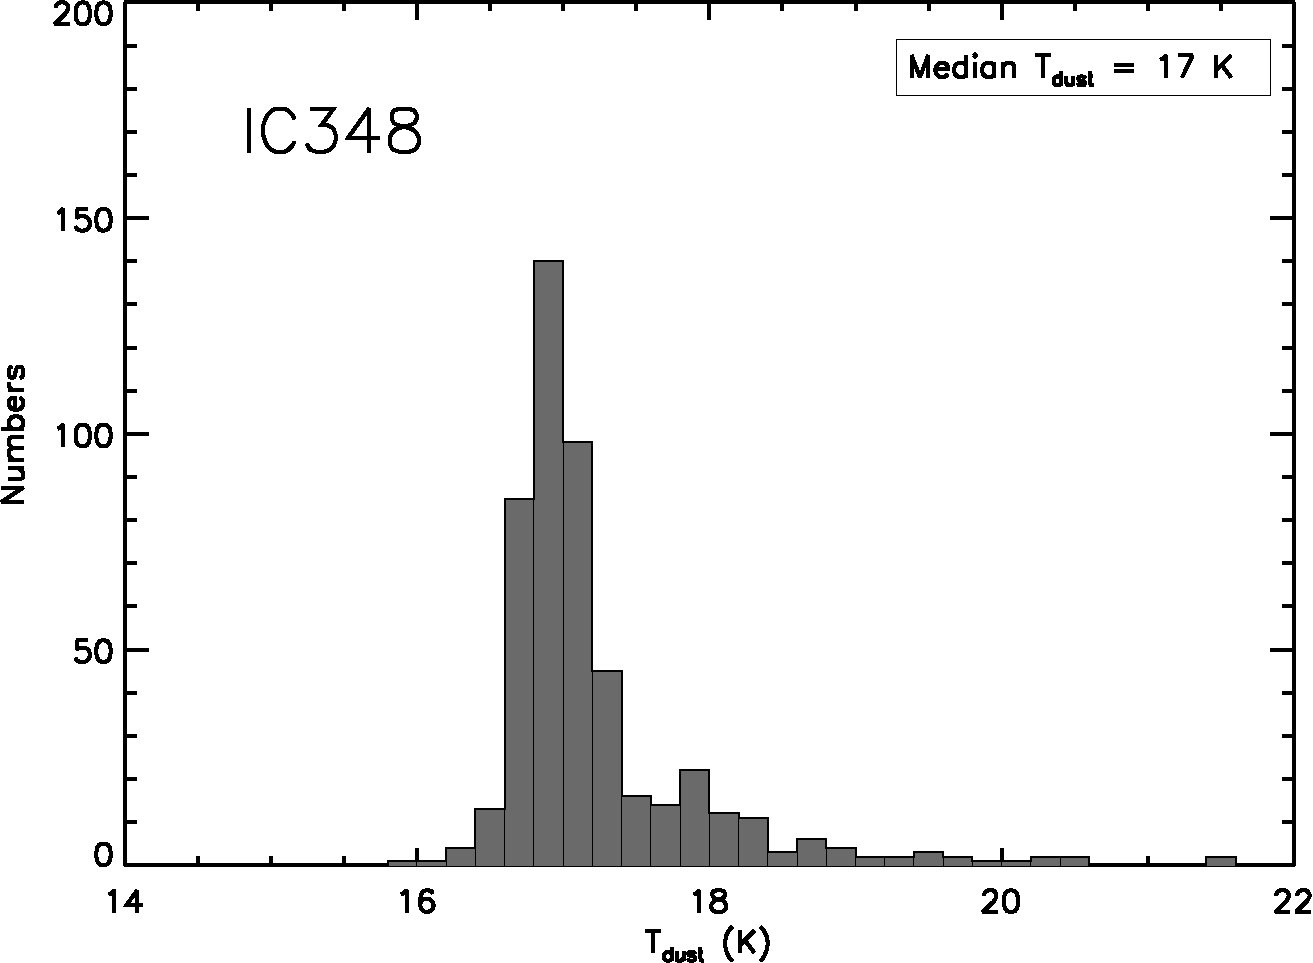
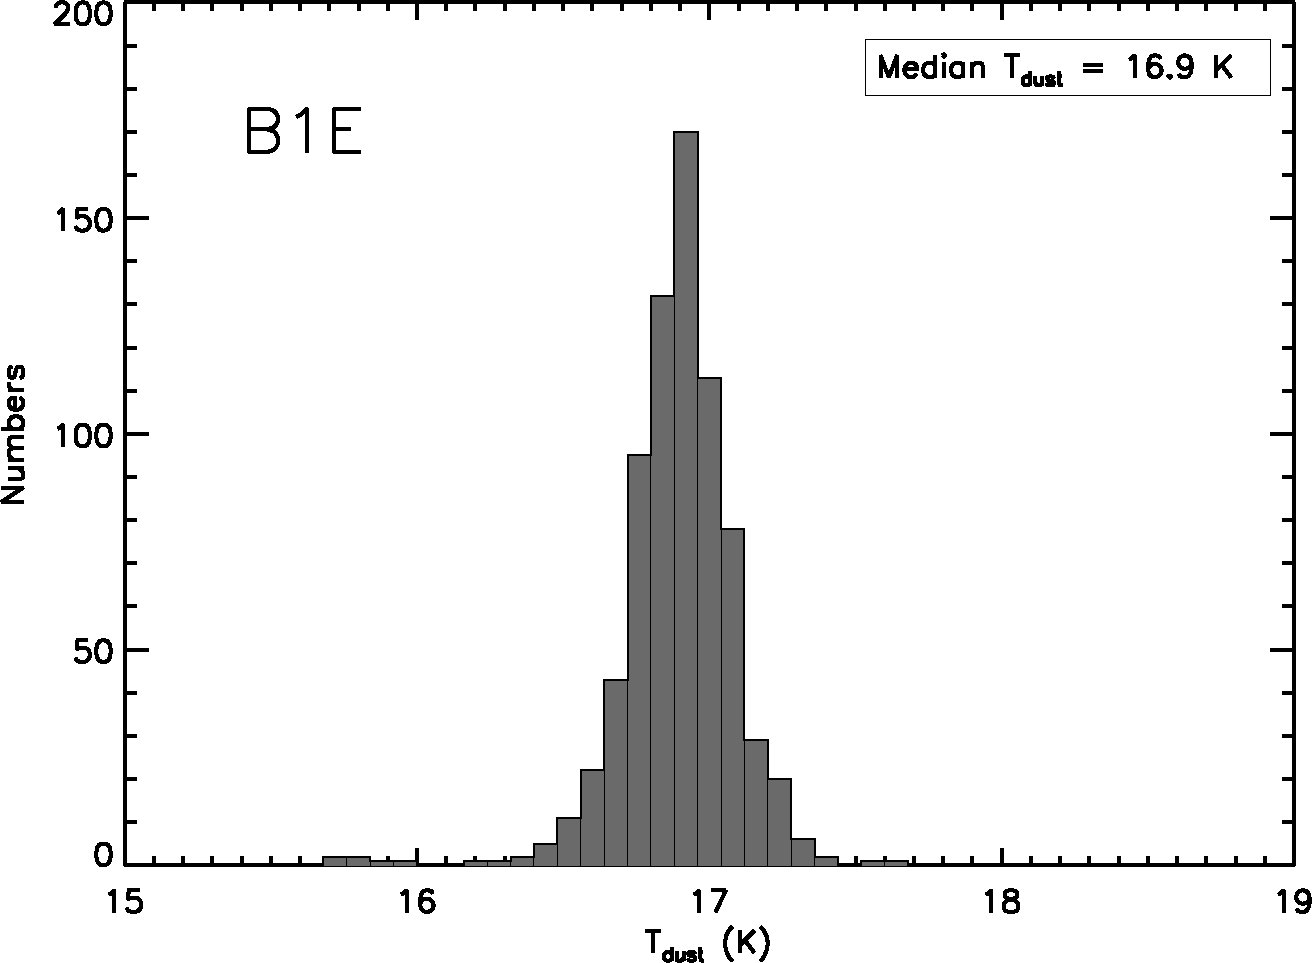
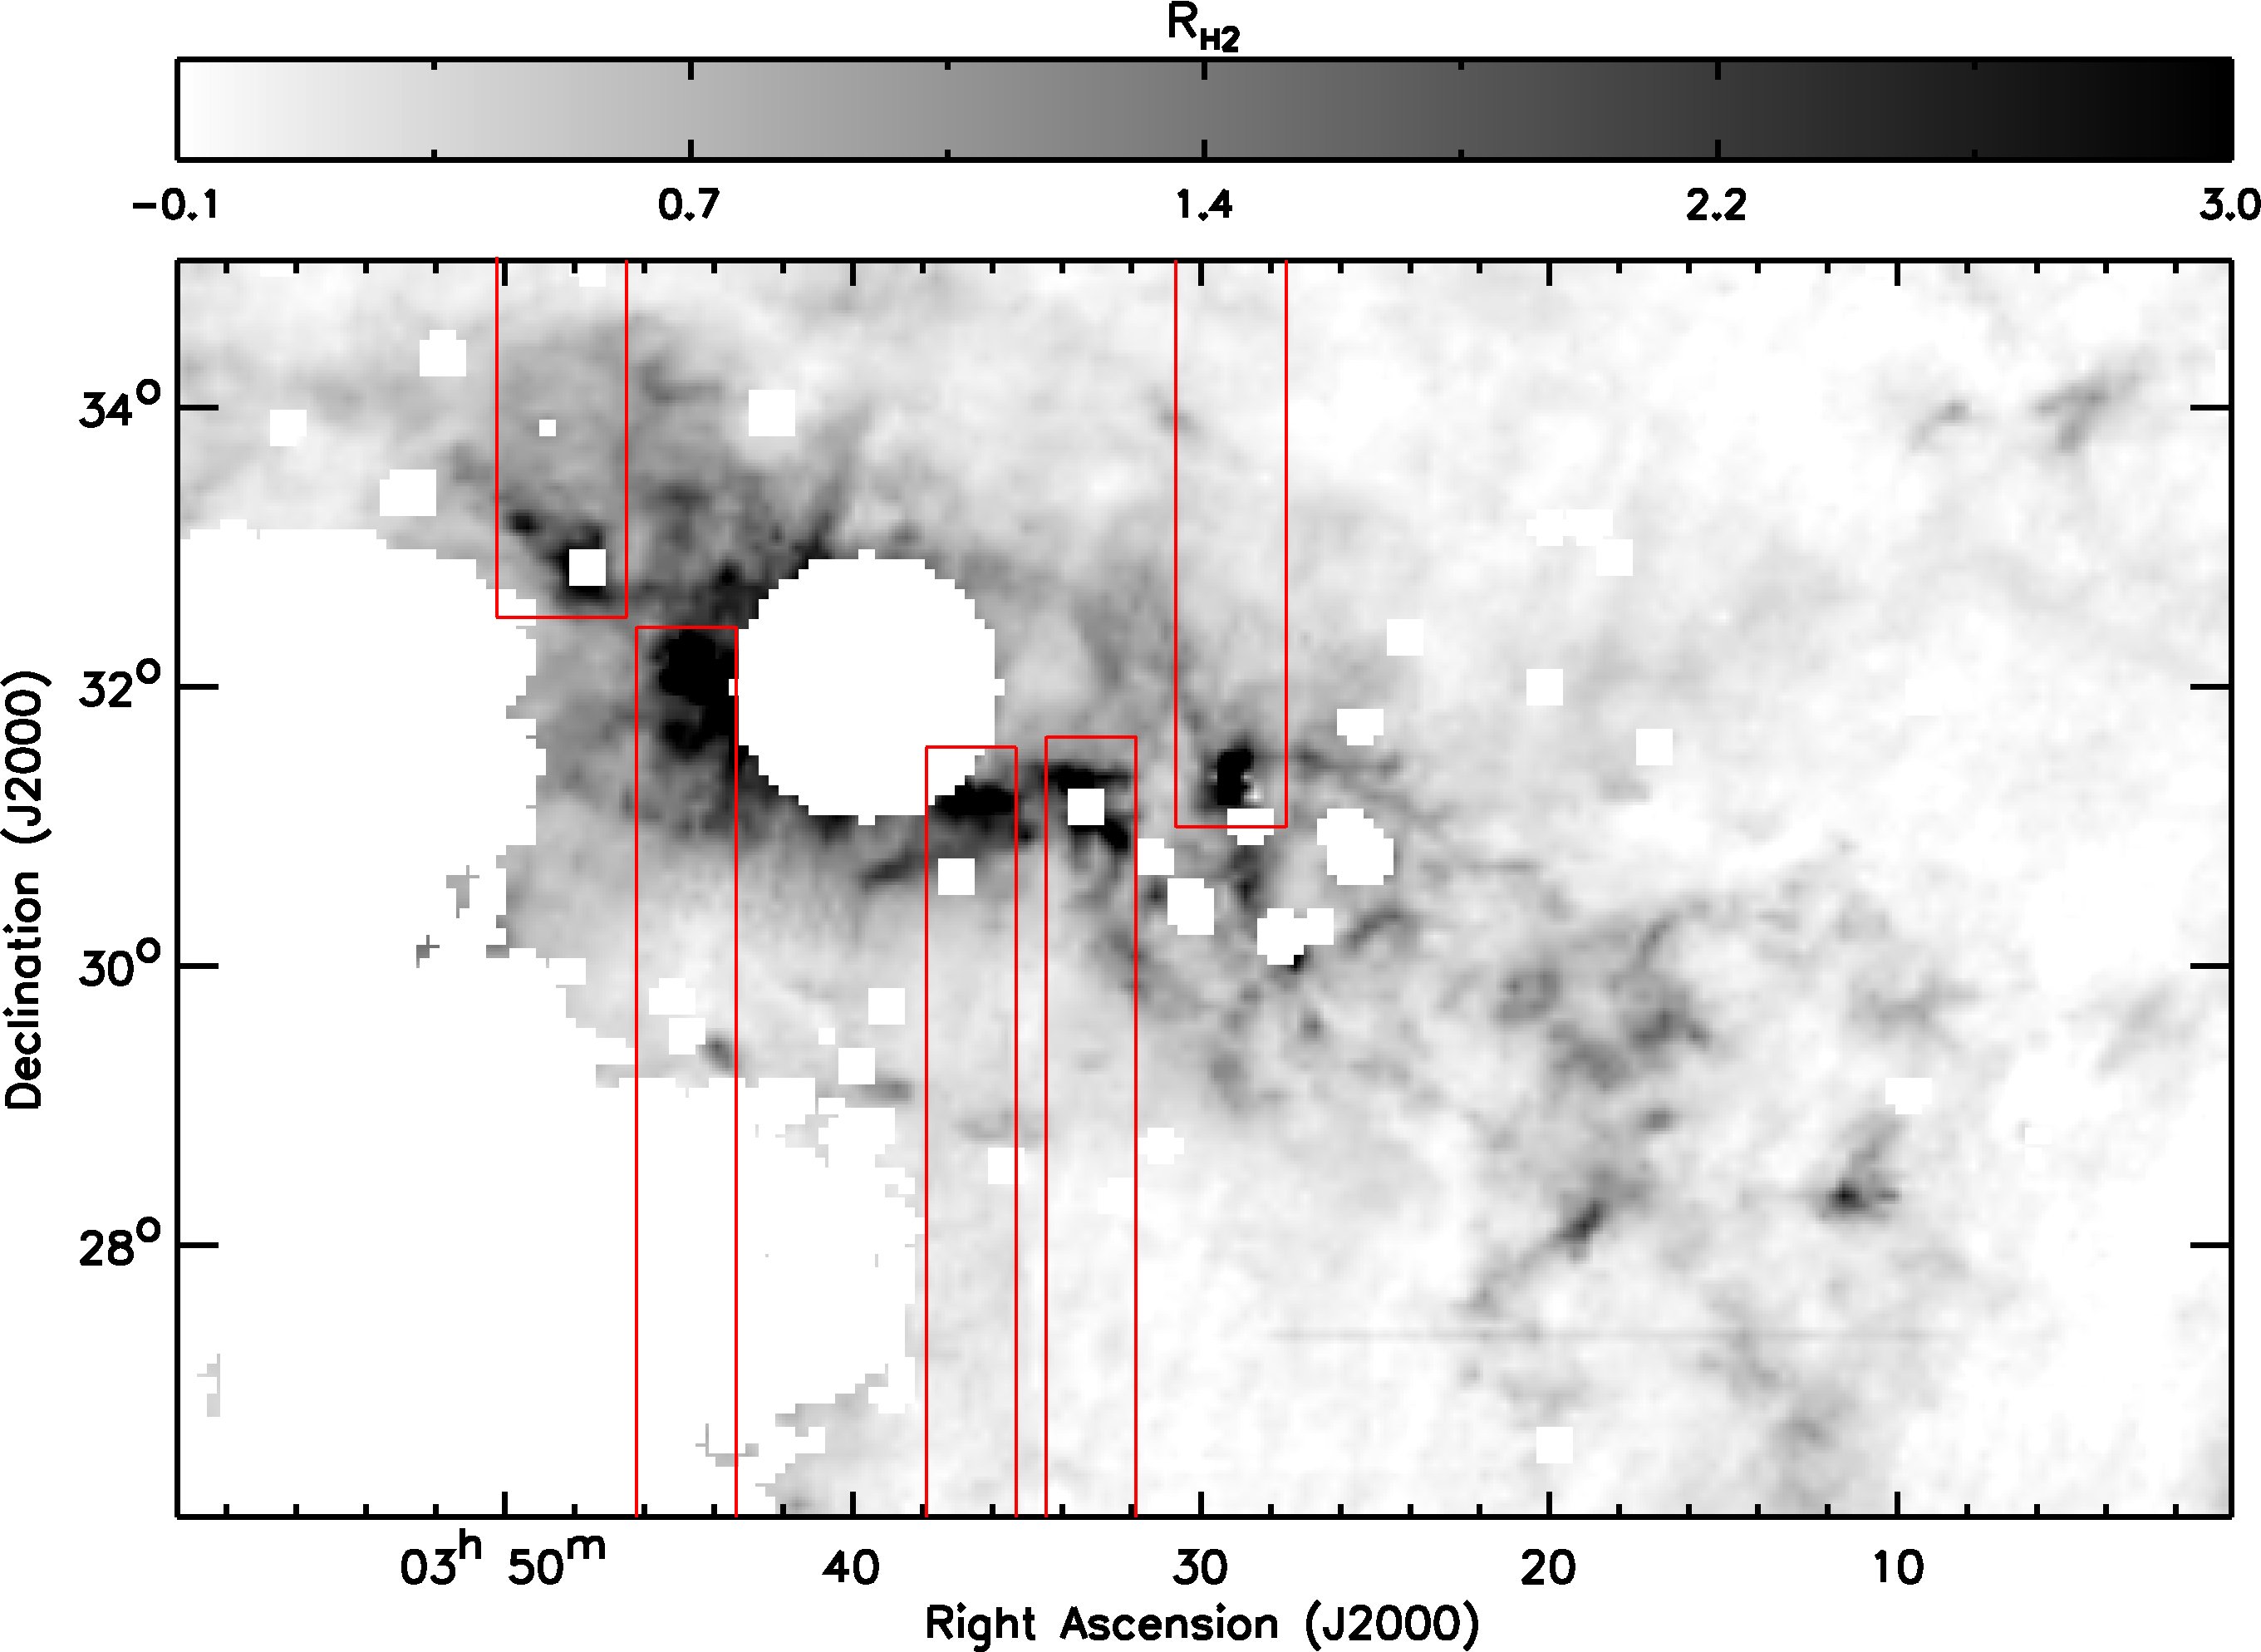
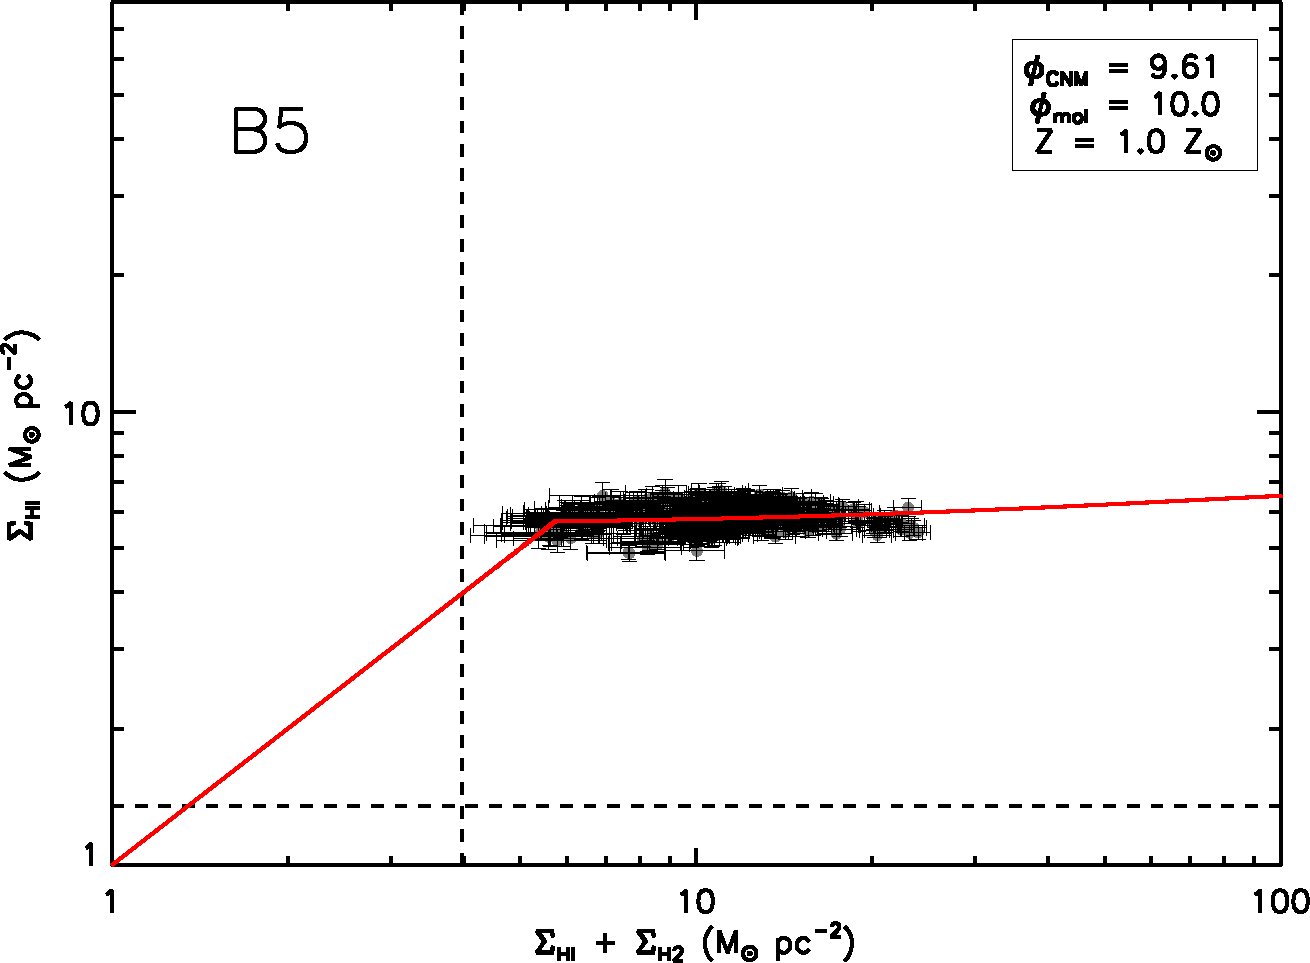
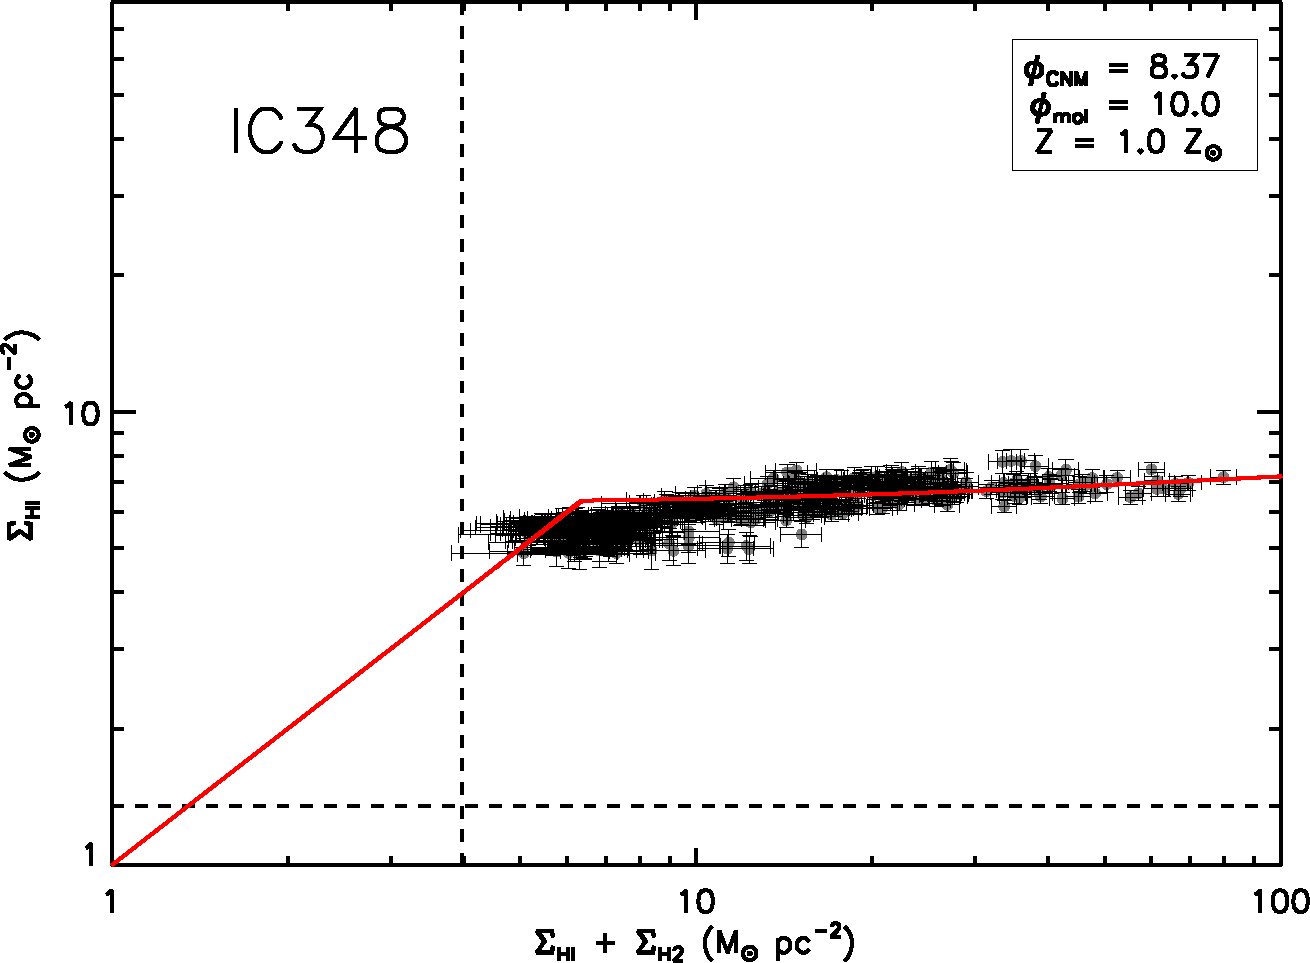
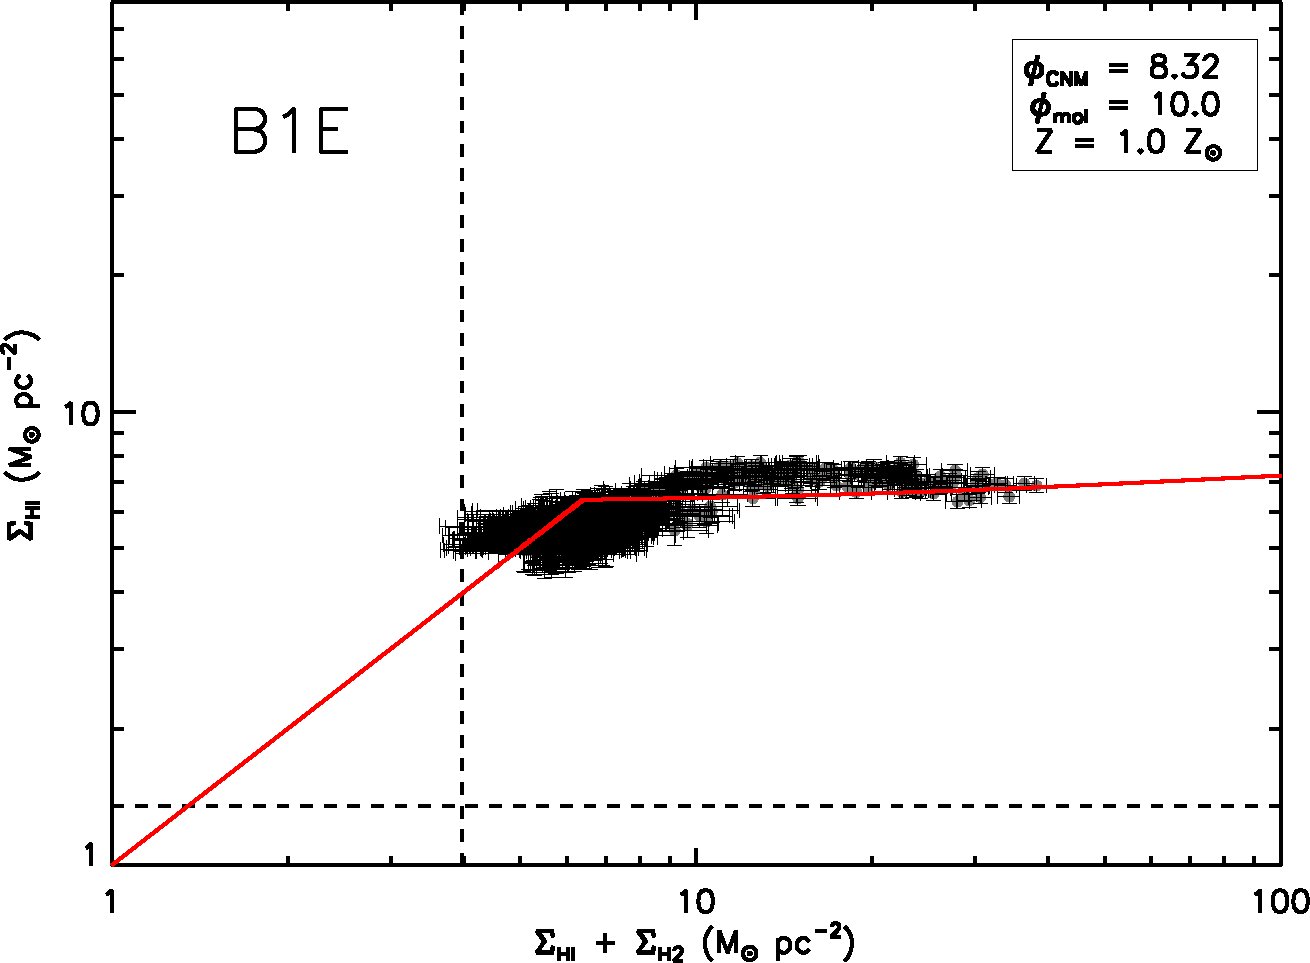
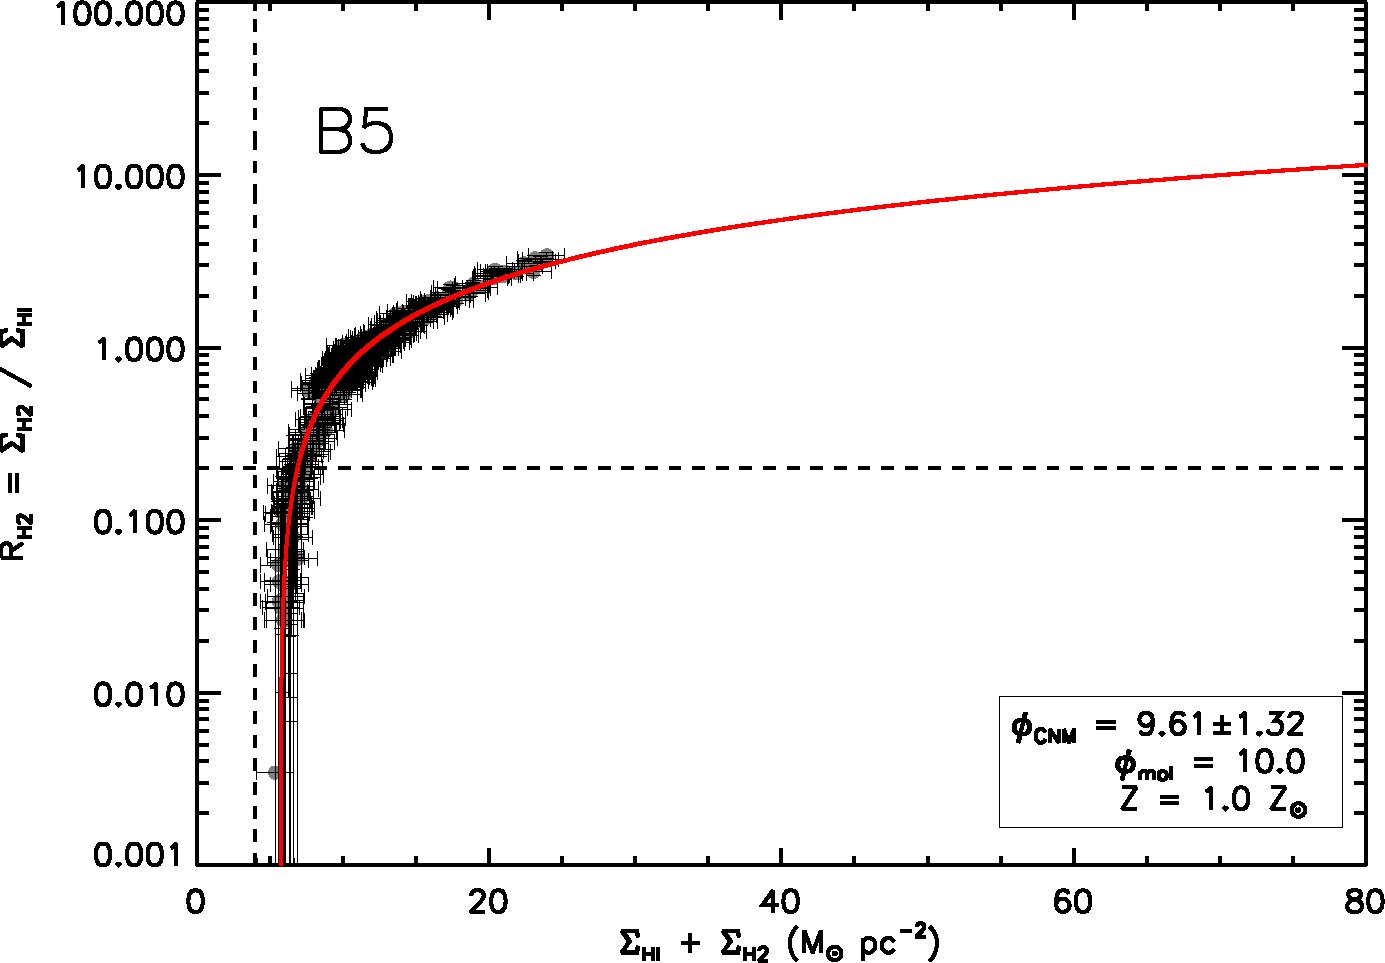
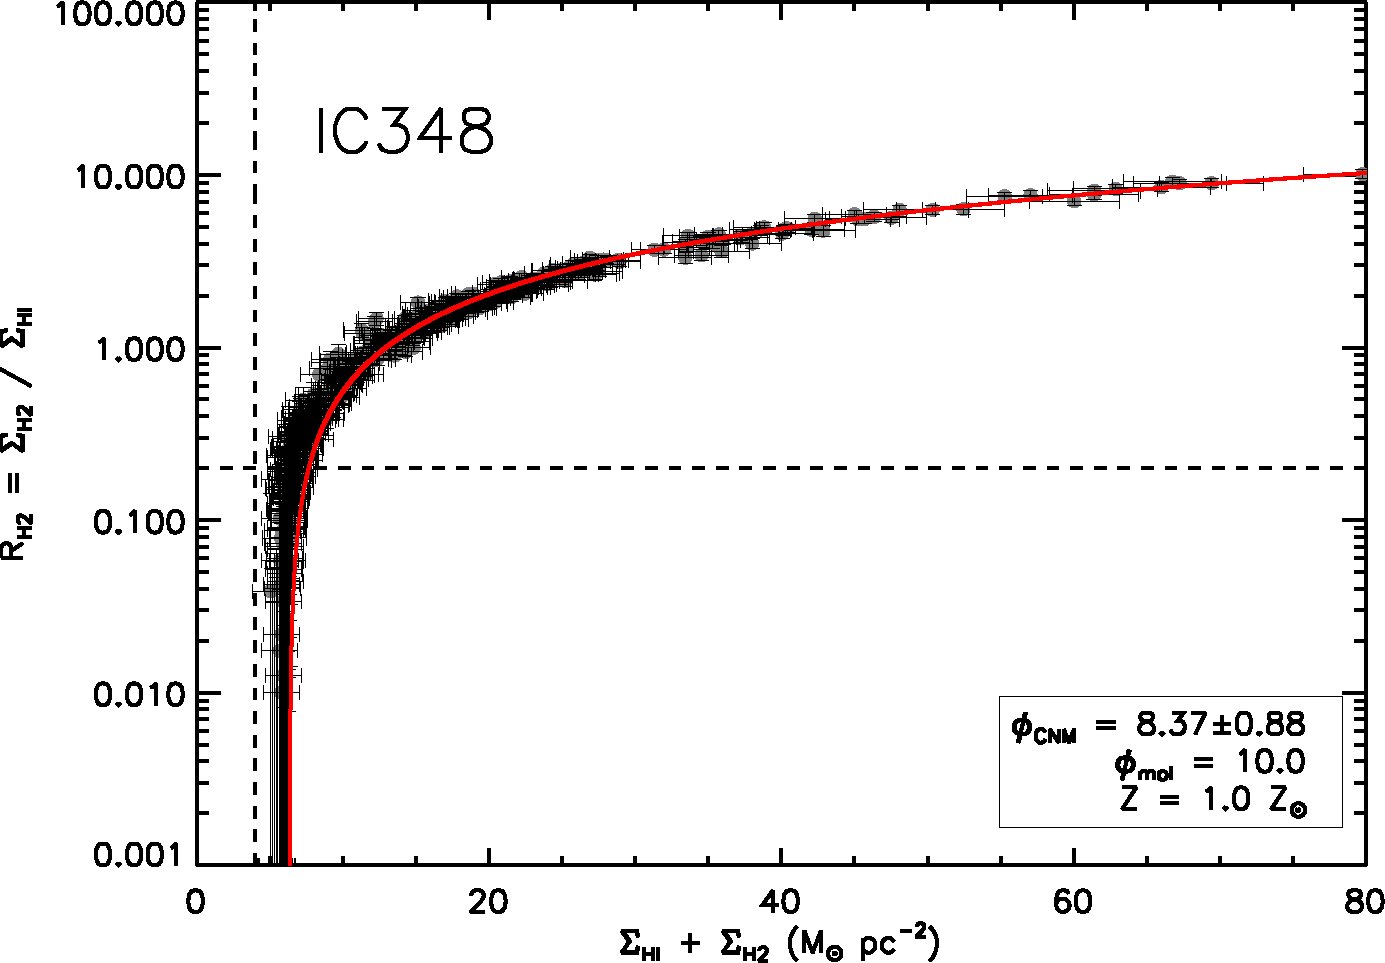
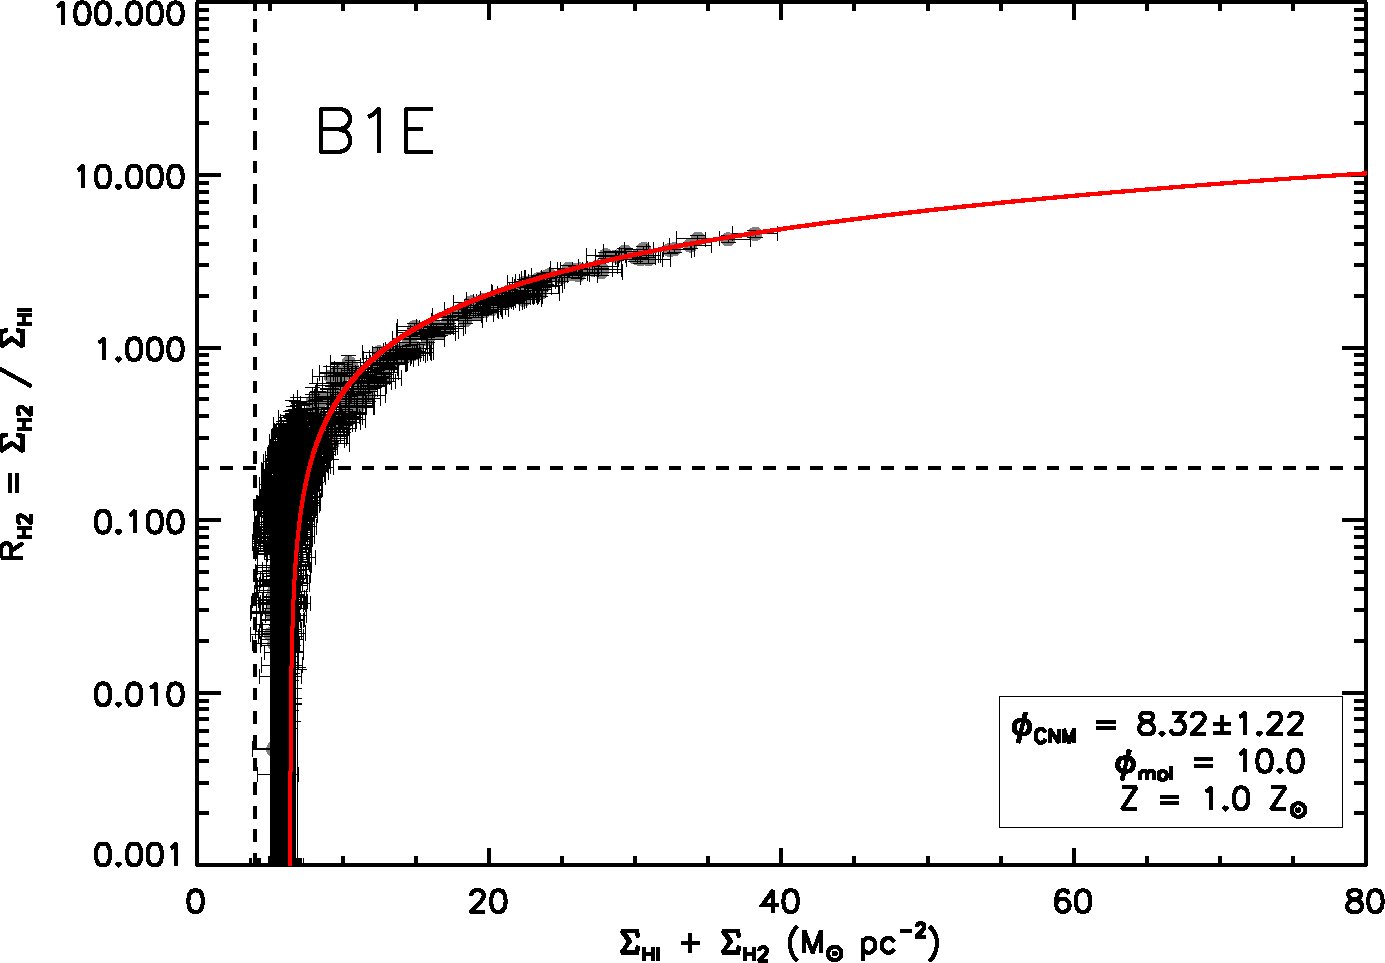
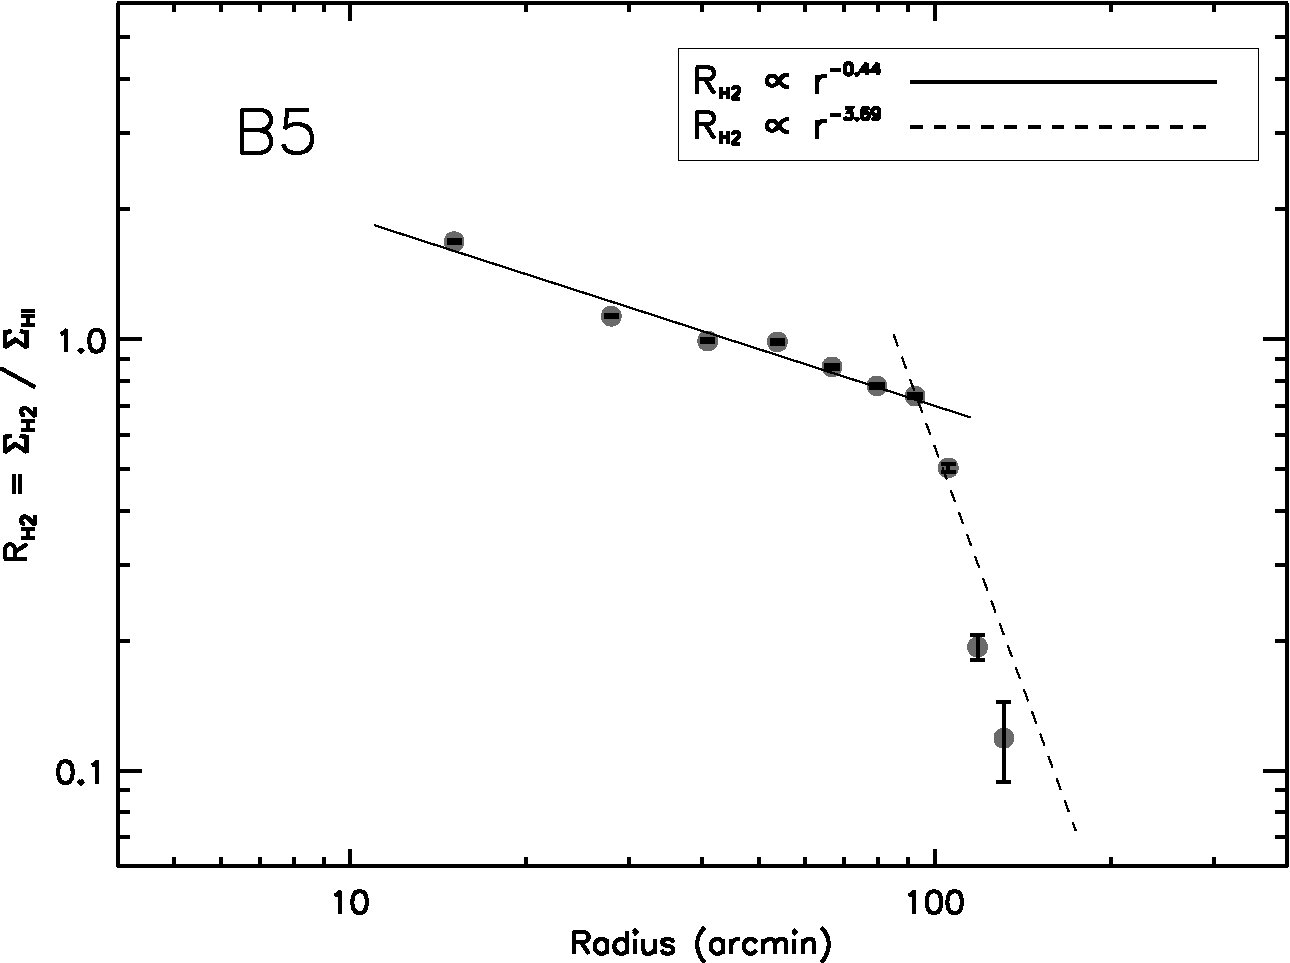
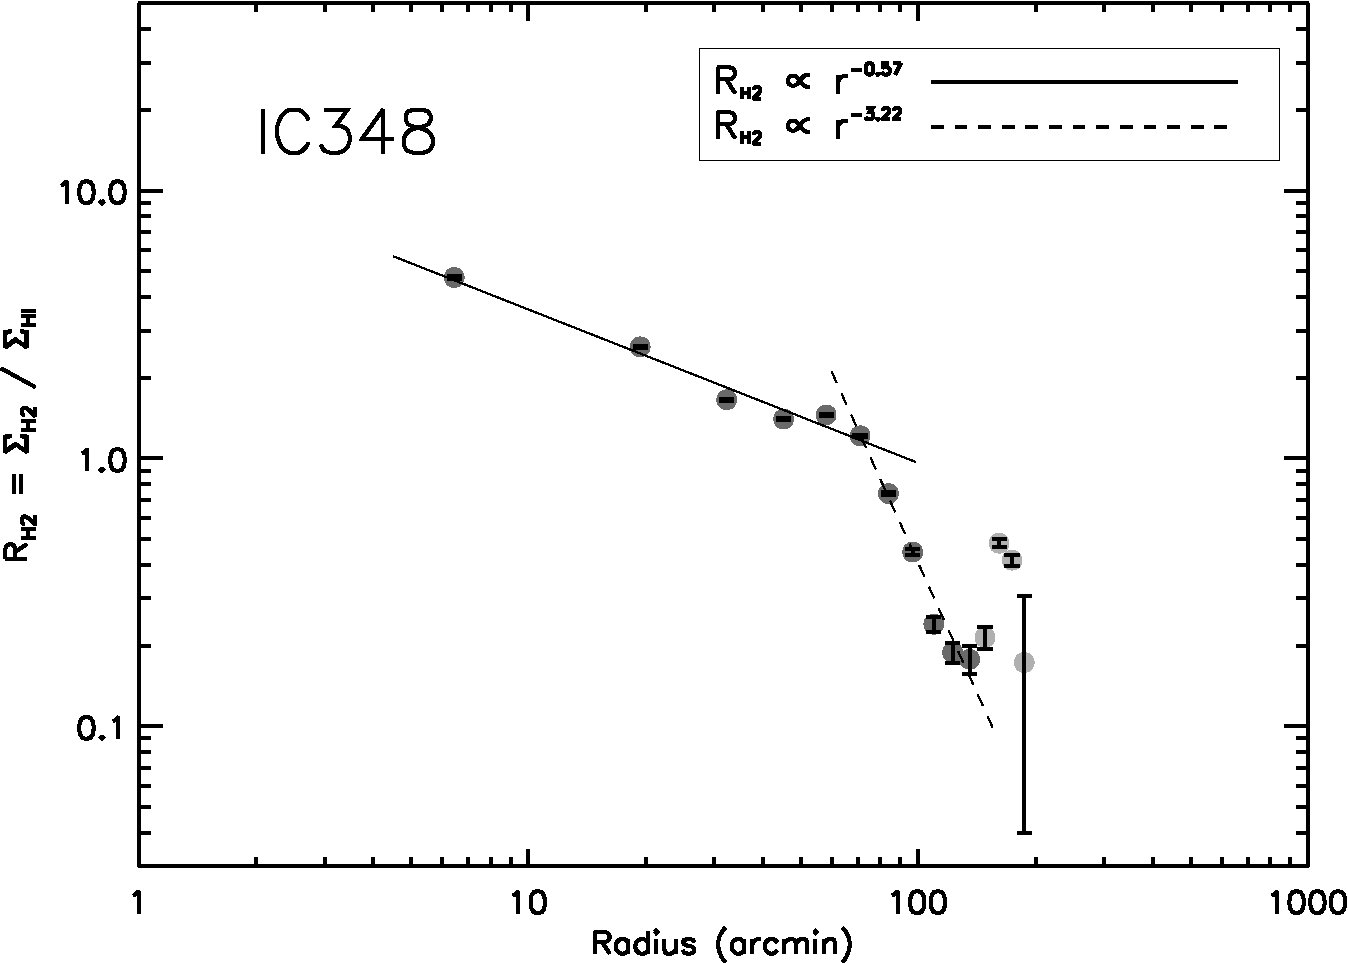
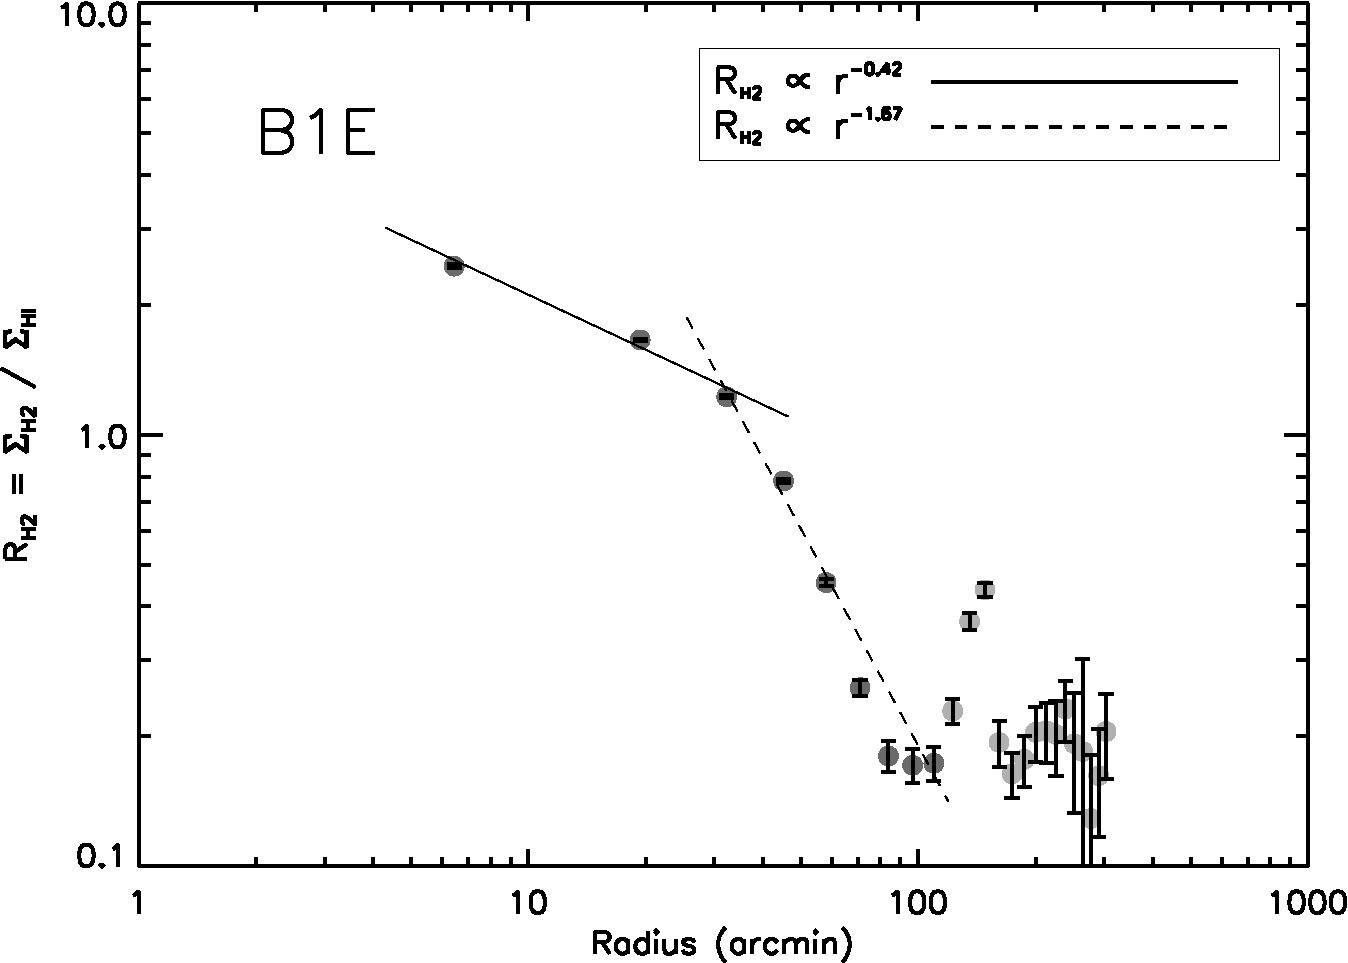
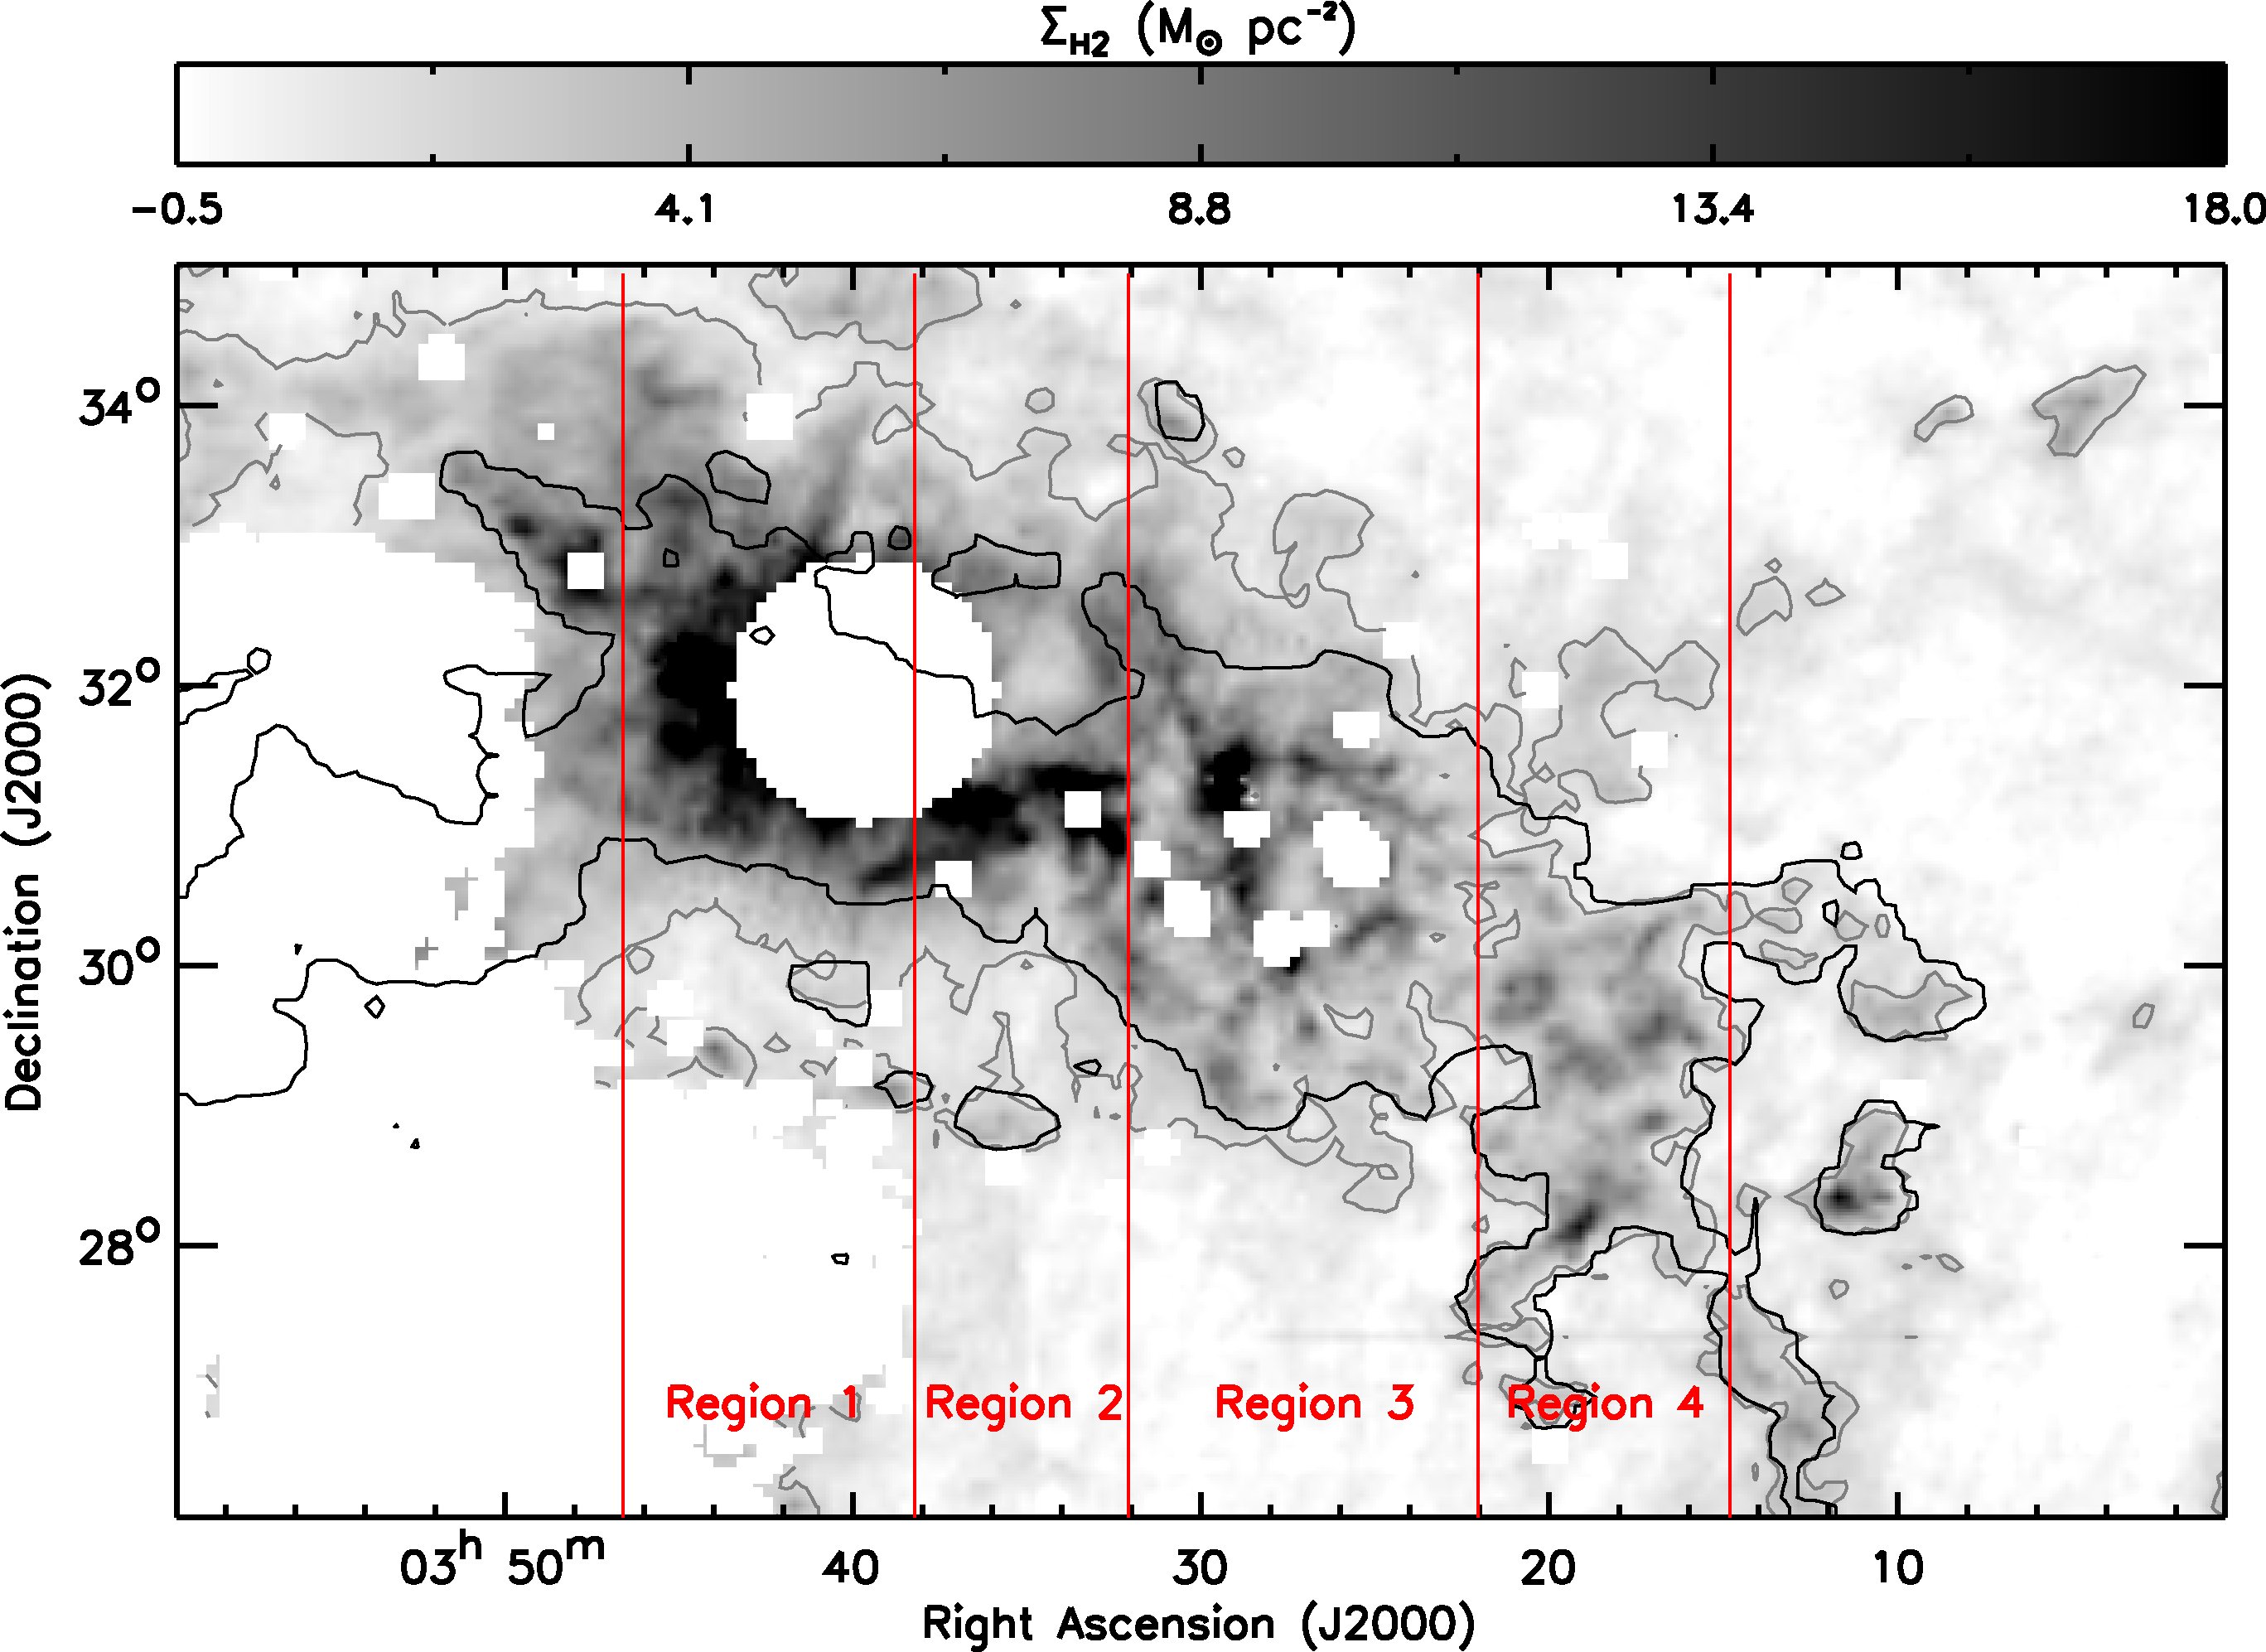
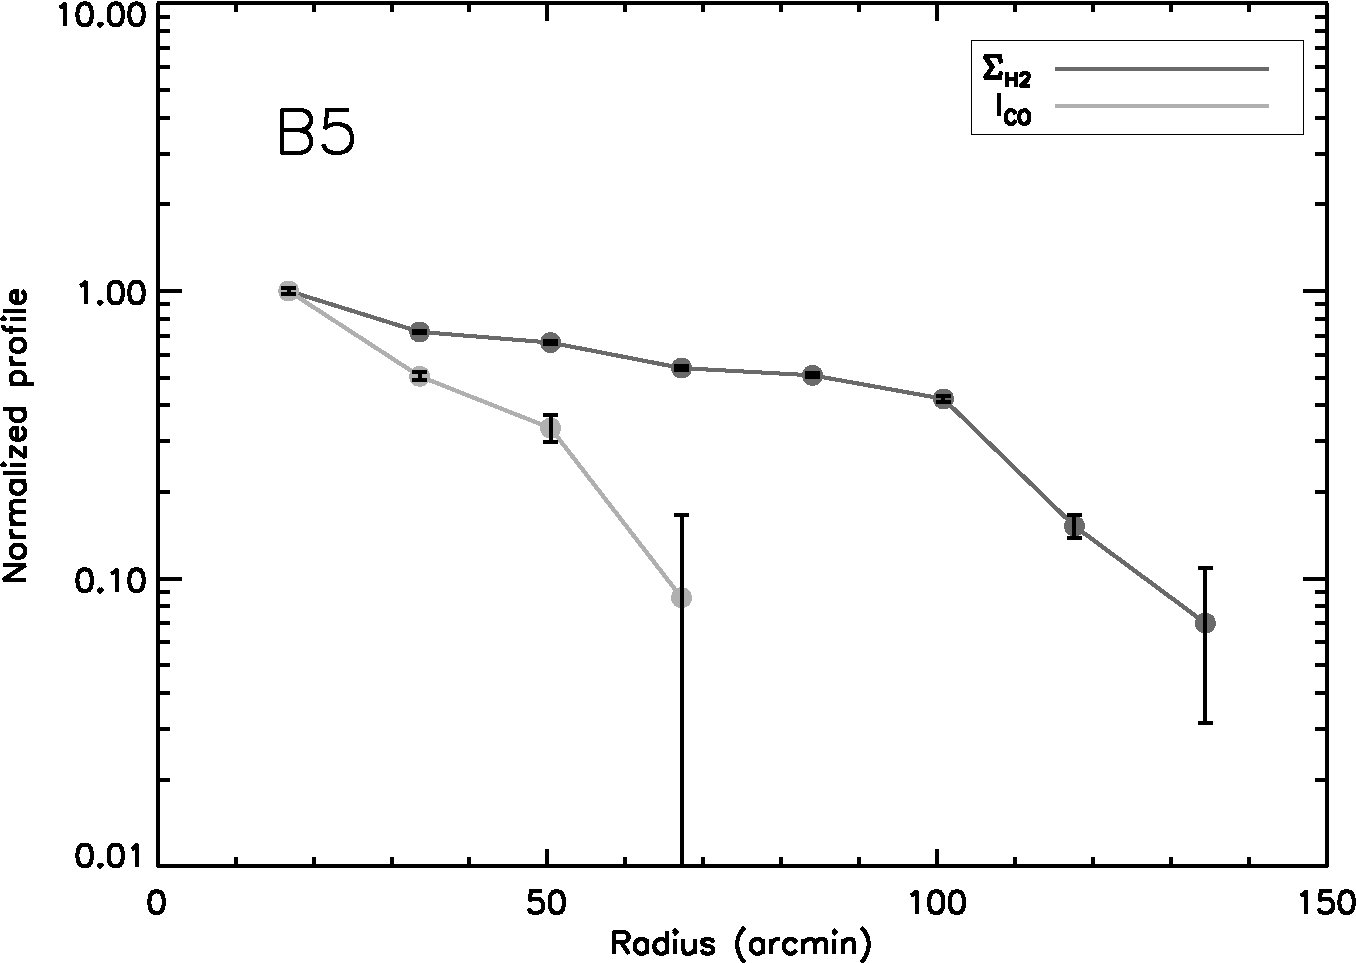
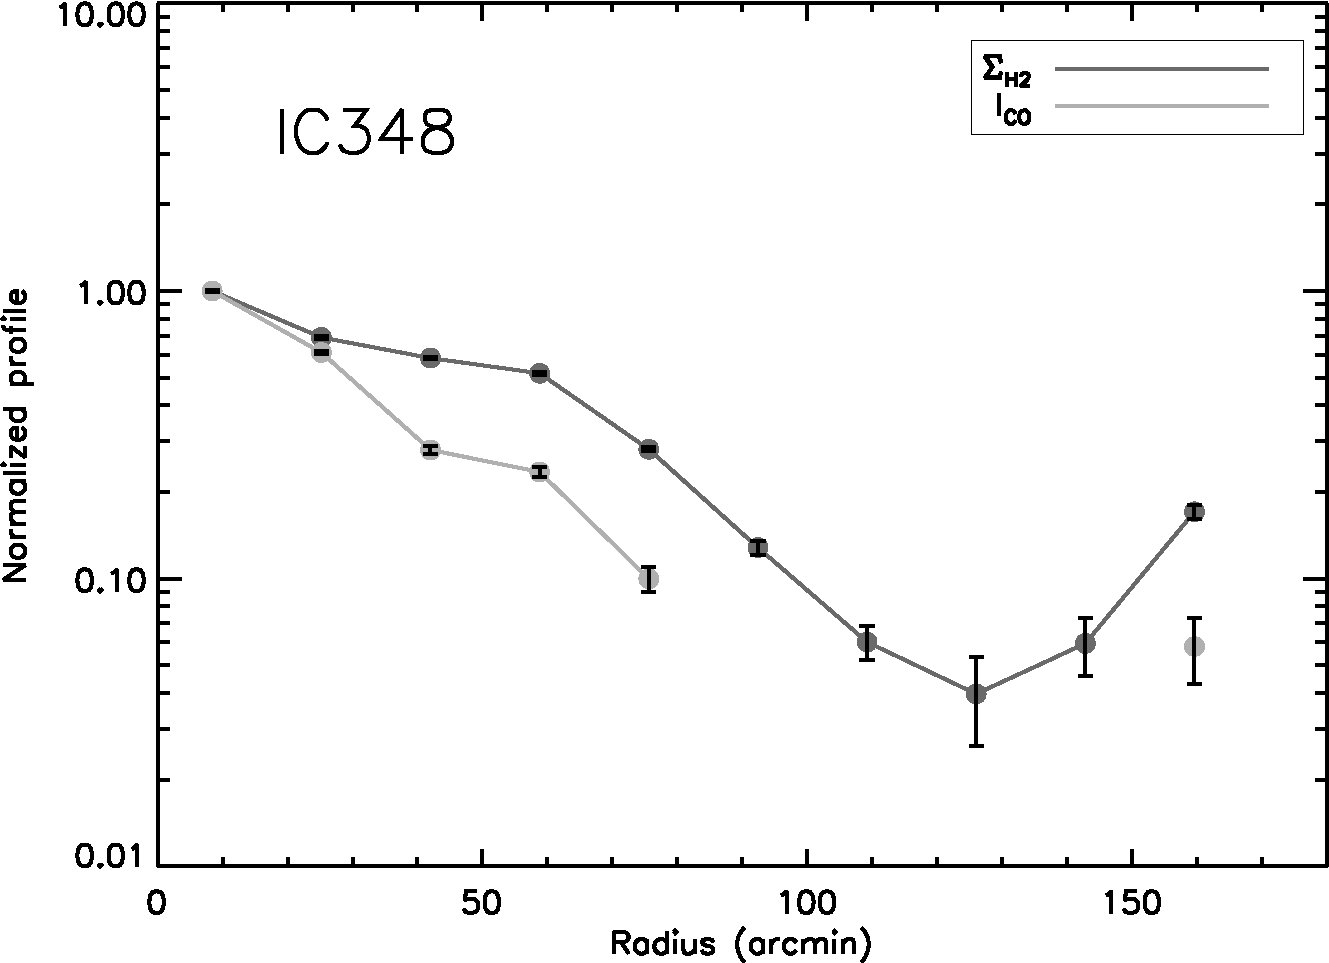
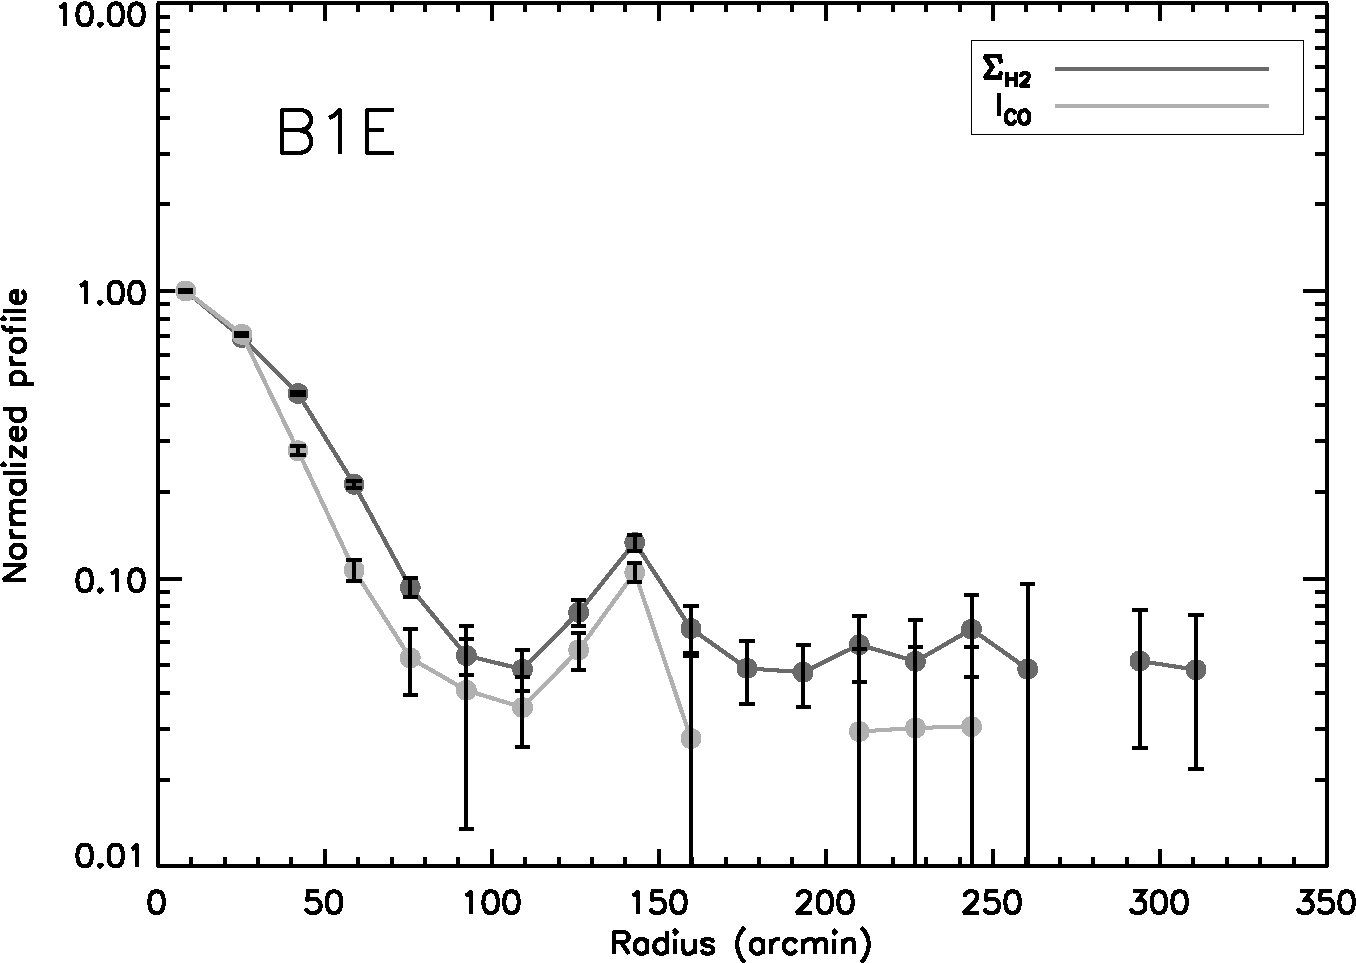
![[Uncaptioned image]](/html/1110.2745/assets/B1_histo_102311.jpg)
![[Uncaptioned image]](/html/1110.2745/assets/NGC1333_histo_102311.jpg)
![[Uncaptioned image]](/html/1110.2745/assets/tot_sden_HI_plot_B1_all_102311.jpg)
![[Uncaptioned image]](/html/1110.2745/assets/tot_sden_HI_plot_NGC1333_all_102311.jpg)
![[Uncaptioned image]](/html/1110.2745/assets/R_H2_plot_B1_all_102311.jpg)
![[Uncaptioned image]](/html/1110.2745/assets/R_H2_plot_NGC1333_all_102311.jpg)
![[Uncaptioned image]](/html/1110.2745/assets/R_H2_radial_plot_B1_all_p2_102311.jpg)
![[Uncaptioned image]](/html/1110.2745/assets/R_H2_radial_plot_NGC1333_all_p2_102311.jpg)
![[Uncaptioned image]](/html/1110.2745/assets/CO_H2_sden_radial_plot_B1_102311.jpg)
![[Uncaptioned image]](/html/1110.2745/assets/CO_H2_sden_radial_plot_NGC1333_102311.jpg)