Unveiling the physical properties and kinematics of molecular gas in the Antennae Galaxies (NGC 4038/9) through high resolution CO ( = 3–2) observations
Abstract
We present a (100 pc) resolution 12CO (3–2) map of the nearby intermediate stage interacting galaxy pair NGC 4038/9 (the Antennae galaxies) obtained with the Submillimeter Array. We find that half the CO (3–2) emission originates in the overlap region where most of the tidally induced star formation had been previously found in shorter wavelength images, with the rest being centered on each of the nuclei. The gross distribution is consistent with lower resolution single dish images, but we show for the first time the detailed distribution of the warm and dense molecular gas across this galaxy pair at resolutions comparable to the size of a typical giant molecular complex. While we find that 58% (33/57) of the spatially resolved Giant Molecular Associations (GMAs; a few 100 pc) are located in the overlap region, only spatially coincides with the optically detected star clusters, suggesting that the bulk of the CO (3–2) emission traces the regions with very recent or near future star formation activity. The spatial distribution of the CO (3–2)/CO (1–0) integrated brightness temperature ratios mainly range between 0.3 and 0.8, which suggests that on average the CO (3–2) line in the Antennae is not completely thermalized and similar to the average values of nearby spirals. A higher ratio is seen in both nuclei and the southern complexes in the overlap region. Higher radiation field associated with intense star formation can account for the nucleus of NGC 4038 and the overlap region, but the nuclear region of NGC 4039 show relatively little star formation or AGN activities and cannot be easily explained. We show kinematical evidence that the high line ratio in NGC 4039 is possibly caused by gas inflow into the counter-rotating central disk.
Subject headings:
galaxies: individual (NGC 4038, NGC 4039) — galaxies: interactions — galaxies: ISM — radio lines: galaxies1. Introduction
Gravitational interaction between galaxies is now considered to be one of the primary mechanisms of galaxy evolution. Major mergers, composed of two or more galaxies with comparable masses, are widely believed to provide a way to form elliptical and spheroidal galaxies (Toomre, 1977). Furthermore, galaxy interaction is known to increase star formation activities as seen in the increasing fraction of tidally distorted morphologies in ultraluminous infrared galaxies (ULIRGs: L L☉, SFR M☉ yr-1; Sanders & Mirabel, 1996). In addition, the number of merging galaxies appears to increase at high redshifts (e.g. Bundy et al., 2009). The obvious first step in characterizing this process and the response of the cold gas and its relation to merger induced starburst activity is to observe nearby merging galaxies.
The Antennae galaxies (NGC 4038/9) is the nearest colliding galaxy pair observable from the northern hemisphere located at a distance of 22 Mpc (Schweizer et al., 2008). Numerical simulations of the Antennae (e.g. Toomre & Toomre, 1972) suggested that the Antennae are at the intermediate stage of the collision. Mihos et al. (1993) suggest that the two spiral galaxies passed the initial pericenter 210 Myr ago, and the final coalescence will take place in about 100 Myr.
The Antennae have been observed at all available wavelengths from radio to X-ray. Whitmore et al. (1999) observed the Antennae with the Wide Field Planetary Camera 2 on the Hubble Space Telescope (HST) and identified thousands of stellar clusters which have formed during the merging process. They found that most of the star formation occurs in the form of massive compact star clusters, which are formed from supergiant molecular clouds. Previous observations have found that most of the active star forming regions are concentrated in the region where the two galaxies overlap. The Herschel-PACS maps at 70, 100 and 160 revealed that both nuclei are brighter than the HII regions in the arms, but the brightest emission in three bands comes from the overlap region (Klaas et al., 2010). The mid-infrared (MIR) and far-infrared (FIR) emission traces buried star formation, which is obscured by dust and therefore is invisible at optical wavelengths. They estimated that the integral SFR is 22 M☉ yr-1 and the SFR in the southernmost knot of the overlap region with an area of 4.68 kpc2 is 3 M☉ yr-1. They also found that several emission knots in the overlap region are in different evolutionary stages. Low angular resolution observations have revealed strong [CII] emission, which arises mainly from photo dissociation regions created by far-ultraviolet photons from hot young stars, near the overlap region (Nikola et al., 1998). In addition, the southernmost knot of the overlap region is currently the most active area with a very young stellar complex. Neff & Ulvestad (2000) observed 4 and 6 cm radio continuum emission using the VLA and estimated that the overall star formation rate seems to be a factor of 20 higher than normal galaxies. They found that the compact radio source with the strongest thermal radio emission requires 5000 O5 stars to account for the free-free emission. They estimate a supernova rate of 0.2 yr-1 if the sources with steep radio spectra are dominated by non-thermal emission produced in supernova remnants.
The distribution and the characteristics of molecular gas have been investigated in detail using mm/submm telescopes around the world. Gao et al. (2001) obtained the CO (1–0) map using the NRAO 12 m single-dish telescope and found that the distribution of the CO (1–0) emission is similar to those of the MIR and FIR emission at a kiloparsec scale. Wilson et al. (2000) identified five supergiant molecular complexes (SGMCs) with masses of (3–6) 108 M☉ in the overlap region using the 12CO (1–0) map obtained at the Owens Valley Radio Observatory (OVRO). Zhu et al. (2003) have obtained single-dish maps at the Nobeyama 45m telescope in the CO (1–0) line and using the James Clark Maxwel Telescope (JCMT) in the CO (2–1) and CO (3–2) lines. Each nucleus contains a molecular mass of M☉ and the overlap region accounts for approximately 42 of total 12CO (1–0) flux of the inner disk of the Antennae. They found that the CO integrated intensity ratios are high in the overlap region. This is the first case where high CO (3–2)/CO (1–0) ratios are found outside a galactic nucleus. Furthermore, Schulz et al. (2007) obtained CO (1–0) and CO (2–1) maps using the IRAM 30 m Millimeter Radio Telescope and CO (3–2) map using the Heinrich Hertz Telescope. The total molecular gas mass of the system ( 1010 M☉) is about twice the total gas mass of the Milky Way. However the molecular gas mass within the 1 kpc nucleus of NGC 4038 and NGC 4039 exceeds that of the central 1 kpc of the Milky Way by a factor of almost 100, revealing high gas concentration into the two nucleus. Schulz et al. (2007) also derived the line ratios ranging between 0.50 and 0.66, which are lower than the ratios estimated by Zhu et al. (2003).
The purpose of our work is to investigate the physical properties and the kinematics of the CO (3–2) emitting molecular complexes in the Antennae using (1′′ corresponds to about 107 pc) resolution CO (3–2) observations. The CO (1–0) rotational transition has a critical density of cm and an upper energy level 5 K, whereas the CO (3–2) rotational transition has cm and 33 K. Thus the CO (3–2) emission is a better tracer of denser and warmer molecular gas than CO (1–0) emission.
This paper is organized as follows. We describe our observations in §2 and our results in §3. In §4, we provide a discussion of our results. We present the properties and the distribution of identified molecular complexes (§4.1), the CO (3–2)/(1–0) brightness temperature ratio (§4.2), the kinematics in NGC 4039 (§4.3), and a possible molecular gas bubble in NGC 4038 (§4.4). We summarize and conclude this paper in §5.
2. Observations
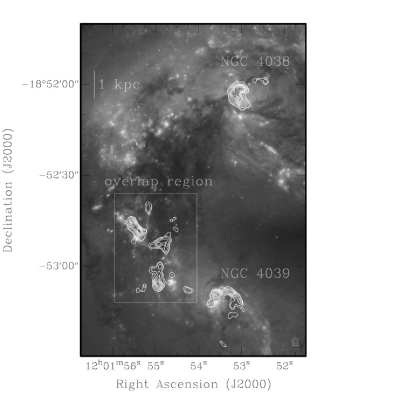
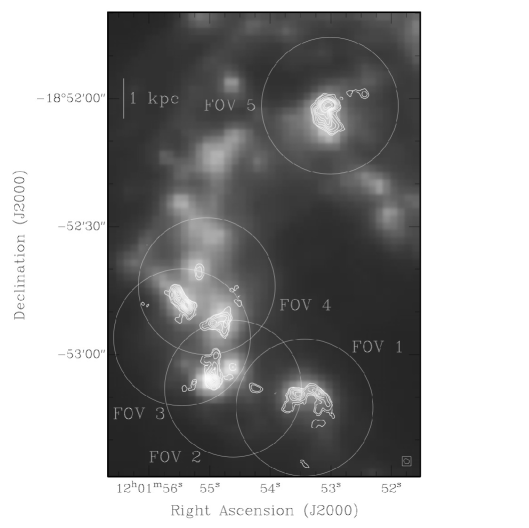
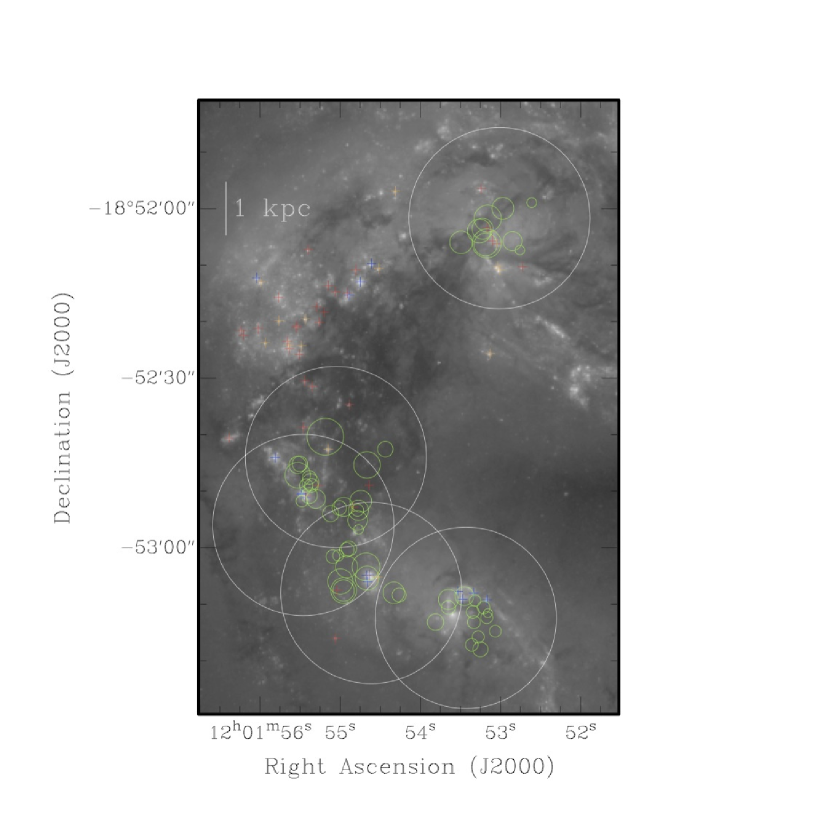
We conducted CO (3–2) observations of main bodies of the NGC 4038/9 with the Submillimeter Array111 The Submillimeter Array is a joint project between the Smithsonian Astrophysical Observatory and the Academia Sinica Institute of Astronomy and Astrophysics and is funded by the Smithsonian Institution and the Academia Sinica. (SMA; Ho et al., 2004) on March 2005 and March 2008 in the compact configuration and December 2008 in the extended configuration. The data were obtained using a five-pointing mosaic where the phase centers were chosen to cover the main CO (3–2) emission peaks seen in the JCMT map of Zhu et al. (2003). The coordinates of the phase centers are shown in Table 1 and the fields of view are shown in Figure 1 (right). The total on source observing time was approximately 10 hours. The SIS receivers were tuned to the frequency of the CO (3–2) line (=345.796 GHz) redshifted to the systemic velocity of 1634 km/s. The primary beam of the array at this frequency is . The correlator had a 2 GHz total bandwidth with a 0.8 MHz (0.7 km s-1) frequency resolution. The quasar 3C 279 was observed for phase and amplitude calibration. Absolute flux calibration was performed using Uranus. The uncertainty of flux calibration is 20 .
Data inspection and calibration was carried out using the MIR package written in IDL and imaging was done using the MIRIAD package. The synthesized beam size is , which corresponds to 150 pc 120 pc with a position angle of 29.4. Natural weighting of the visibilities is used to maximize the sensitivity, and the achieved rms noise level in 10 km s-1 channel maps is 38 mJy beam-1. The continuum emission is not detected with an upper limit of 17.7 mJy (3 ).
3. Results
3.1. CO (3–2) Distribution and Total Flux
The CO (3–2) integrated intensity map overlaid on optical/MIR images is shown in Figure 1. In addition, we compare the CO (3–2) map with multiwavelength images from radio and to X-ray (see Appendix A). In general, the locations of the CO (3–2) emitting molecular complexes are consistent with the positions of the SGMCs detected by Wilson et al. (2000) in CO (1–0), but the higher angular resolution achieved in the CO (3–2) map shows details that were unseen in the CO (1–0) image. Both galaxies show central CO (3–2) concentrations near the nuclei and have one gas arm roughly distributed along the dust lanes toward southwest seen in the HST 435 nm image (Figure 1 (left)). The strongest CO (3–2) emission is associated with the nucleus of NGC 4038 with a peak flux density (10 km s-1 velocity resolution) of 2.0 0.4 Jy beam-1. The CO (3–2) emission near the nucleus of NGC 4039 is composed of at least two distinct large scale components separated by 560 pc. The overlap region consists of numerous emission peaks, with complex structure seen in larger ( 1 kpc) molecular complexes. Spatial correlation with optical emission is poor in most of the molecular complexes in the overlap region, mostly because these regions are strongly affected by dust extinction. However, the general association with the Spitzer 8 m emission (Figure 1 (right)), which traces the dusty regions associated with CO (3–2) emitting molecular clouds, is much better than the optical association.
The total integrated CO (3–2) flux of main body of the Antennae is 4.4 103 Jy km s-1. The two nuclei of NGC 4038 and NGC 4039 contain 1.4 103 and 9.4 102 Jy km s-1, respectively. The total flux in the overlap region is 2.1 103 Jy km s-1, which is approximately half of the total integrated flux over the entire galaxy. The percentage of missing flux derived by comparing the SMA and JCMT flux (Zhu et al., 2003) are 55 in NGC 4038, 35 in NGC 4039 and 67 in the overlap region. The low missing flux in NGC 4039 suggests the compact nature of the CO (3–2) emitting clouds, while the relatively large missing flux suggests the presence of a significant extended ( 3 kpc) component in the overlap region.
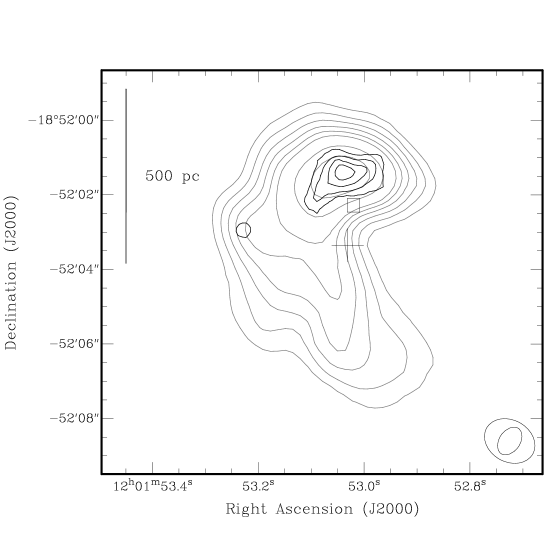
The central pc in NGC 4038 is unresolved by the beam, but the strong signal allows us to use the extended configuration data alone for a higher angular resolution image (Figure 2). The synthesized beam size is by adopting natural weighting of the visibilities. Most of the diffuse and extended emission below 15 in the resolution map made using all data (Figure 1) is resolved out in the high resolution map. The deconvolved size of the main component is 230 pc () 150 pc (), and the FWHM velocity width is 110 km s-1. The brightness temperature (the peak intensity) scales with the beam filling factor and the molecular gas temperature . From the peak intensity of 13 K and assuming that the typical molecular gas temperature of the CO (3–2) emission is 30 K (Schulz et al., 2007), the beam filling factor is 0.4. Thus the distribution of the CO (3–2) emission is likely more compact than the region observed with the pc beam.
3.2. CO (3–2) Kinematics
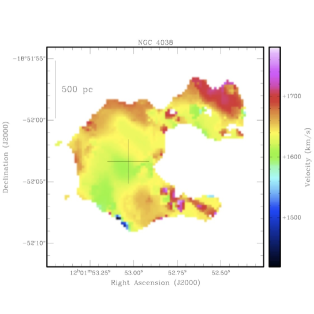
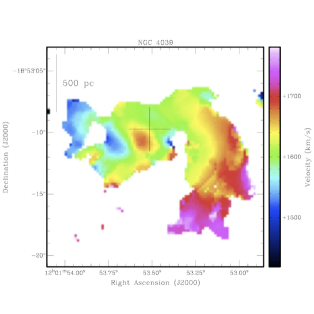
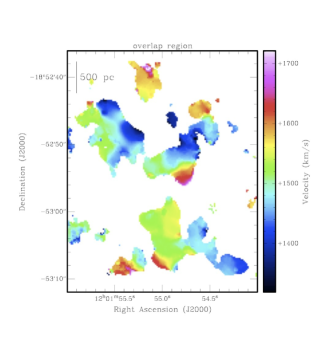
The velocity fields of NGC 4038, NGC 4039, and the overlap region are shown in Figure 3 (a), (b) and (c), respectively. At this spatial resolution, the velocity at the Ks-band nucleus of NGC 4038 (Mengel et al., 2002) is 80 km s-1 lower than the surrounding medium, which may suggest a rotation or gas streaming into the nuclear region along the arm. In contrast, the CO (3–2) emitting gas near the nucleus of NGC 4039 shows a large velocity gradient (310 km s-1 kpc-1) from the north-west to south-east, with the velocity ranging from 1560 km s-1 to 1640 km s-1. Furthermore, the gas component distributed along the optical dust lane of NGC 4039 also shows a steep velocity gradient of 170 km s-1 kpc-1. The implications of these kinematic features will be discussed in §4.3. In the overlap region, the velocity of the gas ranges from VLSR = 1300 to 1650 km s-1. The large scale kinematics in the overlap region show a north-south velocity gradient, which is consistent with the velocity field seen in the lower resolution JCMT map (Zhu et al., 2003). The new SMA map reveals that each molecular component shows complex kinematics, with velocity gradients in excess of 100 km s-1 kpc-1 in each molecular complex, some as large as 300 km s-1 kpc-1.
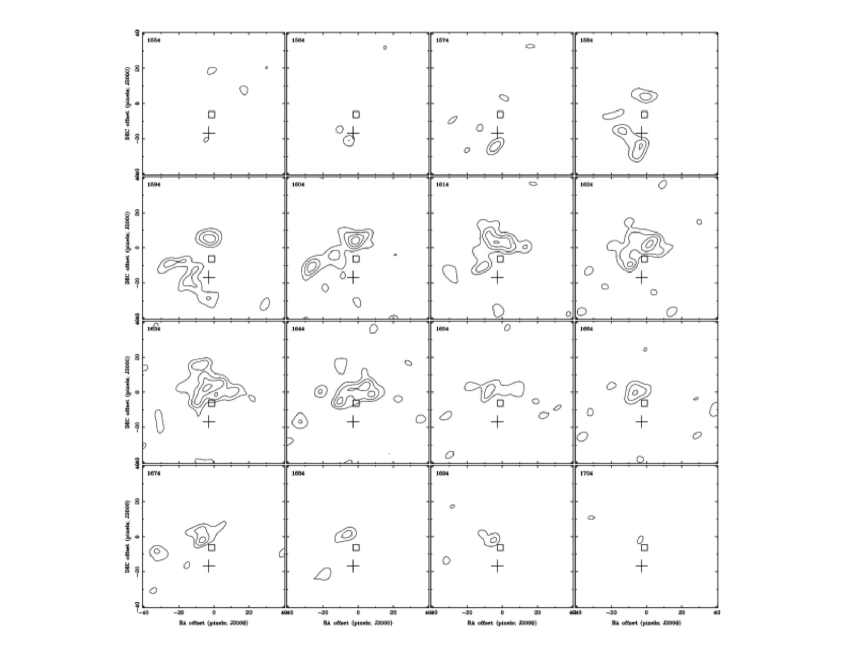
The channel maps of the high resolution cube of NGC 4038 with 10 km/s velocity resolution are shown in Figure 4. The rms noise level (1) is 70 mJy beam-1. At this angular and velocity resolution, the morphology of the emission feature is highly complex around the nucleus, with the emission distributed in a semicircle around the known nonthermal radio source dominated by synchrotron radiation from supernova remnants (Neff & Ulvestad, 2000). The radio source does not have detectable CO (3–2) associated at an rms of 70 mJy beam-1 which corresponds to a molecular gas mass limit of 9 105 M☉. Further discussion on the possible origin of this CO (3–2) arc is provided in §4.4.
4. Discussion
4.1. Properties of the CO (3–2) Molecular Complexes
We identified molecular complexes by applying the automatic clump identification algorithm Clumpfind (Williams et al., 1994) to the CO (3–2) data. One of programs in Clumpfind, CLFIND, works on 3D (RA, Dec, velocity) data cubes, searches for local peaks of emission, and follows them down to lower intensity levels. Then it decomposes the data cube into clumps in which the emission is concentrated. While the 2 threshold is the recommended value for identifying robust molecular clumps (Williams et al., 1994), our experiments find that the total number of identified molecular complexes varies by 15 for a 10 deviation from the 2 threshold. This is likely because the program falsely detects () sidelobes of the real emission. We find that the number of identified clumps only changes by a few percent for a threshold of . Thus we chose 2.6 for robustly detecting molecular clumps with high significance in the following analysis.
A total of 57 molecular complexes are identified, 33 () of which are located in the overlap region. The properties of the molecular complexes such as position, systemic velocity (), radiusv(), and velocity dispersion () were measured using the program CLSTATS (Williams et al., 1994) and are summarized in Table LABEL:tb:clump (Appendix B). We estimate the error in the position, radius, and velocity to be , 44 pc, and 5 km s-1, respectively. The radii of the molecular complexes ranges between 85 and 348 pc, whereas the velocity dispersion ranges between 6 and 36 km s-1.
4.1.1 Molecular Mass
The molecular gas mass is derived by;
| (1) | |||||
where is the CO luminosity-to-H2 mass conversion factor, is the velocity integrated flux, is the observing frequency, and is the luminosity distance (Solomon & Vanden Bout, 2005). We used = 4.8 M☉/K km s-1 pc2 (Solomon & Barrett, 1991) scaled by the average CO (3–2)/(1–0) line intensity ratio for each region (see §4.2). The molecular masses are estimated to be 107 – 108 M☉. In addition, the virial mass of the molecular complexes are estimated from , where and is the radius and the velocity dispersion of the molecular complex, and is the gravitational constant. The molecular complex is gravitationally bound when their is smaller than unity. We find that 84 of the molecular complexes are gravitationally bound, including the most massive molecular complex located north of the NGC 4038 nucleus. We note that the velocity dispersions used here are likely overestimated by a factor of 2 – 3 (§4.1.3), and hence the derived virial masses are also significantly overestimated. This suggests that almost all of the molecular complexes observed at this spatial resolution have 1 and that they are gravitationally bound.
4.1.2 Radius and Velocity Dispersion
The distribution of the radii of the molecular complexes in each region are shown in Figure 5. The Kolmogorov-Smirnov test gave P-value = 0.002 (Table 2) for the comparison of the distribution between NGC 4038 and NGC 4039, suggesting that the two populations are significantly different. There are molecular complexes with large radii ( 180 pc ) in NGC 4038, but not in NGC 4039. The median radii in NGC 4038 and NGC 4039 are 210 and 120 pc, respectively, and thus the molecular complexes near the nucleus of NGC 4038 are on average 1.8 0.7 times larger than those in NGC 4039. The size distribution in the overlap region range between 90 and 350 pc. The average size of the molecular complexes in the southern part of the overlap region (declination -18∘ 53 00) is 1.3 times larger than the average size of those in the overlap region. In addition, the P-value = 0.975 and 0.017 (Table 2) for the comparison of the distribution between the southern part of the overlap region and NGC 4038, and NGC 4039, respectively. This suggests that the radii between NGC 4038 and the southern part of the overlap region are similar. Klaas et al. (2010) estimated the SFRs of seven individual emission knots from their Herschel maps. Knot K1, which corresponds to the southern part of the overlap region, has the highest SFR (2.78 M☉ yr-1) and knot NN, which corresponds to the central region of NGC 4038, has the second highest SFR (1.17 M☉yr-1). Therefore the larger molecular complexes, which are possibly formed by clustering around local peaks of the gravitational potential wells, may be used as the signposts of current dusty star forming regions.
The velocity dispersions of the molecular complexes in each region are shown in Figure 6. We conducted a Kolmogorov-Smirnov test on the distribution of the velocity dispersions, and obtained P-value = 0.664 – 0.973 (Table 2), suggesting that the velocity dispersions among the three different regions are similar. In NGC 4039, molecular complexes with larger velocity dispersions (25 – 35 km s-1) are located within 500 pc from the nucleus and those with a smaller velocity dispersion (10 – 25 km s-1) are located in the gas arm. Comparing the molecular complexes in the Antennae with clumps in M64 which is a molecule-rich spiral galaxy located at 4.1 Mpc (Rosolowsky & Blitz, 2005) and the Galaxy (Oka et al., 2007), the molecular complexes with the same velocity dispersion have an order of magnitude larger molecular mass in the Antennae.
4.1.3 The Relation between Radius and Velocity Dispersion
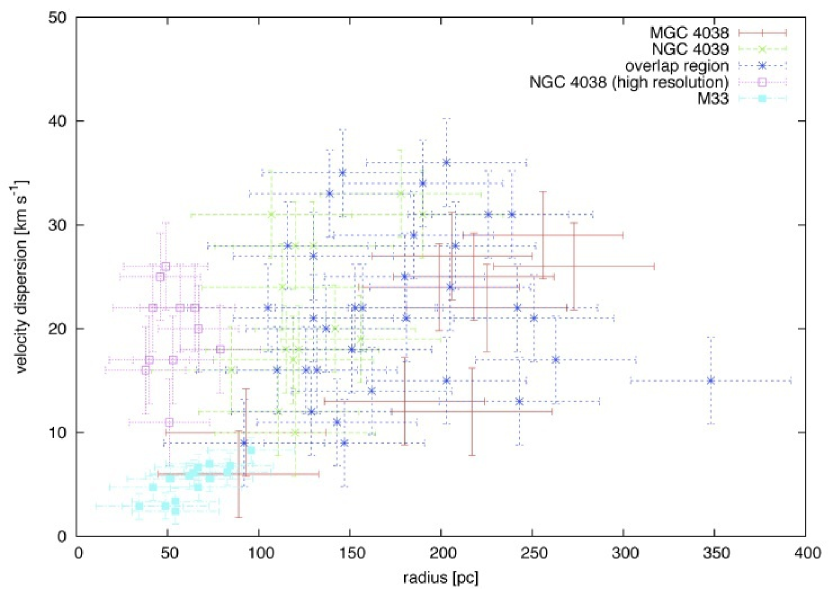
On the GMC scales, it is known that the radius is proportional to the velocity dispersion (Larson, 1981). Rosolowsky et al. (2003) find a correlation between the radii and velocity dispersions of GMCs in M 33 which is a normal spiral galaxy located at 850 kpc, and the correlation appears to hold even in the outer disk (Bigiel et al., 2010). In other instances, Fukui et al. (2008) showed that the GMCs in the Large Magellanic Cloud (LMC) follow a similar correlation, but it is offset from that found for the GMCs in the inner Galaxy (Solomon et al., 1987). In order to investigate if such correlation exists in the Antennae at GMA scales, we plot the relation between the radii and the velocity dispersions of the identified molecular complexes (Figure 7). The correlation coefficients derived from the least squares fit to the different regions are 0.68 in NGC 4038, 0.25 in NGC 4039, and 0.01 in the overlap region, suggesting the absence of a strong correlation in each region of the Antennae. At these scales, the velocity dispersion likely reflects the relative bulk motion of a collection of CO (3–2) emitting clumps, and not the intrinsic velocity dispersions pertaining to the individual GMCs. Hence the absence of a strong correlation at size scales of GMAs is somewhat expected, especially in the dynamically disturbed parts of the galaxy such as the overlap region.
We investigate further the relation between radius and velocity dispersion of molecular complexes in NGC 4038 because the correlation coefficient in NGC 4038 is the highest among three regions. By using Clumpfind on the high resolution data, we identified 11 molecular complexes that are mostly located 100 pc north of NGC 4038. Their radii range between 40 and 80 pc and are about the same size as the GMCs in M 33. The relatively tight correlation between radius and velocity dispersion is seen in the GMCs detected in a quiescent spiral galaxy M 33 (Onodera, 2009) (Figure 7). However, the velocity dispersions of the molecular complexes in NGC 4038 are 2 –3 times larger than the GMCs in M 33 and distributed between 10 and 30 km s-1. This is further evidence suggesting that the velocity dispersion does not reflect the intrinsic velocity dispersion but the relative bulk motion of CO (3–2) emitting clumps.
Finally, we note that the lack of significant difference in the velocity dispersion of molecular complexes between NGC 4038 and NGC 4039 may be a result of limited sensitivity and angular resolution. The clump identification routine is unable to separate the apparently smooth and continuous distribution of molecular gas into smaller clumps.
4.1.4 Distribution of the Molecular Complexes and Their Relation to Star Clusters
The green circles in Figure 8 show the positions of the identified molecular complexes and the crosses represent the positions of 50 most luminous (at V-band) and/or the 50 most NIR-bright clusters whose ages are older than 1 Myr (Whitmore et al., 2010). Overall, only 17 out of 57 molecular complexes (30 ) host one or more of these star clusters with a median age of 4 Myr estimated from the ages of the star clusters (Whitmore et al., 2010), not considering projection effects and extinction. In a related study, Mengel et al. (2005) identified star clusters using the VLT Ks-band and found that about 70 of the star clusters with masses are younger than 10 Myr and most of the young clusters with the age 6 Myr are located in the overlap region. Although Mengel et al. (2005) suggest that the CO (1–0) obtained at a spatial resolution of in the overlap region shows spatial correlation with the location of the star clusters, our CO (3–2) emission map with a spatial resolution of shows a clear offset from the star clusters, assuming that the star clusters identified using the V-band image overlap with those identified using the Ks-band image. The offset is evident in the southern part of the overlap region, where the CO (3–2) emission is strong and the CO line ratio is relatively high. Hence, the absence of a significant spatial correlation between the locations of the molecular complexes and star clusters may suggest that the molecular gas traced in CO (3–2) emission corresponds to the regions of future star formation, or regions where star formation occurred in the past 1 Myr because no star cluster which is younger than 1 Myr correspond to the molecular complexes. This timescale is similar to the typical timescale for disassociation from the molecular cloud which is under 3 Myr (Lada & Lada, 2003).
4.2. Distribution of the integrated brightness temperature ratio
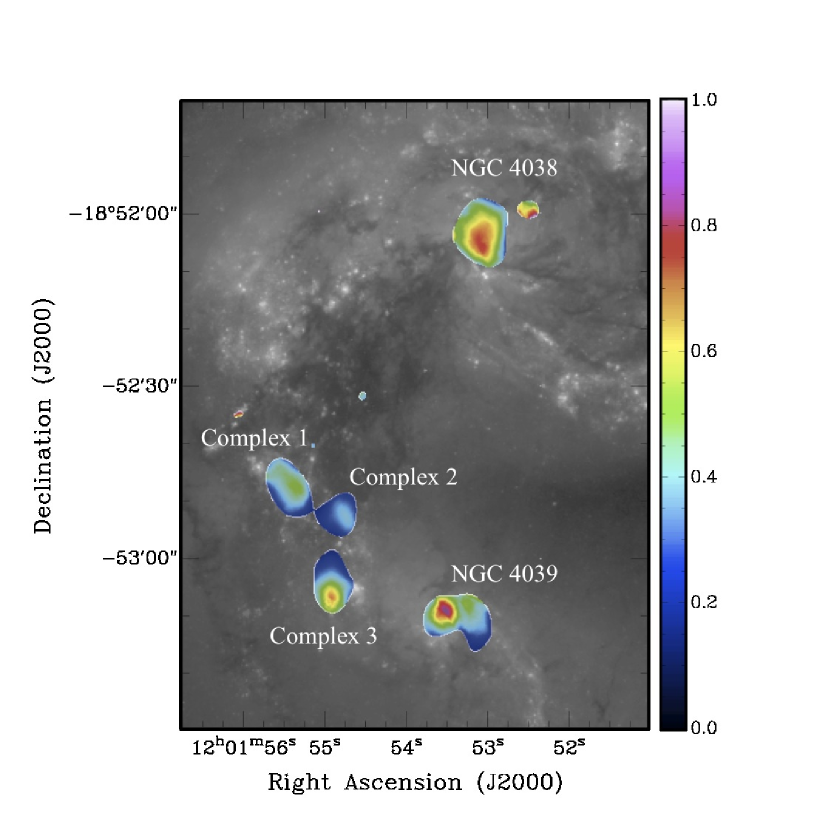
We investigated the integrated brightness temperature CO (3–2)/(1–0) ratios using the SMA CO (3–2) and OVRO CO (1–0) data (Wilson et al., 2000). While we assume the same beam filling factor for both transitions, it is possible that the true distribution of the CO (3–2) emitting cloud is more clumpy and concentrated than the clouds emitting CO (1–0) emission. Therefore, the peak line ratios we estimate here are lower limits. We clipped the visibilities so that both data have the same shortest uv range (minimum uv distance = 10.48 k = 9.13 m) and then convolved the CO (3–2) data to the angular resolution (5.49 3.84) of the CO (1–0) image before estimating the line ratios. Finally, the line ratios are clipped at the 3 level.
The resultant ratio map is shown in Figure 9. We separate the ratio map into five regions (NGC 4038, NGC 4039, Complex 1, Complex 2, and Complex 3) and estimate the mean ratio for each region. The mean integrated intensity ratio ranges from 0.3 to 0.6 (Table 3). Here the error bars are derived from the uncertainties in the flux calibration. On average, the CO line in the Antennae is not thermalized up to = 3–2. They are slightly less than the average ratios estimated by Zhu et al. (2003) using single dish telescopes, which ranged between 0.67 and 0.91. In contrast, the line ratios are close to unity in the southern part of Complex 3 and the two nuclei. Iono et al. (2009) derived 0.93 for the central regions of 12 dusty U/LIRGs in the local universe, which is also in agreement with the starburst galaxies Arp220 and M82 where the derived ratios are (e.g. Greve et al., 2009). Thus, the average excitation conditions analyzed at 1 kpc scale in the Antennae are close to the average properties of nearby galaxies (e.g. 0.44 is the average ratio among 7 nearby galaxies; Mao et al., 2010), except for two localized regions where the excitation conditions are similar to the central regions of starburst galaxies.
Finally, we mention two issues that likely affect the analysis and interpretation of the line ratios. One issue is the inapplicability of the Rayleigh- Jeans approximation, especially for the higher frequency CO (3–2) line. In such case the brightness temperature ratio can be less than unity (0.8 – 0.9 for a temperature of 40 K; see Harris et al. (2010)), assuming a thermalized and optically thick, single component cloud. The other possibility arises from the filling factor difference between the CO (3–2) and CO (1–0) lines. Such a multi-component cloud may be more realistic than adopting a single component cloud, and higher angular resolution ALMA/ACA observations of both lines should provide us with the exact distribution of each line tracers in the future.
4.2.1 The Nucleus of NGC 4038/9
The mean 12CO (3–2)/(1–0) ratio of NGC 4038 is 0.6 0.2, which is the highest among the averages of the five complexes. The spatial distribution of the ratio presented in Figure 9 shows that the ratio is 0.75 in the center, and this is two times higher than the ratios in the outer region. The regions with particularly high line ratios correspond well with the peaks of the MIR and NIR emission, qualitatively suggesting the correlation between high line ratio and embedded star formation. This is consistent with observations in nearby galaxies where the ratio appears to increase from the outer disk to the central regions (e.g. Israel, 2009; Wilson et al., 2009; Boone et al., 2011). A similar trend is also seen in the Milky Way galaxy, where the ratio increases from in the inner disk to towards the galactic center where the star formation is more active (Oka et al., 2007). Furthermore, signatures of more recent star formation activity in NGC 4038 are seen in optical and X-ray observations (e.g. Weedman et al., 2005; Zezas et al., 2006; Klaas et al., 2010), suggesting the coexistence of a variety of star clusters formed at various stages of the tidal activity.
The line ratio near the nuclear region of NGC 4039 is high (), despite a significantly lower mean ratio (0.50.1). The star formation activity in the central region of NGC 4039 is only modest (SFR = 0.50 M⊙ yr-1; Klaas et al., 2010), which is only half of the value derived in NGC 4038. The absence of the Brγ line in the stellar continuum is an indication of the dominance of old giants and red supergiants, further suggesting inactivity (Gilbert et al., 2000). Thus it is not likely that the high line ratio in the nuclear region is produced by current star formation.
The CO line could be collisionally heated and excited up to high energy levels if NGC 4039 harbors an AGN (Matsushita et al., 2004; Krips et al., 2011). A bright diffuse X-ray emission region is associated with the Ks-band nucleus within 220 pc, and also with the region with high line ratio. The radio continuum has a steep spectrum, which suggests non-thermal emission arising from supernova remnants (Neff & Ulvestad, 2000), or X-ray binaries (Zezas et al., 2002a, b). Furthermore, Brandl et al. (2009) found that the observed infrared continuum is consistent with a pure starburst model and concluded that the spectrum of the nucleus is produced by emission from dust that is heated by star formation alone. Thus, these multi-wavelength properties of NGC 4039 provide evidence against the presence of an AGN.
Another possible cause for the high line ratio is gas collision arising from violent gas kinematics. As shown in §3, the distribution of the CO (3–2) gas in NGC 4039 is composed of two main components; the nuclear concentration and the single-arm gas that appears to stream along the optical dust lane. Although the spatial resolution of the ratio image is limited to 500 pc, the region where the two components connect is consistent with the position that displays the highest ratio. The properties of the molecular complexes located at this region are markedly different from the average properties of NGC 4039, where the radii of the two molecular complexes are larger. In addition, the velocity dispersion of the molecular complexes in this regions are larger than the average of NGC 4039. Furthermore, the recession velocities (see Table LABEL:tb:clump) of these molecular complexes are consistent with the velocity of the clouds with the highest ratio. This observational evidence suggests a scenario where the molecular gas flows into the central disk (see §4.4), collides, and results in high excitation. Future high resolution observations of shock tracers is necessary to confirm this scenario.
4.2.2 The Overlap Region
The mean 12CO (3–2)/(1–0) ratio is 0.4 0.1 in Complex 1, 0.3 0.1 in Complex 2, and 0.5 0.1 in Complex 3. Although the average ratios are all consistent within the errors, gradients in the line ratio are seen in each complex (Figure 9), with a particularly steep gradient in Complex 3. Zhang et al. (2010) derived the FUV – 24 m broad-band spectral energy distribution (SED) and found that the UV/optical emission gradually become redder and weaker from Complex 1 (which corresponds to their region 6) to Complex 3 (region 4). This suggests that the ratio of young star population ( 10 Myr) to intermediate/old star population ( 10 Myr) increases from Complex 1 to 3. The continuum emission at MIR wavelengths in Complex 1 (SGMC 1 in Wilson et al. (2000)) and Complex 2 (SGMC 2) are flat, but Complex 3 (SGMC 3–5) contains strong and rising continuum emission (Wilson et al., 2000). The mid-infrared continuum emission in Complex 3 can be produced by massive O stars. Similarly, strong FIR continuum emission seen in Complex 3 (K1) has the highest SFR and SFE and maximum dust temperature (Klaas et al., 2010). This observational evidence suggests that Complex 3 is likely to be a very young complex and star forming histories are different from Complex 1 and 2. This is consistent with the higher CO line ratio in Complex 3.
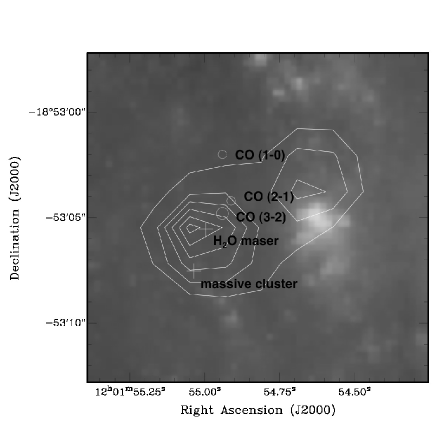
The overlap region of the Antennae was observed with a single pointing in the 12CO (2–1) line at the SMA. From our analysis of the archival data, the distribution of the CO (3–2) and CO (2–1) maps are similar overall, but subtle differences are seen particularly in Complex 3. We found that the CO (2–1) peak in Complex 3 is located 100 pc north of the CO (3–2) peak, and the CO (1–0) peak is further displaced toward the north by 200 pc as shown in Figure 10. Brogan et al. (2010) detected an H2O maser within 100 pc of the CO (3–2) peak, and estimated from the VLA 3.6 cm continuum that the ionized gas is equivalent to 2000 – 5000 O∗ stars. Furthermore, the most massive cluster is embedded 350 pc southeast of Complex 3 (Whitmore et al., 2010). These are observational indicators that suggest the earliest stages of active star formation in the southern part of Complex 3 are entangled with more mature clusters that were formed 1 Myr ago. The high line ratio coincides with this region, suggesting that heating of the interstellar medium due to UV emission from newly born stars is responsible for collisionally exciting the CO gas to the =3–2 level.
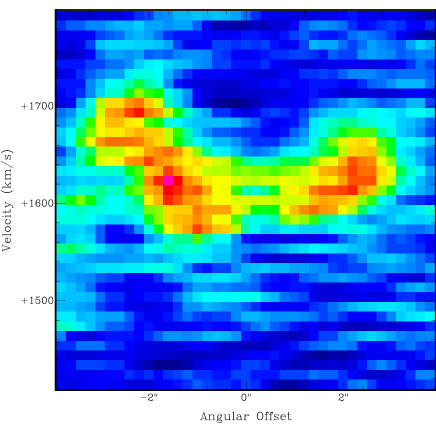
4.3. Evidence for a Counter Rotating Nuclear Disk and Gas Inflow Toward NGC 4039
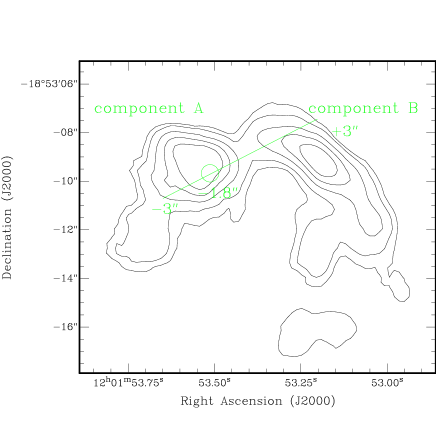
The spatial distribution of the CO (3–2) emission in NGC 4039 (Figure 11 (left)) clearly shows two distinct molecular gas components that are separated by a projected distance of 560 pc. One component (component A; see Figure 11(left)) is apparently distributed around the nucleus and the other component (component B; see 11(left)) is distributed along the dust lane seen in the B-band image. The masses of components A and B are 5.2 108 and 4.5 108 M☉, respectively. The PV diagram of component A is shown in Figure 11 (right). The systemic recession velocity of NGC 4039 determined from our data is 1610 km s-1. The mean gas velocity of component A is blue- and redshifted by -50 and +30 km s-1 with respect to the Ks-band nucleus to the west and east side, respectively. Then assuming that component A is in the plane of the galaxy, this suggests that component A rotates around the galactic center of NGC 4039. We compare the dynamical mass and molecular mass of component A and find that the disk is dynamically stable, assuming that component A is a disk with a rotation velocity of 40 km s-1 and the disk inclination of = 60 (Toomre & Toomre, 1972). Downes & Solomon (1998) found a high occurrence of rotating 100 pc scale nuclear disks or rings from their molecular gas observations of ULIRGs. While the kinematic signature of a disk in NGC 4039 is less obvious than the ULIRGs in Downes & Solomon (1998) mainly because of a lower S/N ratio, presence of such nuclear disks may be a common phenomenon in the nuclear regions of colliding systems. A clear characteristic seen in NGC 4039 is that this component appears to rotate in the opposite direction from the galactic rotation defined by the direction of the spiral arms seen in optical images, which is defined from the direction of the trailing arm.
-body/smoothed particle hydrodynamic (SPH) simulation performed by Barnes & Hernquist (1996) predicts that a non-axisymetric potential can enhance the stellar torques exerted on the gas, causing gas inflows into the central regions in a merging process. These inflows may be kinematically distinct, as shown in the simulation studies by Iono et al. (2004). Component B shows the predicted kinematic signature of gas streaming along the arm ( 1 kpc), as shown in Figure 3. In addition, a high line ratio is seen at the location where Components A and B connect and the velocity dispersion of the molecular complexes are larger than the average of NGC 4039 as shown in §4.2.1. If Component B is indeed related to gas inflow, it is then possible that high gas excitation is caused by collisions between the inflowing gas component and the counter-rotating disk.
4.4. A possible molecular gas bubble in NGC 4038
The high resolution image (; Figure 2) allows us a detailed investigation of the molecular gas surrounding the nuclear region of NGC 4038. The molecular and virial masses of the central component are 3.2 108 M☉ and 2.0 108 M☉, respectively, suggesting that this component is gravitationally bound. Furthermore, by using Clumpfind on the high resolution data, we identified 11 molecular complexes that are mostly located 100 pc north of the galaxy center. The virial ratios for all of the clumps are less than unity, suggesting gravitationally bound clouds.
A nonthermal radio source with an energy equivalent to 115 times Cassiopeia A is located 110 pc north of the Ks-band peak (square sign in Figure 2) (Neff Ulvestad 2000). The distribution of CO (3–2) appears to form an arc centered around this radio source, with an apparent absence of significant CO (3–2) emission at the radio source. Similar molecular bubbles have been found in M 82 (e.g. Matsushita et al., 2004) and NGC 253 (Sakamoto et al., 2006). They attributed it to supernova blasts that swept away the molecular gas from the surrounding medium. Following Sakamoto et al. (2006), we estimated the kinetic energy needed to create the bubble using, , where ( is the hydrogen number density of the prebubble medium, and is the the atomic mass of hydrogen) is the initial mass density of the interstellar matter, is the size of a bubble, and is the expansion velocity of molecular gas. We derived from the distance between the nonthermal radio source and the CO (3–2) peak in Figure 2, which is 110 pc, and used the offset from systemic velocity at the CO (3–2) peak as of 30 km s-1. The estimated energy is J, adopting cm-3, which is a typical density of interstellar matter in the Galaxy and nearby galaxies. This energy corresponds to the kinetic energy released by 10 – 100 supernova explosions and also to the released energy estimated from the radio continuum. Thus a high frequency of recent supernova explosions is a possible cause of the apparent absence in the CO (3–2) distribution.
5. Summary
We present interferometric 12CO ( = 3–2) observations toward main bodies of the Antennae galaxies (NGC 4038/9) obtained using the SMA. The image shows gas concentration at both nuclei and the overlap region, and the emission is roughly distributed along the dust lanes seen in the B-band image. The integrated intensity over main body of the Antennae is 4.4 103 Jy km s-1 and the overlap region contains almost half of the emission. We detect using the Clumpfind algorithm 57 molecular complexes, 33 of which located in the overlap region. Adopting a galactic CO-to-H2 conversion factor and the estimated CO (3–2)/(1–0) line intensity ratios, the molecular complexes appear to have masses of 107 – 108 M☉. While we find that 58 (33/57) of the spatially resolved GMAs are located in the overlap region, only are spatially coincident with the star clusters detected in the optical and/or NIR images, suggesting that the bulk of the CO (3–2) emission traces the regions with very recent or near future star formation activity.
We find that the GMAs in the Antennae do not follow the well known radius-velocity dispersion relation obeyed by GMCs in Milky Way and other nearby galaxies. The molecular complexes with large radii are distributed in NGC 4038 and the southern part of the overlap region, where the star formation rates are high. Therefore, the larger molecular complexes, which are possibly formed by clustering around local peaks of the gravitational potential wells, may be used as the signposts of current dusty star forming regions. In NGC 4039, the molecular complexes with the larger velocity dispersion (25–35 km s-1) are located within 500 pc of the nucleus and those with the smaller velocity dispersion (10–25 km s-1) are located in the gas arm.
We estimated the CO (3–2)/(1–0) brightness temperature ratio using the SMA CO (3–2) and OVRO CO (1–0) data, assuming a same beam filling factor for both transitions. The mean ratios range between 0.3 and 0.6, which suggests that, on average, the CO line in the Antennae is not thermalized up to = 3–2. However the line ratios in two nuclei and the southern of the overlap region are close to unity in some localized regions. The high ratio in the nucleus of NGC 4038 and the overlap region is likely caused by star formation because the line ratio becomes high for clouds that are close to active star forming regions. In contrast, the nucleus of NGC 4039 has a relatively inactive star forming region. One possibility for causing the high line ratio in the nucleus of NGC 4039 is a presence of a hidden AGN. The other is gas collision between the inflowing gas and the counter-rotating central disk.
The Atacama Large Millimeter/Submillimeter Array (ALMA) will begin scientific observations in the second half of 2011. The Antennae is one of the best targets observed using the ALMA because it passes near zenith at the ALMA site and the beam pattern will be a nearly circular shape. Using the superb sensitivity and angular resolutions offered by ALMA, we can observe other molecular lines including high- CO in the Antennae and study the properties of molecular gas quantitatively.
References
- Barnes & Hernquist (1996) Barnes, J. E., & Hernquist, L. 1996, ApJ, 471, 115
- Bigiel et al. (2010) Bigiel, F., Bolatto, A. D., Leroy, A. K., Blitz, L., Walter, F., Rosolowsky, E. W., Lopez, L. A., & Plambeck, R. L. 2010, ApJ, 725, 1159
- Boone et al. (2011) Boone, F., et al. 2011, A&A, 525, A18
- Brandl et al. (2009) Brandl, B. R., et al. 2009, ApJ, 699, 1982
- Brogan et al. (2010) Brogan, C., Johnson, K., & Darling, J. 2010, ApJ, 716, L51
- Bundy et al. (2009) Bundy, K., Fukugita, M., Ellis, R. S., Targett, T. A., Belli, S., & Kodama, T. 2009, ApJ, 697, 1369
- Downes & Solomon (1998) Downes, D., & Solomon, P. M. 1998, ApJ, 507, 615
- Fabbiano et al. (2003) Fabbiano, G., Zezas, A., King, A. R., Ponman, T. J., Rots, A., & Schweizer, F. 2003, ApJ, 584, L5
- Fazio et al. (2004) Fazio, G. G., et al. 2004, ApJS, 154, 10
- Fukui et al. (2008) Fukui, Y., et al. 2008, ApJS, 178, 56
- Gao et al. (2001) Gao, Y., Lo, K. Y., Lee, S.-W., & Lee, T.-H. 2001, ApJ, 548, 172
- Gilbert et al. (2000) Gilbert, A. M., et al. 2000, ApJ, 533, L57
- Gil de Paz et al. (2007) Gil de Paz, A., et al. 2007, ApJS, 173, 185
- Greve et al. (2009) Greve, T. R., Papadopoulos, P. P., Gao, Y., & Radford, S. J. E. 2009, ApJ, 692, 1432
- Harris et al. (2010) Harris, A. I., Baker, A. J., Zonak, S. G., Sharon, C. E., Genzel, R., Rauch, K., Watts, G., & Creager, R. 2010, ApJ, 723, 1139
- Ho et al. (2004) Ho, P. T. P., Moran, J. M., & Lo, K. Y. 2004, ApJ, 616, L1
- Iono et al. (2004) Iono, D., Yun, M. S., & Mihos, J. C. 2004, ApJ, 616, 199
- Iono et al. (2009) Iono, D., et al. 2009, ApJ, 695, 1537
- Israel (2009) Israel, F. P. 2009, A&A, 506, 689
- Klaas et al. (2010) Klaas, U., Nielbock, M., Haas, M., Krause, O., & Schreiber, J. 2010, A&A, 518, L44
- Koester et al. (1994) Koester, B., Stoerzer, H., Stutzki, J., & Sternberg, A. 1994, A&A, 284, 545
- Krips et al. (2011) Krips, M., et al. 2011, ApJ, 736, 37
- Lada & Lada (2003) Lada, C. J., & Lada, E. A. 2003, ARA&A, 41, 57
- Larson (1981) Larson, R. B. 1981, MNRAS, 194, 809
- Mao et al. (2010) Mao, R.-Q., Schulz, A., Henkel, C., Mauersberger, R., Muders, D., & Dinh-V-Trung 2010, ApJ, 724, 1336
- Matsushita et al. (2004) Matsushita, S., et al. 2004, ApJ, 616, L55
- Mengel et al. (2002) Mengel, S., Lehnert, M. D., Thatte, N., & Genzel, R. 2002, A&A, 383, 137
- Mengel et al. (2005) Mengel, S., Lehnert, M. D., Thatte, N., & Genzel, R. 2005, A&A, 443, 41
- Mihos et al. (1993) Mihos, J. C., Bothun, G. D., & Richstone, D. O. 1993, ApJ, 418, 82
- Neff & Ulvestad (2000) Neff, S. G., & Ulvestad, J. S. 2000, AJ, 120, 670
- Nikola et al. (1998) Nikola, T., Genzel, R., Herrmann, F., Madden, S. C., Poglitsch, A., Geis, N., Townes, C. H., & Stacey, G. J. 1998, ApJ, 504, 749
- Oka et al. (2007) Oka, T., Nagai, M., Kamegai, K., Tanaka, K., & Kuboi, N. 2007, PASJ, 59, 15
- Onodera (2009) Onodera, S. 2009, Ph.D. Thesis, The University of Tokyo
- Rieke et al. (2004) Rieke, G. H., et al. 2004, ApJS, 154, 25
- Rosolowsky & Blitz (2005) Rosolowsky, E., & Blitz, L. 2005, ApJ, 623, 826
- Rosolowsky et al. (2003) Rosolowsky, E., Engargiola, G., Plambeck, R., & Blitz, L. 2003, ApJ, 599, 258
- Sakamoto et al. (2006) Sakamoto, K., et al. 2006, ApJ, 636, 685
- Sanders & Mirabel (1996) Sanders, D. B., & Mirabel, I. F. 1996, ARA&A, 34, 749
- Schulz et al. (2007) Schulz, A., Henkel, C., Muders, D., Mao, R. Q., Röllig, M., & Mauersberger, R. 2007, A&A, 466, 467
- Schweizer et al. (2008) Schweizer, F., et al. 2008, AJ, 136, 1482
- Solomon & Barrett (1991) Solomon, P. M., & Barrett, J. W. 1991, Dynamics of Galaxies and Their Molecular Cloud Distributions, 146, 235
- Solomon et al. (1987) Solomon, P. M., Rivolo, A. R., Barrett, J., & Yahil, A. 1987, ApJ, 319, 730
- Solomon & Vanden Bout (2005) Solomon, P. M., & Vanden Bout, P. A. 2005, ARA&A, 43, 677
- Toomre (1977) Toomre, A. 1977, in The Evolution of Galaxies and Stellar Populations, ed. B.M. Tinsley & R.B. Larson (New Haven: Yale Univ.), 401
- Toomre & Toomre (1972) Toomre, A., & Toomre, J. 1972, ApJ, 178, 623
- van der Tak et al. (2007) van der Tak, F. F. S., Black, J. H., Schöier, F. L., Jansen, D. J., & van Dishoeck, E. F. 2007, A&A, 468, 627
- Weedman et al. (2005) Weedman, D. W., et al. 2005, ApJ, 633, 706
- Whitmore et al. (2010) Whitmore, B. C., et al. 2010, AJ, 140, 75
- Whitmore et al. (1999) Whitmore, B. C., Zhang, Q., Leitherer, C., Fall, S. M., Schweizer, F., & Miller, B. W. 1999, AJ, 118, 1551
- Williams et al. (1994) Williams, J. P., de Geus, E. J., & Blitz, L. 1994, ApJ, 428, 693
- Wilson et al. (2000) Wilson, C. D., Scoville, N., Madden, S. C., & Charmandaris, V. 2000, ApJ, 542, 120
- Wilson et al. (2009) Wilson, C. D., et al. 2009, ApJ, 693, 1736
- Zezas et al. (2006) Zezas, A., Fabbiano, G., Baldi, A., Schweizer, F., King, A. R., Ponman, T. J., & Rots, A. H. 2006, ApJS, 166, 211
- Zezas et al. (2002a) Zezas, A., Fabbiano, G., Rots, A. H., & Murray, S. S. 2002, ApJ, 577, 710
- Zezas et al. (2002b) Zezas, A., Fabbiano, G., Rots, A. H., & Murray, S. S. 2002, ApJS, 142, 239
- Zhang et al. (2010) Zhang, H.-X., Gao, Y., & Kong, X. 2010, MNRAS, 401, 1839
- Zhu et al. (2003) Zhu, M., Seaquist, E. R., & Kuno, N. 2003, ApJ, 588, 243


| RA (J2000) | Dec (J2000) | |
|---|---|---|
| FOV 1 | 12:01:53.45 | -18:53:12.40 |
| FOV 2 | 12:01:54.61 | -18:53:08.00 |
| FOV 3 | 12:01:55.46 | -18:52:55.98 |
| FOV 4 | 12:01:55.05 | -18:52:43.96 |
| FOV 5 | 12:01:53.01 | -18:52:01.68 |
| regions | radius | velocity dispersion |
|---|---|---|
| (NGC 4038, NGC 4039) | 0.002 | 0.771 |
| (NGC 4038, overlap region) | 0.199 | 0.664 |
| (NGC 4039, overlap region) | 0.006 | 0.973 |
| (NGC 4038, the southern part of the overlap region) | 0.975 | 0.675 |
| (NGC 4039, the southern part of the overlap region) | 0.017 | 0.997 |
| mean ratio | |
|---|---|
| NGC 4038 | 0.6 0.2 |
| NGC 4039 | 0.5 0.1 |
| Complex 1 | 0.4 0.1 |
| Complex 2 | 0.3 0.1 |
| Complex 3 | 0.5 0.1 |
Appendix A Multiwavelength Images
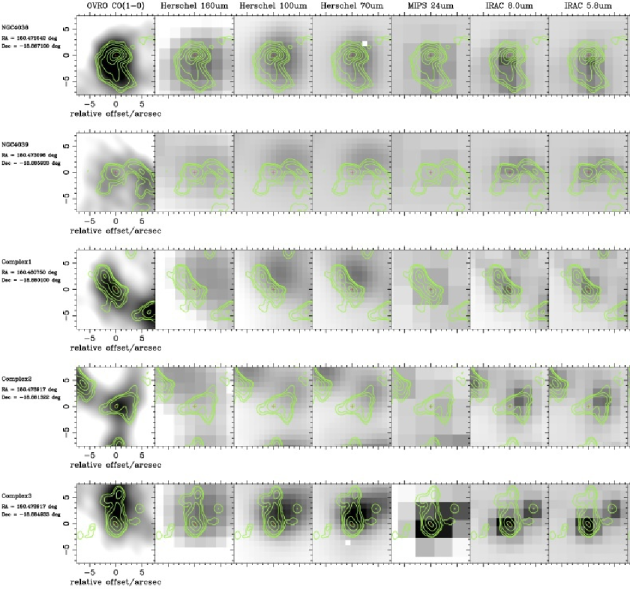
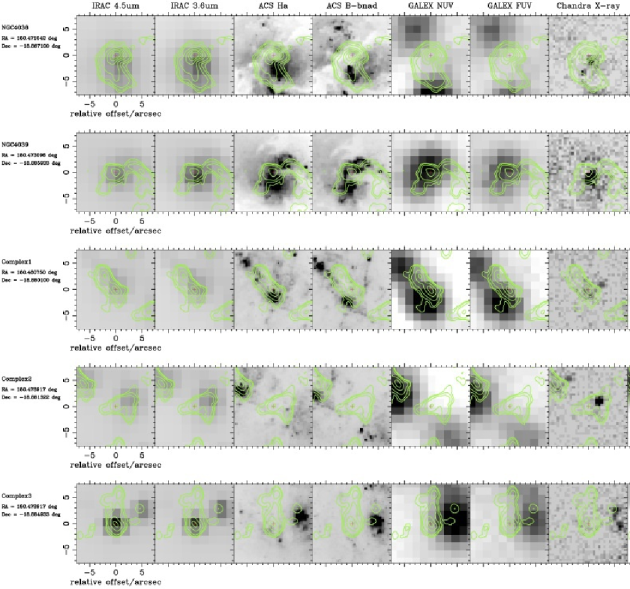
We compare the CO (3–2) map with multiwavelength images from radio and to X-ray. Figure A.1 shows the CO (3–2) contour maps of five regions (NGC 4038, NGC 4039, Complex 1, Complex 2, and Complex 3) overlaid on 14 different images.
The CO (1–0) map was taken with the OVRO interferometer by Wilson et al. (2000). The strongest emission in all regions is located in NGC 4038 and the emission in Complex 2 is strongest in the overlap region. Klaas et al. (2010) conducted FIR observations at 70, 100 and 160 m using the Herschel-PACS. The brightest emission in three bands comes from Complex 3. Complex 1 and Complex 2 together become the brightest area in the 160 m map. The 24 m and four near-infrared (NIR) at 3.6, 4.5, 5.8, and 8.0 m images were obtained with the MIPS (Rieke et al., 2004) and the IRAC (Fazio et al., 2004) on board the Spitzer Space Telescope, respectively. We use the basic calibrated data obtained using the LEOPARD software. The strongest emission in all bands, especially 24 m, is located in Complex 3. The H image (F656N), and the B-band image (F435W) have been observed using the ACS on board the HST (Whitmore et al., 2010). We use the archival data obtained from the MAST (Multimission Archive at STScI). There is no optically bright emission in Complex 2 and Complex 3. Both the far-ultraviolet (FUV; 1516 ) and the near-ultraviolet (NUV; 2267 ) images were taken with the Galaxy Evolution Explorer (GALEX) Ultraviolet Atlas of Nearby Galaxies distributed by Gil de Paz et al. (2007). The strong UV emission is detected west of the peak in Complex 3, where the bright optical, NIR and MIR emission is also observed. We obtained the archival X-ray image which Fabbiano et al. (2003) observed with Chandra. The bright X-ray emission is associated with the nucleus of NGC 4039.
Appendix B Catalog of the Molecular Complexes
| Table B.1 – The molecular complexes | |||||||
|---|---|---|---|---|---|---|---|
| ID | RA (J2000) | Dec (J2000) | |||||
| [h m s] | [∘ ′ ′′] | [km s-1] | [pc] | [km s-1] | [ M⊙] | [ M⊙] | |
| 1 | 12 01 55.36 | -18 52 49 | 1414 | 130 | 21 | 16 | 2.6 |
| 2 | 12 01 55.53 | -18 52 47 | 1514 | 242 | 22 | 30 | 5.3 |
| 3 | 12 01 55.37 | -18 52 48 | 1374 | 157 | 22 | 15 | 3.4 |
| 4 | 12 01 55.42 | -18 52 49 | 1504 | 126 | 16 | 13 | 1.5 |
| 5 | 12 01 55.53 | -18 52 45 | 1364 | 162 | 14 | 8.2 | 1.4 |
| 6 | 12 01 55.50 | -18 52 45 | 1394 | 146 | 35 | 8.2 | 8.1 |
| 7 | 12 01 55.30 | -18 52 51 | 1464 | 180 | 25 | 4.9 | 5.1 |
| 8 | 12 01 55.38 | -18 52 48 | 1464 | 130 | 27 | 4.4 | 4.4 |
| 9 | 12 01 55.48 | -18 52 52 | 1474 | 110 | 16 | 1.5 | 1.4 |
| 10 | 12 01 55.38 | -18 52 51 | 1364 | 151 | 18 | 2.4 | 2.3 |
| 11 | 12 01 54.96 | -18 52 53 | 1464 | 181 | 21 | 30 | 3.5 |
| 12 | 12 01 54.74 | -18 52 52 | 1444 | 205 | 24 | 24 | 5.4 |
| 13 | 12 01 54.78 | -18 52 55 | 1604 | 185 | 29 | 12 | 7.0 |
| 14 | 12 01 54.78 | -18 52 53 | 1524 | 116 | 28 | 5.0 | 4.0 |
| 15 | 12 01 54.77 | -18 52 53 | 1544 | 190 | 34 | 6.6 | 9.8 |
| 16 | 12 01 54.77 | -18 52 57 | 1644 | 92 | 9 | 2.6 | 0.34 |
| 17 | 12 01 55.01 | -18 52 53 | 1564 | 139 | 33 | 3.6 | 7.0 |
| 18 | 12 01 55.12 | -18 52 54 | 1504 | 153 | 22 | 7.7 | 3.2 |
| 19 | 12 01 55.00 | -18 53 06 | 1494 | 239 | 31 | 30 | 10 |
| 20 | 12 01 54.92 | -18 53 03 | 1554 | 208 | 28 | 15 | 7.2 |
| 21 | 12 01 55.09 | -18 53 02 | 1514 | 129 | 12 | 4.0 | 0.87 |
| 22 | 12 01 54.68 | -18 53 03 | 1454 | 263 | 17 | 6.3 | 3.4 |
| 23 | 12 01 54.89 | -18 53 00 | 1584 | 143 | 11 | 3.5 | 0.81 |
| 24 | 12 01 54.92 | -18 53 00 | 1514 | 137 | 20 | 5.1 | 2.5 |
| 25 | 12 01 55.02 | -18 53 01 | 1504 | 105 | 22 | 4.4 | 2.3 |
| 26 | 12 01 54.96 | -18 53 08 | 1614 | 243 | 13 | 6.0 | 1.9 |
| 27 | 12 01 54.96 | -18 53 08 | 1584 | 203 | 36 | 4.9 | 12 |
| 28 | 12 01 54.66 | -18 53 05 | 1474 | 226 | 31 | 7.3 | 9.9 |
| 29 | 12 01 55.18 | -18 52 40 | 1574 | 348 | 15 | 19 | 3.4 |
| 30 | 12 01 54.66 | -18 52 45 | 1584 | 251 | 21 | 7.8 | 4.9 |
| 31 | 12 01 54.44 | -18 52 43 | 1614 | 147 | 9 | 1.3 | 0.57 |
| 32 | 12 01 54.26 | -18 53 08 | 1414 | 132 | 16 | 4.6 | 1.5 |
| 33 | 12 01 54.33 | -18 53 08 | 1454 | 203 | 15 | 7.1 | 2.1 |
| 34 | 12 01 53.16 | -18 52 02 | 1624 | 256 | 29 | 61 | 10 |
| 35 | 12 01 53.22 | -18 52 04 | 1584 | 199 | 24 | 34 | 5.0 |
| 36 | 12 01 53.17 | -18 52 06 | 1624 | 273 | 26 | 31 | 8.5 |
| 37 | 12 01 53.49 | -18 52 06 | 1634 | 218 | 25 | 4.6 | 6.0 |
| 38 | 12 01 52.61 | -18 51 59 | 1714 | 93 | 10 | 1.6 | 0.42 |
| 39 | 12 01 53.26 | -18 52 04 | 1674 | 225 | 22 | 7.6 | 4.8 |
| 40 | 12 01 52.97 | -18 51 60 | 1634 | 206 | 27 | 4.2 | 6.8 |
| 41 | 12 01 53.18 | -18 52 06 | 1684 | 217 | 12 | 3.0 | 1.4 |
| 42 | 12 01 52.85 | -18 52 06 | 1634 | 180 | 13 | 3.1 | 1.5 |
| 43 | 12 01 52.76 | -18 52 07 | 1634 | 89 | 6 | 1.3 | 0.13 |
| 44 | 12 01 53.65 | -18 53 09 | 1604 | 190 | 31 | 21 | 8.1 |
| 45 | 12 01 53.32 | -18 53 09 | 1604 | 107 | 31 | 12 | 4.6 |
| 46 | 12 01 53.33 | -18 53 13 | 1624 | 122 | 18 | 5.7 | 1.8 |
| 47 | 12 01 53.65 | -18 53 11 | 1684 | 130 | 28 | 7.4 | 4.5 |
| 48 | 12 01 53.21 | -18 53 11 | 1644 | 120 | 28 | 8.1 | 4.4 |
| 49 | 12 01 53.45 | -18 53 09 | 1584 | 178 | 33 | 10 | 8.6 |
| 50 | 12 01 53.16 | -18 53 12 | 1704 | 85 | 16 | 2.6 | 1.0 |
| 51 | 12 01 53.17 | -18 53 12 | 1684 | 113 | 24 | 5.2 | 2.8 |
| 52 | 12 01 53.25 | -18 53 18 | 1724 | 142 | 20 | 2.2 | 2.6 |
| 53 | 12 01 53.36 | -18 53 17 | 1704 | 120 | 10 | 2.8 | 0.55 |
| 54 | 12 01 53.81 | -18 53 13 | 1644 | 156 | 19 | 3.3 | 2.6 |
| 55 | 12 01 53.34 | -18 53 11 | 1604 | 119 | 17 | 3.1 | 1.5 |
| 56 | 12 01 53.06 | -18 53 15 | 1704 | 111 | 12 | 1.9 | 0.77 |
| 57 | 12 01 53.28 | -18 53 16 | 1684 | 115 | 18 | 2.1 | 1.6 |