Images of the Extended Outer Regions of the Debris Ring Around HR 4796 A$\star$$\star$affiliation: Based on data collected at Subaru Telescope, which is operated by the National Astronomical Observatory of Japan.
Abstract
We present high-contrast images of HR 4796 A taken with Subaru/HiCIAO in -band, resolving the debris disk in scattered light. The application of specialized angular differential imaging methods (ADI) allows us to trace the inner edge of the disk with high precision, and reveals a pair of “streamers” extending radially outwards from the ansae. Using a simple disk model with a power-law surface brightness profile, we demonstrate that the observed streamers can be understood as part of the smoothly tapered outer boundary of the debris disk, which is most visible at the ansae. Our observations are consistent with the expected result of a narrow planetesimal ring being ground up in a collisional cascade, yielding dust with a wide range of grain sizes. Radiation forces leave large grains in the ring and push smaller grains onto elliptical, or even hyperbolic trajectories. We measure and characterize the disk’s surface brightness profile, and confirm the previously suspected offset of the disk’s center from the star’s position along the ring’s major axis. Furthermore, we present first evidence for an offset along the minor axis. Such offsets are commonly viewed as signposts for the presence of unseen planets within a disk’s cavity. Our images also offer new constraints on the presence of companions down to the planetary mass regime (9 at 05, 3 at 1″).
Subject headings:
circumstellar matter — planetary systems — techniques: high angular resolution — stars: individual (HR 4796 A)1. Introduction
Vega-type debris disks were first identified by infrared (IR) excesses around nearby main sequence stars (Aumann et al., 1984). The dust content of these second-generation disk systems is believed to be continuously replenished via collisional breakup of remnant planetesimals (cf. Wyatt 2008).
Since the imaging of the Pic system (Smith & Terrile, 1984), nearly two dozen nearby debris disks have been spatially resolved. The morphological appearance of resolved debris disks is predicted to be influenced by interactions between dust in the disk and nearby planets (Ozernoy et al., 2000; Kuchner & Holman, 2003), the local interstellar medium (Maness et al., 2009), recent stellar flybys and binary companions (Wyatt et al., 1999), mutual grain collisions (Thébault & Wu, 2008), and interaction of dust with residual gas (Klahr & Lin, 2005). Many resolved systems exhibit all morphological structures predicted by these mechanisms (Schneider et al., 1999; Kalas et al., 2005; Golimowski et al., 2006; Kalas et al., 2008). The observable morphology of resolved, optically thin debris disks is also wavelength dependent, as different bandpasses sample different grain size distributions (Wyatt, 2006).
HR 4796 A (catalog ) is a young (8–10 Myr; Stauffer et al., 1995), nearby (72.8 1.7 pc; van Leeuwen, 2007), A0V-type star first identified as a debris disk system from an IR excess observed with IRAS (Jura, 1991). It has a co-moving M-type stellar companion at a separation of 77 (Jura et al., 1993). The HR 4796 A debris disk has been spatially resolved at numerous optical, infrared, and sub-millimeter wavelengths (e.g., Koerner et al., 1998; Jayawardhana et al., 1998; Schneider et al., 1999; Sheret et al., 2004; Hinkley et al., 2009; Schneider et al., 2009), appearing as a narrow, highly inclined belt with a radius of 105. Models suggest a dual dust population including gravitationally confined grains at 9–10 AU in addition to those imaged at 70 AU (Augereau et al., 1999), possibly involving radiationally evolved organic materials (Debes et al., 2008). Wahhaj et al. (2005) present multi-wavelength observations showing that the outer disk cannot be modeled as a single dust component; these authors adopt a two-component model with two different grain sizes. Here we present new ground-based near-infrared imaging data at high spatial resolution, revealing the tapered outer regions of the debris disk.
2. Observations and data reduction
Our observations of HR 4796 A were obtained with the Subaru Telescope on May 24, 2011, within the SEEDS survey (Strategic Exploration of Exoplanets and Disks with Subaru/HiCIAO, Tamura, 2009). The HiCIAO instrument (Hodapp et al., 2008) with a 20″20″ field of view and a plate scale of 9.500.02 mas/pixel was used. The image rotator operated in pupil-tracking mode to enable angular differential imaging (ADI, Marois et al., 2006). A sequence of 260 images was taken in -band with an exposure time of 10 s, for a total integration time of 43.3 min and a total field rotation of 23°. Weather conditions were good (seeing 05–08 in -band), and the AO188 adaptive optics system (Minowa et al., 2010) provided a FWHM of 6.5 pixels 62 mas.
The images were corrected for flatfield and field distortion (Suzuki et al., 2010). Stellar position was estimated in each frame by two different methods: (1) Fitting a Moffat profile to the PSF halo, and (2) triangulating between symmetrical pairs of static speckles. Both were consistent with an empirical drift model () plus measurement noise. The difference between the two sets of centroids showed no systematic behavior, and was consistent with incoherent combination of the two measurement noise sources. We therefore used the drift model for image registration, for an estimated centering accuracy of 0.3 pixels 2.9 mas in the co-added image.
ADI combined with the LOCI algorithm (Locally Optimized Combination of Images, Lafrenière et al., 2007) is currently the most successful ground-based imaging technique for the detection of planets (Marois et al., 2010; Lagrange et al., 2010; Currie et al., 2011) and substellar companions (Thalmann et al., 2009; Biller et al., 2010; Janson et al., 2011). Furthermore, it has proven useful in revealing high-contrast circumstellar disks (Thalmann et al., 2010; Buenzli et al., 2010).
We applied three implementations of the ADI technique to our data: (I) “Simple ADI”, consisting of subtracting a median background from the entire dataset before derotating and co-adding. This method causes the least amount of flux loss and is therefore useful for estimating the surface brightness profile of the disk. (II) “Aggressive LOCI”, using frame selection criteria of 0.5 FWHM (minimum differential field rotation between images to be used for mutual subtraction, to limit self-subtraction of physical sources) and an optimization region with an area of 300 PSF footprints. Although most of the disk signal is lost and negative over-subtraction effects appear, this method achieves excellent speckle suppression and provides the best constraints on point sources, such as planets. (III) “Conservative LOCI”, a compromise between the previous two methods, first described in Thalmann et al. (2010). This method preserves more disk flux than aggressive LOCI while achieving significantly better speckle subtraction than simple ADI. The resulting image proves ideal for deriving geometric parameters of the inner disk edge. Due to the dataset’s limited field rotation budget, we do not use an increased frame selection criterion to conserve more disk flux, as Thalmann et al. (2010) do. Instead, we enlarge the optimization area to 10,000 PSF footprints, lowering the impact of the disk signal on the optimization process, as first demonstrated in Buenzli et al. (2010). Unless otherwise noted, we use the default numerical and geometric LOCI settings as defined in Table 1 and Fig. 1 of Lafrenière et al. (2007).
3. Results
3.1. Imaging the debris disk
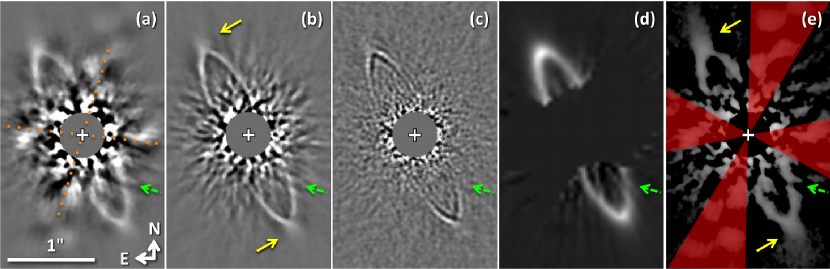
Figure 1 shows the results of applying the three ADI reduction methods to our data: Simple ADI in (a), conservative LOCI in (b), and aggressive LOCI in (c). In panel (d), we reprint the HST/STIS image by Schneider et al. (2009, Figure 8) for comparison. Starlight scattered from the disk is visible as a strongly projected ellipse in all images, down to stellocentric separations of 05 in simple ADI and 04 in LOCI. Differential imaging clearly resolves the inner edge of the disk.
While most of the flux concentrates around this edge, each ansa appears radially smeared out, extending a “streamer” outwards along the major axis. Similar streamers have been observed in deep ADI or roll subtraction images of other debris disks, such as HD 61005 (“The Moth”, Buenzli et al., 2010) and Fomalhaut (Kalas et al., 2010). They are thought to represent part of the thin, extended, tapered outer reaches of the debris disk, which are most detectable at the ansae. Oversubtraction makes them appear narrower than they are. In both simple ADI and LOCI, the flux at a given separation is unaffected by any flux at smaller separations (Marois et al., 2006; Lafrenière et al., 2007), thus the streamers cannot be artifacts caused by the bright ring further inwards.
Schneider et al. (2009) note a marginal flux deficit in the southwestern quadrant of the debris disk. Although there are some indications of substructure in the same location in our dataset (dashed green arrows), the S/N ratio is insufficient to confirm the existence of a physical disturbance in the disk.
3.2. Ring geometry from maximum regional merit fitting
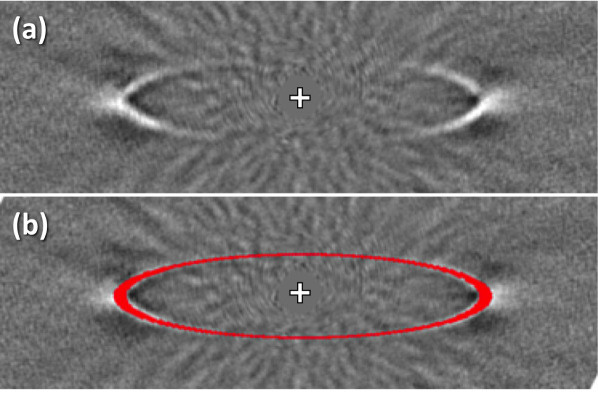
The crisp representation of the disk’s inner edge in the conservative LOCI image allows accurate measurement of its geometrical properties. For that purpose, we have devised the maximum regional merit technique, which is loosely based on the method of Buenzli et al. (2010).
First, we apply a median filter on the spatial scale of 5 pixels (1 ), which reduces the pixel-to-pixel noise while keeping larger edges and structures intact. We then convert the image into a signal-to-noise map (S/N; Figure 2a) by calculating the standard deviation in concentric annuli around the star and dividing the pixel values in each annulus by this noise level. The disk itself is masked during noise calculation. The S/N map emphasizes the well-resolved outer parts of the disk.
| Maximum merit ellipse size | ang. sep. | projected (AU) | ||
| Semimajor axis | 1087 | 0023 | 79.2 | 1.7 |
| Semiminor axis | 0248 | 0007 | 18.0 | 0.5 |
| Maximum merit ellipse orientation | degrees | |||
| Position angle | 26.4 | 0.5 | ||
| Inclination | 76.7 | 0.5 | ||
| Maximum merit ellipse center | ang. sep. (mas) | projected (AU) | ||
| (along RA) | 6.6 | 4.0 | 0.48 | 0.21 |
| (along Dec) | 22.1 | 4.8 | 1.61 | 0.28 |
| (along major axis) | 16.9 | 5.1 | 1.23 | 0.31 |
| (along minor axis) | 15.8 | 3.6 | 1.15 | 0.16 |
| Upper limits on planets | 5 contrast | Mass () | ||
| At 03 18 AU in proj. | 5.8 10-4 | 17 | ||
| At 05 36 AU in proj. | 1.2 10-4 | 9 | ||
| At 1″ 73 AU in proj. | 5.7 10-6 | 2.8 | ||
| At 2″ 146 AU in proj. | 8.6 10-7 | 1.4 | ||
| Notes. (1) Conversion from arcsec to projected AU assuming a distance of 72.8 pc; the uncertainty of 1.7 pc is not included in the errors. (2) Based on the model disk described in Section 4.1, the photometric peak-to-peak radius is 96% of the maximum merit semimajor axis; this would yield a value of consistent with Schneider et al. (2009). (3) Errors in are correlated; use the uncorrelated errors in instead. (4) The axes of the coordinate system are aligned with the disk’s major and minor axes, thus they are rotated counterclockwise from the RA/Dec coordinate system by . (5) Conversion from -band contrast via the COND evolutionary models (Allard et al., 2001; Baraffe et al., 2003), assuming an age of 8 Myr. | ||||
We then generate a large number of ellipses with randomized major and minor semi-axes , position angles , and center positions relative to the star . We assign a merit value to each set of parameters, defined as the mean value of the pixels in the S/N map that lie within an ellipse-shaped sampling area described by the numerical parameters. The sampling area for a given parameter set is defined as the area between two nested ellipses that share the same orientation and center but have semi-axes of and , respectively. We choose px, which results in a single-pixel thickness along the minor axis, and px, for a 7-pixel thickness along the major axis. The value for corresponds to the observed width of the high-flux areas in the ansae of the disk; this is to ensure that a well-fitted sampling ellipse will be delimited by strong gradients in the S/N image on all sides, and thus sensitive to displacement and scaling (Fig. 2b).
We find that this method yields more accurate results for our data than the conventional method of fitting of an ellipse to flux maxima in the ring (as applied to HST data by Schneider et al., 2009), since our data has finer spatial sampling but a higher photometric noise level than the HST data. The disk profile is flat around the flux maxima and thus vulnerable to noise, while the tracking of sharp gradients is robust and profits from the fine spatial sampling.
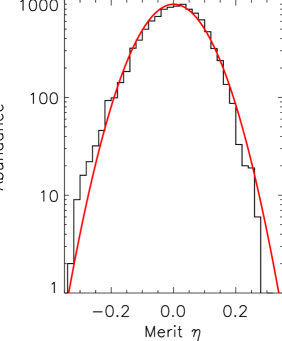
We find a maximum merit of . In order to estimate the noise inherent to this merit figure, we measure for sampling ellipses placed in the empty sky region 90° away from the position angle of the disk. We find a roughly Gaussian distribution (Fig. 2c) with a standard deviation and a mean value ( within the errors). We therefore define the family of “well-fitting” solutions as those satisfying , and the “best estimate” as the mean value of the well-fitting solution family.
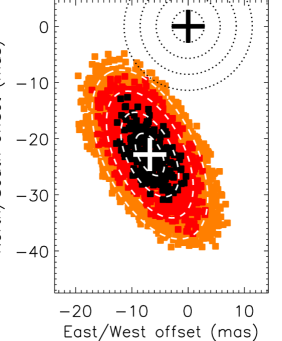
Figure 2d plots the spread of the center offset values of solutions within 1 , 2 , and 3 of the maximum merit value . The contours of those solution families are concentric ellipses with axes aligned along the debris ring’s axes, demonstrating approximately Gaussian error behavior. To further test the validity of this maximum regional merit technique, we produced 10 model disks (as discussed in Section 4.1) with random offsets from the star, injected them into the empty sky region in our data, reduced them with conservative LOCI, and retrieved the ellipse parameters as described above. Deviations between measured and real offset coordinates were consistently below , with an RMS of .
The best-estimate parameters and their errors, including both fitting errors and systematic errors from image registration and plate scale, are presented in Table 1. Most notably, we find that the ellipse center is offset along its major axis (towards the southwest) by 16.9 5.1 mas, deviating from the star’s position at 3.3 significance. Since the major axis is unaffected by foreshortening from projection along the line of sight, this translates directly into a physical distance of 1.2 0.3 AU, assuming an approximately circular cavity. Combined with Schneider et al. (2009)’s independent measurement of 19 6 mas (3.2 confidence), we can now confirm that HR 4796 A’s debris disk is offset from its star. Furthermore, our data suggest an offset along the minor axis of 15.8 3.6 mas in projection. If confirmed, this would correspond to a physical offset of 5 AU.
3.3. Constraints on planets
Aggressive LOCI reduction of our image data does not detect any planet candidates in the system, but imposes upper limits on the masses of potential unseen planets. We use the photometric calibration method described e.g. in Thalmann et al. (2011), estimating and correcting the separation-dependent partial flux loss from LOCI processing as described in Lafrenière et al. (2007), and converting the -band flux into planet mass using the COND evolutionary models (Allard et al., 2001; Baraffe et al., 2003). Table 1 lists the resulting 5 contrasts and planet masses for four separations. The noise is calculated in concentric annuli, and the spider artifacts are masked out for this purpose.
4. Modeling
4.1. Simple power-law model
In order to understand the morphology of our disk images and gauge their usefulness for deriving disk properties, we generate a model disk by calculating synthetic scattered light images of inclined rings, with a power-law distribution of the scattering cross section . We assume the inclination of the disk to be given by the axis ratio, and construct a Keplerian disk with a small but nonzero eccentricity to match our observed semi-major axis offset (1.2 AU, Table 1). The main free parameters of the disk model are the radial power-law slopes,
| (1) |
where is the radial distance to the star projected onto an ellipse with the desired geometry, is the semi-major axis, and , and is related to the surface density by . We use a Henyey-Greenstein phase function and assume it is the same throughout the disk. To compute images, we use the single-scattering radiative transfer code GRaTeR (Augereau et al., 1999) to compute synthetic images. This approach is valid for an optically thin disk.
Given the scope of this model, we do not attempt to fit but merely approximate the real debris disk. Our working parameters are , indicating a very steep inner edge, , and an asymmetry factor , implying a slight preference for forward scattering (cf. in Schneider et al. 2009; 0.03–0.06 in Debes et al. 2008).
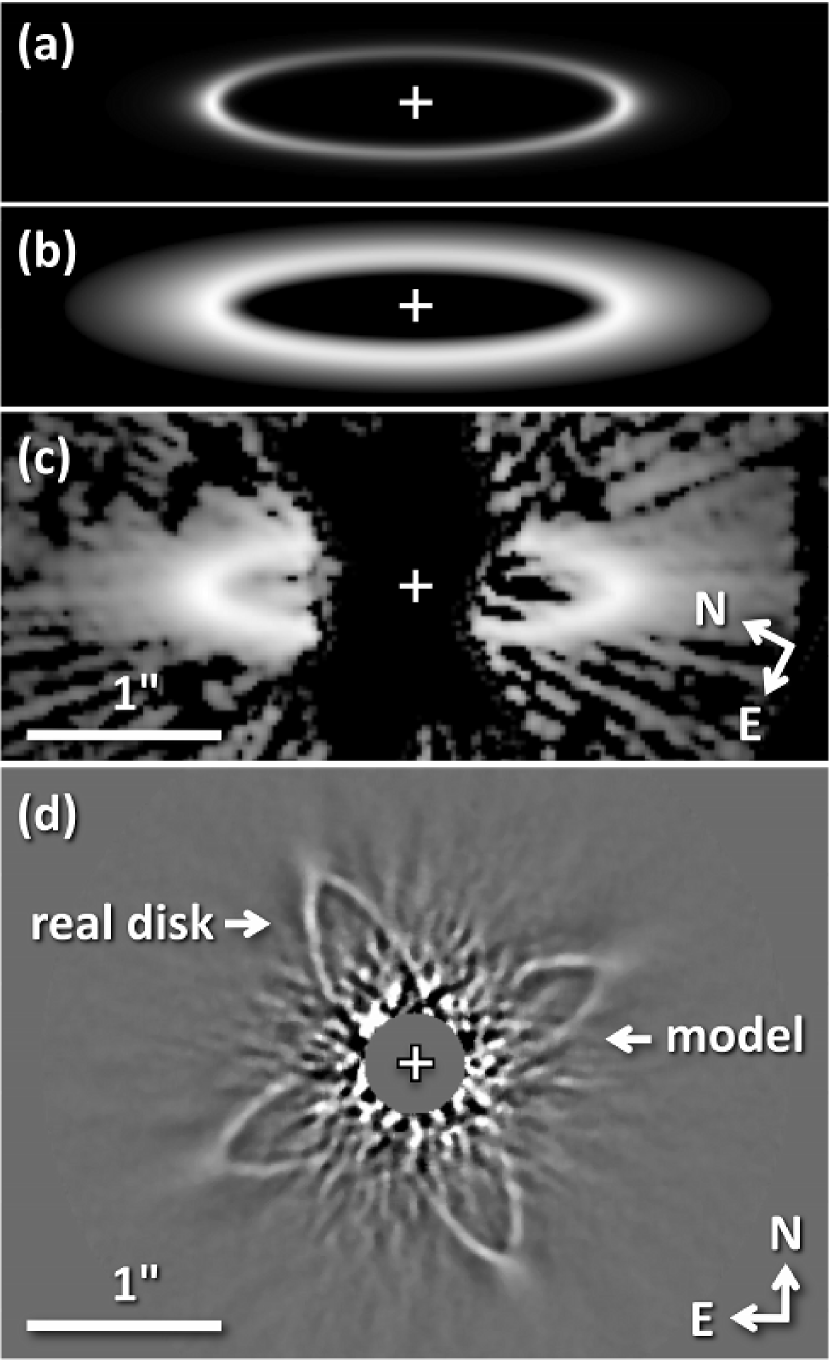
Figures 3a and 3b show the simulated scattered-light images of the model disk at linear and logarithmic intensity scale, respectively. In Figure 3c, we show the PSF-subtracted image of the HST/STIS data from Schneider et al. (2009) in logarithmic scale for comparison, revealing an extended halo beyond the bright ring that matches the expected morphology. Since this dataset is reduced with PSF subtraction rather than ADI, it suffers from virtually no flux loss, but the background is dominated by residual speckle noise.
To investigate the influence of ADI on disk flux, we inject the simulated scattered-light images of the model disk into our raw Subaru/HiCIAO dataset at a position angle offset by 90° with respect to the real disk. Figures 3d shows the results of conservative LOCI applied to this modified dataset. The two disks appear virtually indistinguishable, demonstrating that our simple model adequately explains the observed morphology.
4.2. Surface brightness profiles
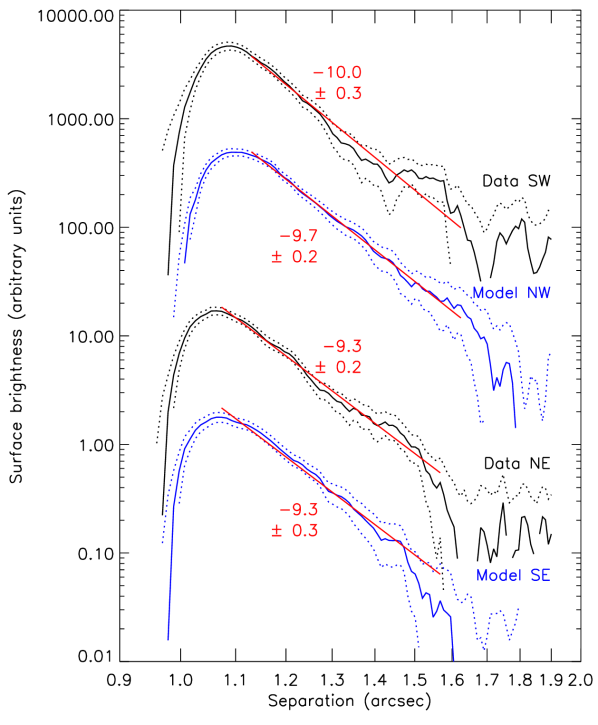
We explore the viability of using the simple ADI image for the purpose of determining the -band surface brightness profile of HR 4796 A’s debris disk. We extract a strip with a width of 11 pixels centered on the disk’s major axis from the intensity image, and collapse it along the minor axis. We repeat this for the simulated disk image. The results are shown in a log-log plot in Figure 4. The 1 error bounds are based on the radial noise profile in empty sky quadrants of the simple ADI image before injecting the model disk. Simple ADI preserves the model surface brightness profile. The real disk’s observed profile is consistent with a single power law.
5. Discussion
We have imaged and characterized the tapered outer boundary of HR 4796 A’s debris disk using ground-based angular differential imaging, and find that its -band surface brightness profile is well described by a simple power law with a slope around . Our observations are consistent with the expected result of a narrow planetesimal ring being ground up in a collisional cascade, yielding dust with a wide range of grain sizes. Radiation forces leave large grains in the ring and push smaller grains onto elliptical, or even hyperbolic trajectories. Simulations of such this process predict a smoothly tapered outer boundary, consistent with our findings (e.g., Krivov et al., 2006; Strubbe & Chiang, 2006). Wahhaj et al. (2005) have demonstrated that the disk cannot be modeled with a single dust grain size, implying that dust populations of varying grain size must be involved. The brightness slope is a result of changing dust densities and grain properties with distance. More detailed modeling is needed to relate the observed slope to the disk’s physical properties.
Using our maximum regional merit technique, we have corroborated the evidence for an offset between the debris disk’s inner edge and the star. The dynamical influence of unseen planets orbiting within the disk cavity is most commonly invoked to explain such offsets (e.g., Kalas et al., 2005; Thalmann et al., 2009; Buenzli et al., 2010, and references therein), and may be the cause of the proposed but unconfirmed intra-ring gap. Our confirmation of the ring offset also speaks against a dynamically cold source planetesimal population as proposed by Thébault & Wu (2008) as an alternative to the planet hypothesis for explaining the morphology of the ring. The planets may well be detectable with the upcoming next-generation high-contrast imaging facilities.
References
- Allard et al. (2001) Allard, F., Hauschildt, P. H., Alexander, D. R., Tamanai, A., & Schweitzer, A. 2001, ApJ, 556, 357
- Augereau et al. (1999) Augereau, J. C., Lagrange, A. M., Mouillet, D., Papaloizou, J. C. B., & Grorod, P. A. 1999, A&A, 348, 557
- Aumann et al. (1984) Aumann, H.H. et al. 1984, ApJL, 278, 23
- Baraffe et al. (2003) Baraffe, I., Chabrier, G., Barman, T. S., Allard, F., & Hauschildt, P. H. 2003, A&A, 402, 701
- Biller et al. (2010) Biller, B. A., et al. 2010, ApJ, 720, L82
- Buenzli et al. (2010) Buenzli, E., et al. 2010, A&A, 524, L1
- Currie et al. (2011) Currie, T., Thalmann, C., Matsumura, S., Madhusudhan, N., Burrows, A., & Kuchner, M. 2011, ApJ, 736, L33
- Debes et al. (2008) Debes, J.H., Weinberger, A.J., & Schneider, G. 2008, ApJL, 673, 191
- Golimowski et al. (2006) Golimowski, D.A. 2006, AJ, 131, 3109
- Hinkley et al. (2009) Hinkley, S., et al. 2009, ApJ, 701, 804
- Hodapp et al. (2008) Hodapp, K. W., et al. 2008, Proc. SPIE, 7014, 42
- Janson et al. (2011) Janson, M., et al. 2011, ApJ, 728, 85
- Jayawardhana et al. (1998) Jayawardhana, R. et al. 1998, ApJL, 503, 79
- Jura (1991) Jura, M. 1991, ApJ, 383, L79
- Jura et al. (1993) Jura, M., Zuckerman, B., Becklin, E.E., & Smith, R.C. 1993, ApJL, 418, 37
- Kalas et al. (2005) Kalas, P., Graham, J. R., & Clampin, M. 2005, Nature, 435, 1067
- Kalas et al. (2008) Kalas, P. et al. 2008, Science, 322, 1345
- Kalas et al. (2010) Kalas, P., Graham, J., Fitzgerald, M., & Clampin, M. 2010, In the Spirit of Lyot 2010,
- Klahr & Lin (2005) Klahr, H., & Lin, D. N. C. 2005, ApJ, 632, 1113
- Koerner et al. (1998) Koerner, D.W., Reller, M.E., Werner, M.W., & Backman, D.E. ApJL, 503, 83
- Krivov et al. (2006) Krivov, A. V., Löhne, T., & Sremčević, M. 2006, A&A, 455, 509
- Kuchner & Holman (2003) Kuchner, M. & Holman, M. 2003, ApJ, 588, 1110
- Lafrenière et al. (2007) Lafrenière, D., Marois, C., Doyon, R., Nadeau, D., & Artigau, É. 2007, ApJ, 660, 770
- Lagrange et al. (2010) Lagrange, A.-M., et al. 2010, Science, 329, 57
- Maness et al. (2009) Maness, H.L. et al. 2009, ApJ, 707, 1098
- Marois et al. (2006) Marois, C., Lafrenière, D., Doyon, R., Macintosh, B., & Nadeau, D. 2006, ApJ, 641, 556
- Marois et al. (2010) Marois, C., Zuckerman, B., Konopacky, Q. M., Macintosh, B., & Barman, T. 2010, Nature, 468, 1080
- Minowa et al. (2010) Minowa, Y., et al. 2010, Proc. SPIE, 7736,
- Ozernoy et al. (2000) Ozernoy, L. et al. 2000, ApJL, 537, 147
- Schneider et al. (1999) Schneider, G. et al. 1999, ApJL, 513, 127
- Schneider et al. (2009) Schneider, G., Weinberger, A. J., Becklin, E. E., Debes, J. H., & Smith, B. A. 2009, AJ, 137, 53
- Sheret et al. (2004) Sheret, I., Dent, W. R. F., & Wyatt, M. C. 2004, MNRAS, 348, 1282
- Smith & Terrile (1984) Smith, B.A. & Terrile, R.J. 1984, Science, 226, 4681
- Stauffer et al. (1995) Stauffer, J. R., Hartmann, L. W., & Barrado y Navascues, D. 1995, ApJ, 454, 910
- Strubbe & Chiang (2006) Strubbe, L. E., & Chiang, E. I. 2006, ApJ, 648, 652
- Suzuki et al. (2010) Suzuki, R., Kudo, T., Hashimoto, J., et al. 2010, Proc. SPIE, 7735,
- Tamura (2009) Tamura, M. 2009, American Institute of Physics Conference Series, 1158, 11
- Thalmann et al. (2009) Thalmann, C., et al. 2009, ApJ, 707, L123
- Thalmann et al. (2010) Thalmann, C., et al. 2010, ApJ, 718, L87
- Thalmann et al. (2011) Thalmann, C., et al. 2011, ApJ, 732, L34
- Thébault & Wu (2008) Thébault, P., & Wu, Y. 2008, A&A, 481, 713
- van Leeuwen (2007) van Leeuwen, F. 2007, A&A, 474, 653
- Wahhaj et al. (2005) Wahhaj, Z., Koerner, D. W., Backman, D. E., Werner, M. W., Serabyn, E., Ressler, M. E., & Lis, D. C. 2005, ApJ, 618, 385
- Wyatt et al. (1999) Wyatt, M.C., Dermott, S.F., Telesco, C.M., Fisher, R.S., Grogan, K., Holmes, E.K., & Pina, R.K. 1999, ApJ, 527, 918
- Wyatt (2006) Wyatt, M.C. 2006, ApJ, 639, 1153
- Wyatt (2008) Wyatt, M.C. 2008, ARAA, 46, 339