Single Top production at CMS
Abstract
A first measurement of the cross section of single top quark production in the channel in pp collision at TeV is presented. The measurement is performed on a data sample corresponding to an integrated luminosity of 35.9 pb-1 recorded at the LHC with the CMS detector. Leptonic decay channels with an electron or a muon in the final state are considered. After a selection optimized for the -channel mode, two different and complementary analyses have been performed. Both analyses confirm the Tevatron’s observation of single top, and their combination measures a cross section of which is consistent with the Standard Model prediction.
I Introduction
The existence of single top production has been established by the D0 and CDF experiments at the Tevatron collider Abazov:2009ii ; Aaltonen:2009jj ; Group:2009qk and the first measurements of individual production mechanisms have recently appeared Abazov:2009pa ; Aaltonen:2010jr . Three different production mechanisms are foreseen in the Standard Model (SM) channel, channel, and (or -associated). In 7 TeV proton-proton collisions the -channel mode, is by far the most abundant of the three mechanisms and it is the one with the most striking final state topology. Next-to-leading order (NLO) computations predict pb in the 4-flavour scheme and pb in the 5-flavour Campbell:2009gj , for a top mass of .
We present here first evidence for -channel single top quark production in collisions at at the LHC, with a first measurement of the production cross section CMS-PAS-TOP-10-008 . The results are based on the data sample sample collected in 2010 by the Compact Muon Solenoid (CMS) experiment JINST , and corresponds to an integrated luminosity of .
This measurement is performed in the leptonic decay channel, in which the W boson decays into an electron or a muon. The -channel production mode is treated as signal and the other two production modes will be considered as background.
After a dedicated event selection, two complementary analyses are performed. In the first analysis, referred to as the 2D-analysis, a data driven method using two angular properties specific to -channel top quark production will be used. In the second analysis, referred to as the BDT-analysis, the overall compatibility of the signal event candidates with the Standard Model expectations of electroweak top quark production is probed by using a multivariate analysis technique.
II The event selection
Both analyses employ similar reconstruction techniques and selection criteria. Signal events are characterized by exactly one isolated muon or electron and missing transverse energy from the leptonic decay of the boson as well as by one central -jet from the top quark decay and an additional light-quark jet from the hard scattering process. The latter is found most often in the forward direction.
Events are required to pass either a single electron trigger or a single muon trigger. The minimum requirement for the electron trigger ranged from 10 GeV to 22 GeV, while the minimum requirement for the muon trigger ranged from 9 GeV to 15 GeV. The selected data sample is used both for the selection of the signal and for signal-depleted control regions used for data-driven background studies. Therefore no lepton isolation criteria were used at trigger level, in order to allow background estimations based on samples failing these criteria.
After offline reconstruction, events are selected requiring exactly one isolated lepton (electron or muon) with and for muons and , for electrons, and exactly two jets (, ). In the 2D analysis, only the jets and the missing transverse energy () are reconstructed with the particle flow algorithm particleflow , while in the BDT-analysis, all objects are reconstructed with the particle flow algorithm.
In order to reduce the large background from light partons, one of the two selected jets is required to be identified as a b-jet according to the tight selection criteria of the track counting (TC) -tagging algorithm btag . To further reduce the background, the 2D-analysis requires that the second jet is not tagged according to a looser selection criteria, since most of the signal events are expected to have only one quark inside the acceptance of the tracking detectors (). The BDT-analysis does not make this requirement in order to increase statistics and profit from the larger separation power of the BDT discriminant.
One the other hand, to remove the kinematic region where the two identified jets are back-to-back, the BDT-analysis requires the two selected jets to satisfy . This region is found to be poorly reproduced by the simulation in a sample enriched in light partons, affecting some of the observables used in the analysis.
Finally, to further suppress contributions from processes where the lepton does not come from a leptonically decaying boson, the transverse mass is required to be for muon events and for electron events. The transverse mass is defined as
| (1) |
where the neutrino momentum vector is assumed equal to the missing transverse energy ().
In data, the number of selected events is 72 in the electron and 112 in the muon channels in the 2D-analysis, and 82 in the electron and 139 in the muon channels in the BDT-analysis.
II.1 Top quark reconstruction
Both analyses require the reconstruction of the 4-momentum of the top-quark candidate. A constrained kinematic fit is used to reconstruct the complete kinematics of the event under the hypothesis that it is a single top event decaying into a lepton+jets final state. This leads to a quadratic equation in the longitudinal neutrino momentum, . Solutions to this equation can have an imaginary part when is larger than the pole mass used in the constraint. The imaginary component is then eliminated by modifying the such as to give , still respecting the mass constraint. When two real solutions are present, which happens in 77.6% of the cases, the solution with the smallest is chosen, which, in simulated events, is correct in 60.3% of the cases.
Choosing the jet with the highest -tagging discriminant as the jet originating in the decay of the top quark is correct in simulated events in 92.6% (87.4%) of the cases after the 2D (BDT) selection. The non-tagged jet is matched to the recoil quark in 89.6% (84.0%) of the cases.
III Background Estimation
With a relatively small signal and a large background, one crucial element of the analysis is the determination of the background. Data-driven methods are thus used to estimate the main backgrounds. The event yields for the two selections are summarized in Table 2.
III.1 QCD estimation
This analysis probes a very specific kinematical phase space populated only by the tails of the QCD distributions. This, despite the excellent agreement of the CMS simulation with data, together with the small number of selected events in the simulation, makes the estimate of this background on simulated events not very significant.
The normalization of this background is estimated by a profile likelihood fit to the distribution after all other selection criteria have been applied, by parametrizing the distribution as , where and are templates for signal-like (leptons coming from decays) and QCD-like events, respectively. The template is taken from the simulation, while the template is extracted from a high statistics background dominated data sample composed mainly of QCD events. This sample is obtained by removing the -tagging and requirements and inverting the isolation cut. These requirements reject most of the signal-like events (single top, , , and in general any process with a charged lepton from an intermediate boson).
This procedure yields the following predictions for the number of QCD events passing the threshold in the 2D analysis:
| (muons) | ||||
| (electrons) |
and in the BDT analysis:
| (muons) | ||||
| (electrons) |
where “” indicates the systematic uncertainty coming from the model and “” indicates the maximum variation between the results when varying the fit range. The central values of these predictions are used in the analyses, while the uncertainties on these values are conservatively taken as in the muon decay channel in both analyses, in the electron decay channel in the BDT analysis and in the 2D analysis.
III.2 light partons estimation
The light partons background is treated differently in both analyses. In the BDT analysis, the light partons yield is treated as a nuisance parameter in a fully Bayesian procedure. In the 2D analysis, partially data-driven methods are used to extract the normalization and the kinematics. The same factor is then also used for jets.
A suitable control sample, dominated by the + light flavors background, is obtained with an orthogonal selection where the events are required to have one isolated lepton and exactly two jets. One of the jets is required to be “taggable”, i.e., within the tracker acceptance and with at least two tracks satisfying the quality selection of the -tagging algorithm. Both jets should fail the tight -tagging selection. To model the distributions of the variables used in this analysis in + light flavor background events in the signal region, the distributions obtained in this enriched sample in data will be used, after subtracting the other contributions (including signal, which accounts for roughly 1% of this sample) estimated with simulated samples.
To estimate the scale factor for the light partons background components both this -enriched control sample (control sample ) and a subset where at least one jet passes the loose -tagging selection (but fails the tight one – control sample ) are used. In both samples a fit on the full distribution is performed. The QCD and light partons components are free parameters in the fit, while all other processes, including the heavy flavour components and the -channel signal, are constrained to the expected values. The scale factors between the number of events in the -enriched control sample in data and simulation found are given in Table 1.
| Process | from region | from region |
|---|---|---|
| channel | ||
| channel |
The 2D analysis takes as central predictions those from control sample , upon the argument that it is closer to the signal region, obtaining an expectation of 18.2 (116) light parton events in the signal region for the muon (electron) decay channel. An uncertainty of () is then used, which covers both the statistical uncertainty from the fit and the difference between both predictions. The same scale factors are applied to jets.
III.3 Other background contributions
The and components are scaled to LO values and, on top of this correction, by further factors and , respectively, in order to take into account the results of the cross section measurement exploiting -tagging top-10-003 , from which the cross section itself is taken. The theory prediction is used for Gavin:2010az and single top in Kidonakis:2010tc and Campbell:2005bb channels. The uncertainties on these values are considered as components of the systematic uncertainty. The BDT analysis treats the normalization of these backgrounds as a nuisance parameter in the fit, with Gaussian constraints corresponding to the systematic uncertainty.
| Process | 2D, channel | 2D, channel | BDT, channel | BDT, channel |
| single top, channel () | 17.6 0.7 | 11.2 0.4 | 17.6 0.7 | 10.7 0.5 |
| single top, channel | 0.9 0.3 | 0.6 0.2 | 1.4 0.5 | 1.0 0.3 |
| single top, | 3.1 0.9 | 2.4 0.7 | 3.8 1.1 | 0.1 |
| 0.29 0.09 | 0.23 0.07 | 0.32 0.10 | 0.23 0.07 | |
| 0.24 0.07 | 0.17 0.05 | 0.33 0.10 | 1.5 0.4 | |
| 0.018 0.005 | 0.011 0.003 | 0.020 0.006 | 0.1 | |
| light partons | 18.2 5.5 | 11.6 2.3 | 8.4 4.2 | 7.0 3.5 |
| 1.7 0.5 | 1.6 0.3 | 0.7 0.2 | 0.05 0.03 | |
| QCD | 0.6 0.3 | 2.6 | 4.9 2.5 | 5.3 5.3 |
| 20.4 10.2 | 14.1 7.1 | 17.6 8.8 | 11.7 5.8 | |
| 12.9 | 9.4 | 9.2 | 5.9 | |
| 20.3 3.6 | 15.6 2.8 | 34.9 4.9 | 22.9 3.2 | |
| Total background | 78.6 15.2 | 58.4 11.0 | 82.4 13.1 | 55.9 10.2 |
| Signal + background | 96.2 15.3 | 69.6 11.0 | 100.0 13.2 | 66.6 10.2 |
| Data | 112 | 72 | 139 | 82 |
IV The analyses
IV.1 The 2D Analysis
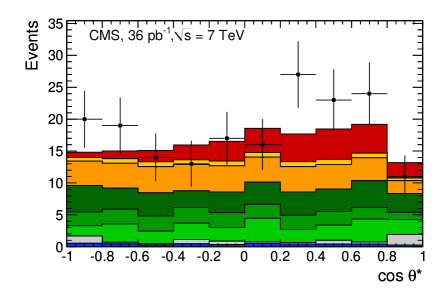
The cross section is determined by performing an unbinned likelihood fit to the 2D distribution of two variables, and . The distributions of these two variables are shown in Fig. 1.
A property specific to single top production is the almost 100% left-hand polarization of the top quark due to the structure of the electroweak interaction Mahlon:1996pn ; Motylinski:2009kt . Because the lifetime of the top quark is shorter than the hadronization scale, the direction of the top-quark spin is visible in angular correlations of its decay products. These are distributed according to
| (2) |
where is the angle between the direction of the outgoing lepton and the spin axis, approximated by the direction of the untagged jet, in the top-quark rest frame. is the coefficient of spin asymmetry, equal to for charged leptons.
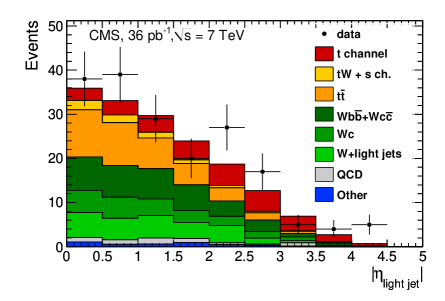
Another important feature of the signal is the presence of a recoil jet, from the fragmentation of a light (untagged) quark, with a characteristic distribution.
The inputs to the fit are the template distributions for signal and backgrounds, with separate templates for each lepton. For the backgrounds, a correlation is neglected and the 2D distribution is taken as the product of the 1D templates. The shapes of the discriminating variables for the QCD and light partons components are taken from the control samples, while all other shapes are taken from simulation. The overall background floats unconstrained in the fit, while its relative components are fixed according to the background estimates.
IV.2 The BDT Analysis
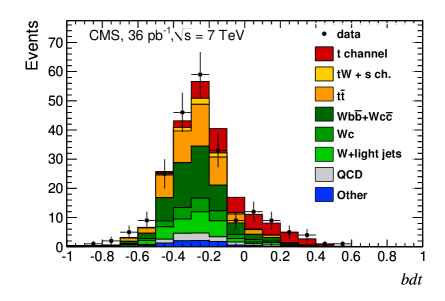
This analysis assesses the compatibility of the data with the Standard Model predictions of electroweak top quark production using a multivariate analysis method. Boosted Decision Trees (BDT) are used, with decision trees and the ADA boosting algorithm as implemented in the TMVA package TMVA2007 .
A total of 37 observables reconstructed in the detector have been chosen from five categories. The validity of the description of the input variables in the simulation has been checked using a Kolmogorov-Smirnov test in the orthogonal -enriched control sample. The first type of observables covers the kinematics and properties of the leptons and the jets (this includes ), while the second type refers to correlations between these objects. A third type results from properties of their combinations, the W-boson, the top quark, and the sum of the hadronic four-momenta. A fourth type of observables, which includes , exploits the angular distributions between original (lepton, jet) and derived objects (, top quark, etc.). A fifth type are the event related observables, such as the sphericity and the total and transverse energies contained in the parton collision process. In all these observables, the description of the measured distributions by the simulated data is found to be reasonable within the theoretical uncertainties. The most important observables are the lepton momentum, defined as the mass of the system formed by the reconstructed boson and the two jets, the of the system formed by the two jets, the of the most -tagged jet, and the reconstructed top mass. The classifier has been validated both in simulation and in data. It is shown in Fig. 2.
The cross section is then extracted from a binned likelihood fit to the distribution with a Bayesian approach, where the normalizations of all backgrounds except the multi-jet QCD background and the other systematic uncertainties are treated as nuisance parameters in the fit. For the multi-jet QCD background, the data-driven estimate is used.
V Measurement of the production cross section
| Analysis, channel | expected | observed |
|---|---|---|
| 2D, -channel | 1.7 | 2.5 |
| 2D, -channel | 1.3 | 3.1 |
| 2D, combined | 2.1 | 3.7 |
| BDT, -channel | 2.4 | 3.1 |
| BDT, -channel | 2.01.0 | 1.9 |
| BDT, combined | 2.9 | 3.5 |
The 2D analysis yields the following cross section measurements:
| muon channel | (3) | ||||
| electron channel | (4) | ||||
| combined | (5) |
When combining the electron and the muon decay channels, all systematic uncertainties are considered fully correlated with exception of the data-driven uncertainty on multi-jet QCD.
In the BDT analysis, the following cross sections are measured:
| muon channel | (6) | ||||
| electron channel | (7) | ||||
| combined | (8) |
The main systematic uncertainties are the uncertainty on b-tagging, the jet energy scale and the modeling of the signal and backgrounds. The expected and observed significance when including all systematic uncertainties are given in Table 3. The measurements are consistent among them and with the standard model expectation in the 4- and 5-flavour schemes. Both confirm the Tevatron observation of the electroweak mode of top quark production.
The measurements from the 2D and BDT analyses are then combined with the Best Linear Unbiased Estimation (BLUE) method Lyons1988110 . The statistical correlations estimated from simulated samples is 0.51. Systematic uncertainties common to both methods are assumed to be 100% correlated. The combined result is:
This result can be used to derive an estimate of CKM matrix element . With the assumption that and are much smaller than and using the NLO prediction in the 5-flavors scheme pb Campbell:2009gj , is found to be
VI Conclusion
A first measurement of the production cross section of single top quark pp collisions at TeV was performed on an integrated luminosity of 36 pb-1 recorded at CMS. Two separate analyses were made, and the combination of the two measurements yields . This measurement is consistent with the SM prediction.
References
- (1) V. M. Abazov et al., Phys. Rev. Lett. 103, 092001 (2009).
- (2) T. Aaltonen et al., Phys. Rev. Lett. 103, 092002 (2009).
- (3) The CDF and D0 Collaborations, [arXiv:0908.2171 [hep-ex]].
- (4) V. M. Abazov et al., Phys. Lett. B682, 363-369 (2010).
- (5) T. Aaltonen et al., Phys. Rev. D82, 112005 (2010).
- (6) J. M. Campbell, R. Frederix, F. Maltoni, F. Tramontano, JHEP 0910, 042 (2009).
- (7) S. Chatrchyan et al., Phys. Rev. Lett. 107, 091802 (2011).
- (8) R. Adolphi et al., JINST 3 (2008) S08004.
- (9) CMS Collaboration, ”Commissioning of the particle flow reconstruction in minimum-bias and jet events from pp collisions at 7 TeV”, 2010, CMS-PAS-PFT-10-002.
- (10) CMS Collaboration, ”Commissioning of b-jet identification with pp collisions at 7 TeV”, 2010, CMS-PAS-BTV-10-001.
- (11) S. Chatrchyan et al., “Measurement of the t Production Cross Section in pp Collisions at 7 TeV in Lepton + Jets Events Using b-quark Jet Identification,” [arXiv:1108.3773 [hep-ex]].
- (12) R. Gavin, Y. Li, F. Petriello, S. Quackenbush, Comput. Phys. Commun. 182, 2388-2403 (2011).
- (13) N. Kidonakis, Phys. Rev. D81, 054028 (2010).
- (14) J. M. Campbell, F. Tramontano, Nucl. Phys. B726, 109-130 (2005).
- (15) G. Mahlon, S. J. Parke, Phys. Rev. D55, 7249-7254 (1997).
- (16) P. Motylinski, Phys. Rev. D80, 074015 (2009).
- (17) A. Hoecker, P. Speckmayer, J. Stelzer, J. Therhaag, E. von Toerne, and H. Voss, “TMVA: Toolkit for Multivariate Data Analysis,” PoS ACAT, 040 (2007).
- (18) L. Lyons, D. Gibaut, P. Clifford, Nucl. Instrum. Meth. A270 (1988) 110.