The low-mass end of the / relation in quasars
Abstract
The – relation in quasars has been probed only in a limited parameter space, namely at M⊙ and M⊙. Here we present a study of 26 quasars laying in the low-mass end of the relation, down to M⊙. We selected quasars from the SDSS and HST-FOS archives, requiring modest (as derived through the virial paradigm). We imaged our sources in band from the Nordic Optical Telescope. The quasar host galaxies have been resolved in 25 out of 26 observed targets. Host galaxy luminosities and stellar masses are computed, under reasonable assumptions on their star formation histories. Combining these results with those from our previous studies, we manage to extend the sampled parameter space of the – relation in quasars. The relation holds over 2 dex in both the parameters, similarly to what observed in low-luminosity AGN and in quiescent galaxies. For the first time, we are able to measure the slope of the – relation in quasars. We find that it is consistent with the linear case (similarly to what observed in quiescent galaxies). We do not find any evidence of a population of massive black holes lying below the relation.
Subject headings:
quasars:1. Introduction
Massive black holes (BHs) are ubiquitously found in the centre of massive galaxies (Kormendy & Richstone, 1995; Decarli et al., 2007; Gallo et al., 2008). Their masses () show strong correlations with large-scale properties of the host galaxies, namely the stellar velocity dispersion (, Gebhardt et al., 2000; Ferrarese & Merritt, 2000; Gultekin et al., 2009; Graham et al., 2011), the luminosity and mass of the spheroidal component (, ; see Magorrian et al., 1998; Marconi & Hunt, 2003; Häring & Rix, 2004). These relations have been interpreted as the outcome of a joint evolution between BHs and their host galaxies (Silk & Rees, 1998; Kauffmann & Haenelt, 2000; King, 2005; Wyithe & Loeb, 2006; Robertson et al., 2006; Hopkins et al., 2007; Malbon et al., 2007; Shankar, 2009): In this scenario, the growth of BHs through accretion regulates the gas cooling in the outskirt of host galaxies through energy or momentum injection (feedback), thus quenching the formation of stars. Galaxy mergers may also play a role in this scenario, as gravitationally-induced dynamical instabilities may trigger both star formation bursts and gas inflows fuelling the BH activity (Kauffmann & Haenelt, 2000; Di Matteo, Springel & Hernquist, 2005; Canalizo et al., 2007; Bennert et al., 2008, although see also Cisternas et al. 2011).
The –host galaxy relations have been pinned down on an albeit small set of local, mostly quiescent galaxies. The sampled parameter space ranges over 3 dex in masses, from a few million to a few billion solar masses in terms of . Extending these studies beyond the local Universe is challenging. On one side, the influence radius of BHs, , i.e., the radius where the gravitational potential is dominated by the singularity, is resolved only in very nearby objects (distances few tens Mpc) with high values. For any other sources, indirect tracers of are required. The most commonly-adopted indirect estimator of is based on the width of broad emission lines and the size of the broad line region (BLR). This can be done only in type-1 AGN, where broad lines are observed (Peterson & Wandel, 2000; Vestergaard, 2002; Vestergaard & Peterson, 2006; Decarli et al., 2010a). This approach allows to estimate from single-epoch spectra in quasars up to from SDSS spectra (Shen et al., 2010), and in most of the quasars known to day (Willott, McLure & Jarvis, 2003; Kurk et al., 2007; Willott et al., 2010; De Rosa et al., 2011)111Caveats to this technique arise as BLR clouds may be supported by radiation pressure (Marconi et al., 2009) or move non-virially; projection effects depending on the geometry and orientation of the BLR may hinder our ability to actually measure the orbital velocity of clouds (Decarli et al., 2008b; Decarli, Dotti & Treves, 2011); different emission lines may be produced in regions where the gas dynamics are different (Netzer et al., 2007; Decarli et al., 2008a; Labita et al., 2009; Fine, Jarvis & Mauch, 2011; Richards et al., 2011)..
On the other side, the properties of host galaxies are hard to measure in distant sources. Bright active nuclei (necessary to measure ) can easily outshine the light of their host galaxies. Observations in excellent seeing conditions (e.g., Kotilainen et al., 2009; Targett et al., 2011) or based on adaptive optics (e.g., Croom et al., 2004; Falomo et al., 2005) are required. Diffraction-limited observations with HST have also significantly contributed in this field (Bahcall et al., 1997; Kukula et al., 2001; Ridgway et al., 2001; Hamilton et al., 2002; Dunlop et al., 2003; Floyd et al., 2004; Peng et al., 2006a; Kim et al., 2008; Jahnke et al., 2009; Bennert et al., 2011; Jiang et al., 2011), although some concerns about the reproducibility of the PSF have been arised (Kim et al., 2008). Up to now, quasar host galaxies have been resolved up to , and most of them at (see Kotilainen et al., 2009, and references therein).
In order to understand the processes and timescales which led to the onset of the BH–host galaxy relations, two key observational tests are required. The first one consists in tracing the evolution of the BH-to-host galaxy mass ratio ( /) as a function of Cosmic Time. If, e.g., , then we can argue that the BHs in these systems still have to accrete in already formed bulges. Vice versa, could suggest a rapid growth of the BHs, followed by a slower build-up of the spheroids. Most of the studies on the evolution of the BH–host galaxy relations suggest that at high redshift, for a given mass of the host spheroid, the harbored BH is more massive than at low- (McLure et al., 2006; Peng et al., 2006a, b; Merloni et al., 2010; Decarli et al., 2010b; Bennert et al., 2011), with . It is interesting to note that the host galaxy of J1148+5251, the highest- SDSS quasar, at , shows a –host galaxy dynamical mass ratio of (Walter et al., 2003, 2004), in an order-of-magnitude agreement with the extrapolation from the studies.
A second observational test to probe the onset of the BH–host galaxy relations is to trace the low-mass end of the BH–host galaxy relations. Different initial host galaxy mass, BH seed mass and build-up processes produce different slopes of the relations, especially at low-mass. Light seeds ( M⊙) are expected as the remnants of metal-pure stars in the early Universe, while heavier seeds (up to M⊙) can result from the direct collapse of primordial gas clouds. The former ones would produce a larger scatter in the –host relations, a higher occupation fration in relatively small galaxies and a lower cutoff in the minimum with respect to the latter (see, e.g., Volonteri & Natarajan, 2009, and references therein). Some authors even claim that the – relation itself is just the upper limit of a broader distribution, with a number of (hard-to-detect) modest-mass BHs embedded in relatively massive galaxies (e.g. Batcheldor, 2010).
The low-mass end of the –host galaxy relations has been probed down to few in quiescent galaxies or in low-luminosity AGN at low- (Greene & Ho, 2004, 2007; Dong et al., 2007; Thorton et al., 2008; Xiao et al., 2011; Jiang et al., 2011), suggesting that the –host relations hold in quiescent or mildly active galaxies. However, no effort has been attempted so far to extend this test to higher luminosity AGN. Quasars are ideal probes of the BH–host galaxy relations at . However, while in quasars has been measured up to very high redshift, the ranges of and investigated up to date are limited, and comparable with the observed scatter of the BH–host galaxy relations. Filling the low-mass end of the – relation therefore represents a main challenge and a fundamental step in our comprehension of the BH–host galaxy evolution. In this paper, we present ground-based NIR observations of quasars at selected so that virial . Our imaging campaign successfully resolved 25 quasar host galaxies. This enables us to directly probe the slope of the – relation in quasars.
The structure of this work is the following: in Section 2 we describe the sample. In Section 3 we present the analysis of the spectra and we derive in all our sources. The new observations, the data reduction and analysis and the results from the imaging campaign are presented in Section 4. In Section 5 we discuss our results. Conclusions are summarized in Section 6. Throughout the paper we will assume a standard cosmology with km s-1 Mpc-1, and .
2. The sample

We selected quasars at with available H observations in the Sloan Digital Sky Survey (SDSS York et al., 2000) spectroscopic database or C iv or Mg ii observations in the HST-Faint Object Spectrograph (FOS) archive. We require that black hole virial masses, computed as described in Section 3, range between and M⊙. Note that, out of the 62 quasars examined in our previous study (Decarli et al., 2010a), only 8 (13%) had M⊙. We then selected quasars having at least 3 relatively bright (=10–15 mag) stars within (corresponding to the half size of the NOTCam field of view), and a number of fainter stars in order to have an accurate description of the Point Spread Function (PSF). Observability constraints and modest weather losses further limited our analysis to 26 targets (see Table 1), mostly detected in radio wavelengths according to the Véron-Cetty & Véron (2010) catalogue. This new sample is then matched with the 62 targets presented in our previous study of the – relation (Decarli et al., 2010a, b). Figure 1 compares the distribution of in the general SDSS sample at , computed from the continuum luminosities and H width estimates reported by Shen et al. (2010), with the ones presented in Decarli et al. (2010a) and in the present study.
| Name | RA | DEC | Radio? | ||
|---|---|---|---|---|---|
| [mag] | |||||
| (1) | (2) | (3) | (4) | (5) | (6) |
| PB5723 | 00 05 47.5 | +02 03 02 | N | 0.234 | 16.60 |
| PG0026+12 | 00 29 13.7 | +13 16 04 | Y | 0.145 | 15.41 |
| PG0052+251 | 00 54 52.1 | +25 25 39 | Y | 0.155 | 15.43 |
| B20110+29 | 01 13 24.2 | +29 58 16 | Y | 0.363 | 17.00 |
| PKS0214+10 | 02 17 07.6 | +11 04 10 | Y | 0.408 | 16.46 |
| J02321+0008 | 02 32 11.8 | +00 08 03 | Y | 0.432 | 19.10 |
| J02331-0909 | 02 33 10.6 | -09 09 40 | Y | 0.388 | 18.45 |
| J03010+0004 | 03 01 00.2 | +00 04 29 | Y | 0.486 | 19.33 |
| J03323+0106 | 03 32 18.0 | +01 06 48 | N | 0.482 | 18.91 |
| J03579-0550 | 03 57 59.0 | -05 50 15 | Y | 0.439 | 18.93 |
| B20752+25A | 07 55 37.0 | +25 42 39 | Y | 0.446 | 18.00 |
| J08044+1904 | 08 04 42.1 | +19 04 26 | Y | 0.346 | 19.40 |
| J08285+2748 | 08 28 53.5 | +27 48 33 | N | 0.330 | 20.00 |
| J08305+0802 | 08 30 57.4 | +08 02 34 | Y | 0.319 | 19.20 |
| PG0844+349 | 08 47 42.4 | +34 45 03 | Y | 0.064 | 14.50 |
| J09010+3538 | 09 01 00.9 | +35 38 09 | N | 0.302 | 19.20 |
| PG0947+396 | 09 50 48.3 | +39 26 51 | Y | 0.206 | 16.39 |
| PG0953+415 | 09 56 52.4 | +41 15 23 | Y | 0.234 | 15.32 |
| TON1187 | 10 13 03.1 | +35 51 23 | N | 0.079 | 14.75 |
| TEX1156+213 | 11 59 26.2 | +21 06 56 | Y | 0.349 | 16.90 |
| Q1214+1804 | 12 16 49.0 | +17 48 04 | N | 0.374 | 17.30 |
| PG1404+226 | 14 06 21.9 | +22 23 47 | Y | 0.098 | 15.82 |
| PG1415+451 | 14 17 00.8 | +44 56 06 | Y | 0.114 | 15.24 |
| PG1626+554 | 16 27 56.1 | +55 22 31 | Y | 0.132 | 15.68 |
| 4C73.18 | 19 27 48.5 | +73 58 02 | Y | 0.302 | 16.50 |
| PKS2251+11 | 22 54 10.4 | +11 36 39 | Y | 0.325 | 15.82 |
3. The spectroscopic dataset
The spectroscopic dataset consists of pipeline-processed, publicly available spectra from the SDSS or FOS archive. SDSS spectra have and a spectral range between and Å. Uncertainties on wavelength calibration amount to Å, while flux calibration formal errors account to 5%. FOS spectra are taken from the compilation of re-calibrated quasar and AGN FOS spectra by Evans & Koratkar (2004). Observations were performed with a number of different gratings both at high spectral resolution (1–6 Å diode-1, ) and low spectral resolution (6–25 Å diode-1, ) covering various spectral windows from 1140 Å to 3275 Å. Photometric uncertainties are usually 5–10%, while typical wavelength calibration uncertainties are around 0.5 channels rms (see Evans & Koratkar, 2004).
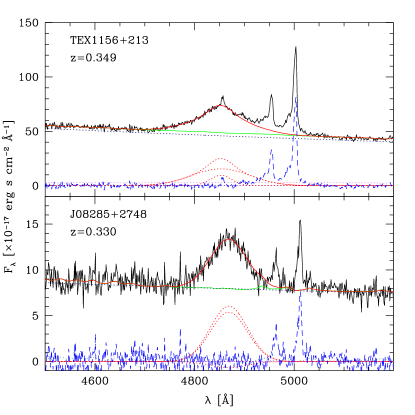
Spectral analysis follows the same approach described in Decarli et al. (2010a) and De Rosa et al. (2011). Briefly, continua are modeled as a superposition of a power-law component, the host galaxy emission (only in the optical spectra; the Elliptical model by Mannucci et al., 2001, was adopted as a template) and the Fe ii multiplets (modeled on the template by Vestergaard & Wilkes, 2001). Relevant broad emission lines (H, Mg ii and C iv) are modeled with the superposition of two gaussian curves with the same peak wavelength. The spectral resolution of the SDSS data is adequate to allow an easy identification of the narrow H emission with respect to the broad line. Examples of the line fitting are shown in Figure 2.
We measure the continuum luminosity at 1350, 3000 and 5100 Å from the fitted power-law. The broad line luminosity and FWHM are measured from the line model (see Decarli et al., 2008a, for a discussion on the fitting technique and the parametrization of the relevant quantities). Virial black hole masses are computed with the same recipies used in Decarli et al. (2010a), adopting geometrical factors of for H and Mg ii and for C iv. Table 2 lists the main measurements and inferred quantities from the spectroscopic analysis222We note that, after a careful re-analysis of the spectra, two objects (B20110+29 and B20752+25A) show values of slightly exceeding the initial selection criteria. Nevertheless, we include these sources in the present analysis..
| Name | Line | log | FWHM | log | |
|---|---|---|---|---|---|
| [erg s-1] | [km s-1] | [M⊙] | |||
| (1) | (2) | (3) | (4) | (5) | (6) |
| PB5723 | 0.234 | C iv | 44.71 | 3715 | 8.15 |
| PG0026+12 | 0.145 | C iv | 45.22 | 2062 | 7.92 |
| PG0052+251 | 0.155 | C iv | 45.33 | 5914 | 8.90 |
| B20110+29 | 0.363 | H | 44.81 | 6149 | 9.33 |
| PKS0214+10 | 0.408 | C iv | 45.71 | 4122 | 8.79 |
| J02321+0008 | 0.432 | H | 44.41 | 1727 | 7.56 |
| J02331-0909 | 0.388 | H | 44.63 | 1863 | 7.77 |
| J03010+0004 | 0.486 | H | 44.45 | 6634 | 8.76 |
| J03323+0106 | 0.482 | H | 44.77 | 4282 | 8.59 |
| J03579-0550 | 0.439 | H | 44.62 | 4005 | 8.43 |
| B20752+25A | 0.446 | H | 45.06 | 9738 | 9.50 |
| J08044+1904 | 0.346 | H | 44.09 | 7322 | 8.60 |
| J08285+2748 | 0.330 | H | 44.14 | 5385 | 8.37 |
| J08305+0802 | 0.319 | H | 44.14 | 6149 | 8.48 |
| PG0844+349 | 0.064 | Mg ii | 44.57 | 3209 | 8.20 |
| J09010+3538 | 0.302 | H | 44.29 | 8495 | 8.86 |
| PG0947+396 | 0.206 | C iv | 45.17 | 4090 | 8.49 |
| PG0953+415 | 0.234 | C iv | 45.45 | 3490 | 8.50 |
| TON1187 | 0.079 | H | 44.20 | 2141 | 7.60 |
| TEX1156+213 | 0.349 | H | 44.93 | 5663 | 8.94 |
| Q1214+1804 | 0.374 | H | 45.04 | 3728 | 8.65 |
| PG1404+226 | 0.098 | H | 44.14 | 1036 | 6.93 |
| PG1415+451 | 0.114 | H | 44.19 | 3244 | 7.96 |
| PG1626+554 | 0.132 | C iv | 45.18 | 4057 | 8.49 |
| 4C73.18 | 0.302 | C iv | 45.92 | 4155 | 8.91 |
| PKS2251+11 | 0.325 | C iv | 45.54 | 5028 | 8.87 |
4. The imaging dataset
All the objects in our study have been observed in band in a campaign at the 2.5m Nordic Optical Telescope (Roque de Los Muchachos, Spain) using NOTCam. Observations were carried out during three observing runs in May 2007, April and November 2008. The average seeing in band was . The pixel NOTCam detector has a pixel scale of pxl-1, yielding a field of view size of arcmin2. Usual observing techniques for broad-band NIR imaging of point-like sources were adopted. Observations were split in 1 min long individual frames. Random jittering patterns within a 20′′ box were adopted in order to perform optimal sky subtraction. The total time on each source was 45 min.
Data reduction was performed using IRAF333IRAF is distributed by the National Optical Astronomy Observatories, which are operated by the Association of Universities for Research in Astronomy, Inc., under cooperative agreement with the National Science Foundation.. Bad pixels were corrected for in each image using a mask made from the ratio of two sky flats with different illumination levels. Sky subtraction was performed for each science image using a median averaged frame of all the other temporally close frames in a grid of eight exposures. Flat fielding was made using normalized median averaged twilight sky frames with different illumination levels. Finally, images were aligned to sub-pixel accuracy using field stars as reference points and combined after removing spurious pixel values to obtain the final reduced co-added image. Zero point calibration is achieved by cross-matching the photometry of field stars with the 2MASS database. This approach yields typical photometric uncertainties 0.1 mag.
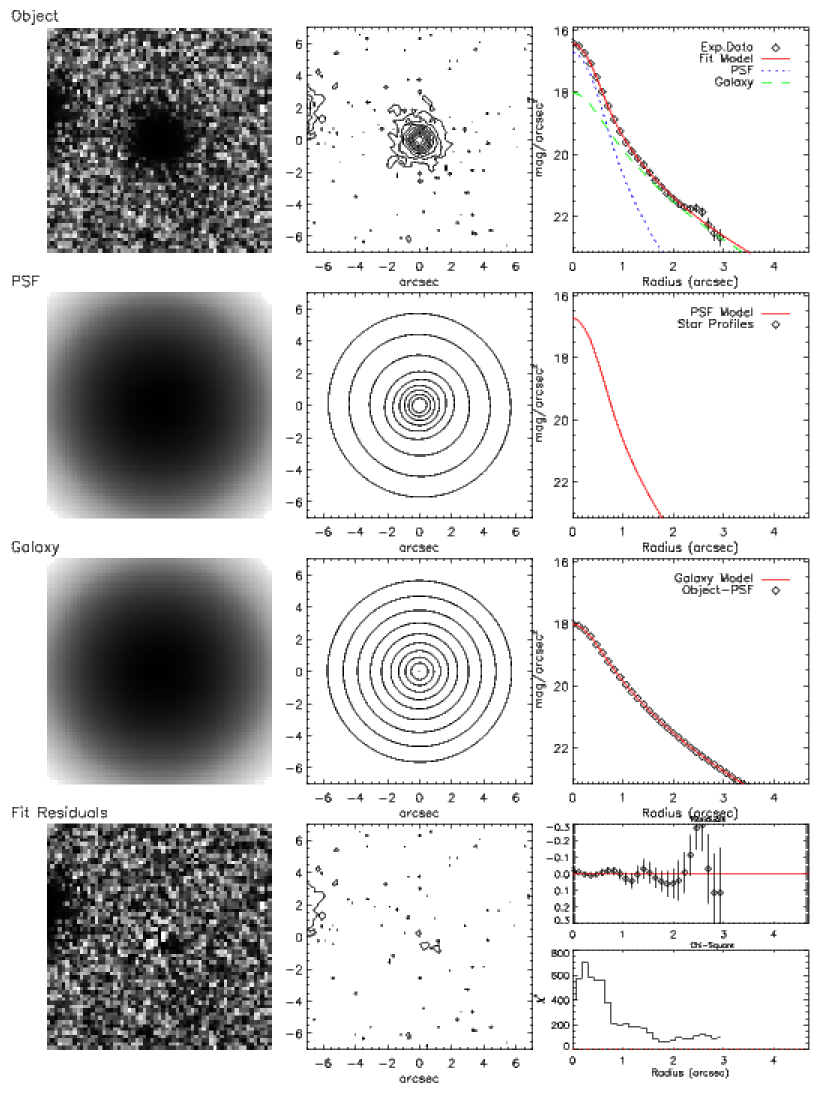
We analyzed our data using the Astronomical Image Decomposition and Analysis package (AIDA; Uslenghi & Falomo, 2008), an IDL-based software designed to perform two–dimensional model fitting of quasar images. Details on the procedure are presented in Kotilainen et al. (2007, 2009), and briefly summarized here.
A careful modeling of the Point Spread Function (PSF) is crucial to disentangle the extended host galaxy light from the nuclear source. To model the PSF shape, we used suitable field stars. Each star was modeled with four two-dimensional Gaussians, representing the core of the PSF, and an exponential feature, representing the extended wing of the PSF. Regions contaminated by nearby sources, saturated pixels and other defects affecting the images were masked out.
In order to discriminate between resolved and unresolved targets, we first fit the images of our sources with the pure PSF model. In most of the cases, an extended halo was clearly observed in the residuals. We then re-performed the fits using a Sersic law, (describing the host galaxy) plus a point-source (the nucleus), convolved to the PSF model. In all but one case (J02331-0909), this second fit is significantly better than the fit with the pure PSF, as confirmed by the ratio between the two fits (see table 3).
An example of the outputs of our analysis is shown in Figure 3.
Host galaxy apparent -band magnitudes are then converted into rest-frame -band. We use the Elliptical galaxy template by Mannucci et al. (2001) to estimate -corrections. The host galaxy -band absolute magnitude is then converted into a stellar mass by adopting the mass-to-light ratio () of a single stellar population originated at and passively evolving down to (see Decarli et al., 2010b, for details). Table 3 summarizes the relevant results from the modeling of the quasar host galaxies described here.
| Name | Ell. | - | log | log | log | ||||||||
|---|---|---|---|---|---|---|---|---|---|---|---|---|---|
| [mag] | [mag] | [mag ′′-2] | [′′] | [mag] | [mag] | [M⊙/L⊙] | [M⊙] | ||||||
| (1) | (2) | (3) | (4) | (5) | (6) | (7) | (8) | (9) | (10) | (11 | (12) | (13) | (14) |
| PB5723 | 0.234 | 15.99 | 15.81 | 5.41 | 1.41 | 0.32 | 0.57 | 5.00 | 2.59 | -21.93 | 0.71 | 11.38 | -3.61 |
| PG0026+12 | 0.145 | 12.90 | 14.94 | 16.10 | 1.77 | 1.44 | 0.15 | 1.20 | 2.58 | -21.64 | 0.75 | 11.30 | -3.76 |
| PG0052+251 | 0.155 | 13.46 | 14.37 | 16.34 | 6.55 | 2.19 | 0.19 | 1.22 | 2.58 | -22.38 | 0.74 | 11.59 | -3.07 |
| B20110+29 | 0.363 | 16.04 | 16.21 | 12.07 | 2.51 | 3.89 | 0.09 | 5.00 | 2.60 | -22.61 | 0.67 | 11.61 | -2.48 |
| PKS0214+10 | 0.408 | 14.60 | 16.10 | 13.98 | 1.88 | 1.16 | 0.00 | 2.77 | 2.59 | -23.03 | 0.65 | 11.77 | -3.36 |
| J02321+0008 | 0.432 | 99.90 | 16.80 | 9.93 | 1.43 | 0.37 | 0.00 | 3.89 | 2.58 | -22.50 | 0.64 | 11.54 | -4.18 |
| J02331-0909 | 0.388 | 15.98 | – | – | 1.01 | – | – | – | – | – | – | – | – |
| J03010+0004 | 0.486 | 99.90 | 17.35 | 13.42 | 1.17 | 0.26 | 0.24 | 1.89 | 2.57 | -22.25 | 0.63 | 11.43 | -2.87 |
| J03323+0106 | 0.482 | 18.66 | 17.15 | 11.55 | 1.91 | 0.54 | 0.61 | 3.17 | 2.57 | -22.43 | 0.63 | 11.50 | -3.11 |
| J03579-0550 | 0.439 | 18.78 | 17.22 | 8.06 | 1.14 | 0.45 | 0.35 | 5.00 | 2.58 | -22.12 | 0.64 | 11.39 | -3.16 |
| B20752+25A | 0.446 | 14.80 | 16.14 | 12.51 | 1.39 | 0.71 | 0.07 | 2.95 | 2.58 | -23.24 | 0.64 | 11.83 | -2.53 |
| J08044+1904 | 0.346 | 17.07 | 17.40 | 17.73 | 1.55 | 0.98 | 0.37 | 1.00 | 2.60 | -21.30 | 0.67 | 11.09 | -2.69 |
| J08285+2748 | 0.330 | 16.98 | 17.20 | 16.63 | 1.58 | 0.81 | 0.06 | 1.53 | 2.60 | -21.38 | 0.68 | 11.13 | -2.96 |
| J08305+0802 | 0.319 | 17.50 | 18.25 | 17.66 | 1.19 | 0.57 | 0.33 | 0.90 | 2.60 | -20.25 | 0.68 | 10.68 | -2.40 |
| PG0844+349 | 0.064 | 13.34 | 14.59 | 17.55 | 1.92 | 2.82 | 0.27 | 0.90 | 2.56 | -20.13 | 0.78 | 10.73 | -2.73 |
| J09010+3538 | 0.302 | 17.08 | 16.35 | 14.10 | 2.79 | 0.91 | 0.20 | 2.43 | 2.60 | -22.01 | 0.69 | 11.39 | -2.73 |
| PG0947+396 | 0.206 | 14.42 | 15.18 | 16.17 | 4.45 | 1.92 | 0.20 | 1.59 | 2.59 | -22.24 | 0.72 | 11.52 | -3.41 |
| PG0953+415 | 0.234 | 12.93 | 15.80 | 19.36 | 1.33 | 3.39 | 0.12 | 0.90 | 2.59 | -21.93 | 0.71 | 11.38 | -3.26 |
| TON1187 | 0.079 | 13.97 | 14.95 | 16.83 | 3.70 | 1.91 | 0.20 | 1.10 | 2.56 | -20.25 | 0.77 | 10.77 | -3.37 |
| TEX1156+213 | 0.349 | 15.38 | 15.78 | 14.86 | 2.50 | 1.07 | 0.12 | 1.98 | 2.60 | -22.95 | 0.67 | 11.75 | -3.01 |
| Q1214+1804 | 0.374 | 16.36 | 16.48 | 12.05 | 1.11 | 0.25 | 0.40 | 1.97 | 2.59 | -22.44 | 0.66 | 11.54 | -3.09 |
| PG1404+226 | 0.098 | 14.35 | 14.70 | 17.08 | 7.62 | 2.99 | 0.52 | 1.04 | 2.57 | -20.97 | 0.77 | 11.05 | -4.32 |
| PG1415+451 | 0.114 | 13.65 | 14.02 | 15.22 | 10.56 | 1.50 | 0.04 | 1.30 | 2.57 | -22.01 | 0.76 | 11.46 | -3.70 |
| PG1626+554 | 0.132 | 13.80 | 14.78 | 16.23 | 8.55 | 2.04 | 0.04 | 1.53 | 2.57 | -21.60 | 0.75 | 11.29 | -3.18 |
| 4C73.18 | 0.302 | 13.55 | 16.42 | 17.58 | 1.44 | 1.16 | 0.18 | 0.90 | 2.60 | -21.94 | 0.69 | 11.36 | -2.83 |
| PKS2251+11 | 0.325 | 13.53 | 15.70 | 18.62 | 2.94 | 2.43 | 0.05 | 0.90 | 2.60 | -22.86 | 0.68 | 11.72 | -3.23 |
5. Discussion
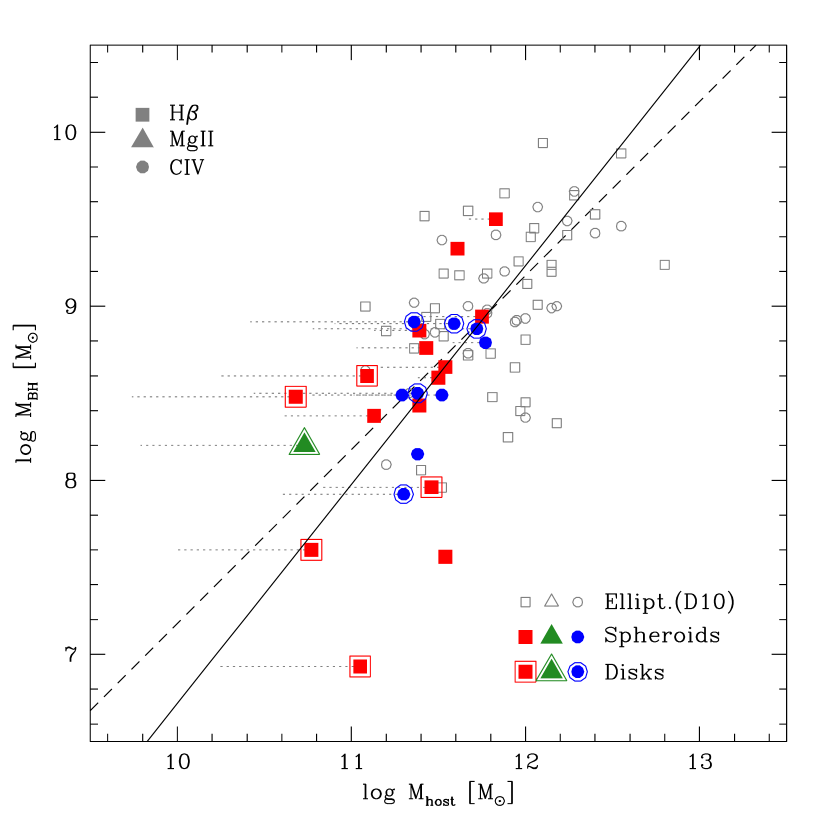
In Figure 4 we show the – relation for quasar host galaxies at . The dataset (62 objects from Decarli et al. 2010, plus 25 objects with resolved host galaxies from the present study) span over 2 dex both in and . The same – relation observed for inactive galaxies appears to hold through all the sampled range, from to M⊙ in terms of . We find that (in excellent agreement with the =0.0015 value reported by Marconi & Hunt, 2003, for inactive galaxies) with a 0.44 dex scatter. Only 3 sources (J02321+0008, PG1404+226 from this study; 1001+291 from the old sample) lie more than 2- below the relation. Since the sampled parameter space is about 5 times larger than the dispersion of the relation, we can exclude that the observed – relation is the upper envelope of a population of quasars with relatively small black holes hosted by very massive galaxies. The best bilinear regression fit of the relation is:
| (1) |
consistent with the relations with a constant / ratio, as observed in quiescent galaxies in the local Universe (Marconi & Hunt, 2003; Häring & Rix, 2004).
When considering subsets of our data, the high-mass end shows a slightly smaller scatter (see Table 4).
For twelve objects the host galaxies are found to be best described by a Sersic law with small index (), suggesting the presence of significant disc components. In particular, PG1404+226 (incidentally, the object showing the smallest and the largest deviation with respect to the – relation in our sample) shows clear spiral arms in the residuals of the host galaxy model. From local galaxy studies, is found to be more sensitive to the properties of the spheroidal stellar component rather than of the whole galaxy. On the other hand, a bulge+disc decomposition is practically impossible with ground-based images of quasar host galaxies at relatively high redshift. Here we attempt a rule-of-thumb correction starting from the Sersic index value. We assume that the bulge-to-total luminosity ratio in the rest-frame band, , scales with the Sersic index as follows:
| (2) |
This simple analytical form roughly traces the bulk of the values for , as found by Simard et al. (2011), who performed accurate image deconvolution for million galaxies from the SDSS. Furthermore, it is consistent with the operative hypothesis that all the galaxies well described by a de Vaucouleurs profile () are bulge dominated (), as assumed in our previous study. The effect of this correction is to move disc-dominated host galaxies towards the left side of Figure 4. In particular, all but one source at M⊙ would lie above the local relation. The best fit relation is indeed flatter ( instead of ), but still consistent with the linear case. The scatter is also increased (0.53 dex, computed over the whole sample; 0.61 and 0.55 dex in the small and small subsets respectively). We stress that the correction reported in equation 2 is uncertain, because of the wide range of values reported for any given . However, we remark that any correction for the would make the case against a population of under-massive black holes in very massive galaxies even stronger.
A similar argument can be used to evaluate how our results are affected by different assumptions on the star formation history. In our study, we adopted the mass-to-light ratio () of a single stellar population originated at and passively evolving down to . However, objects with significant disc contaminations are expected to have a younger stellar population than old, passive spheroids. This would imply smaller , i.e., less massive host galaxies for a given observed host luminosity. This would make the case against a quasar population lying below the observed – relation even more robust.
| Subsample | N | RMS | |
|---|---|---|---|
| dex | dex | ||
| (1) | (2) | (3) | (4) |
| Without correction: | |||
| ALL | 87 | -2.842 | 0.444 |
| M⊙ | 33 | -2.627 | 0.351 |
| M⊙ | 54 | -2.974 | 0.445 |
| M⊙ | 49 | -2.889 | 0.401 |
| M⊙ | 38 | -2.782 | 0.492 |
| With correction: | |||
| ALL | 87 | -2.697 | 0.524 |
| M⊙ | 33 | -2.623 | 0.356 |
| M⊙ | 54 | -2.886 | 0.603 |
| M⊙ | 46 | -2.886 | 0.419 |
| M⊙ | 41 | -2.485 | 0.554 |
6. Conclusions
We measured black hole masses and host galaxy luminosities in a sample of 25 low-redshift () quasars selected to have modest ( M⊙) black hole masses. For each object we inferred stellar masses. This allowed us to significantly expand the sampled range of and for quasars. We found that:
-
i-
The – relation holds over all the 2 dex both in terms of and . The relation has a scatter of 0.44 dex, i.e., the sampled parameter space is 5 times larger.
-
ii-
The slope of the – relation in quasars is consistent with unity (in a log-log plane), consistently with what observed in quiescent galaxies.
-
iii-
The scatter of the relation increases by dex at the low-mass end.
-
iv-
After applying a simplistic correction for the disc contribution in objects with low Sersic indexes, the slope of the – relation is smaller but still consistent with the linear case.
-
v-
No evidence of a population of quasars with relatively modest and very high values is found.
Further studies at even lower masses ( M⊙) and at higher redshift could provide further constraints on the early black hole growth and the nature of the seeds, and to pin down the evolution of the –host galaxy relations along the Cosmic Time. This requires extremely high quality imaging of quasar host galaxies that would become possible with the next generation of ELT and laser assisted AO imagers.
Acknowledgments
RD acknowledges funding from Germany’s national research center for aeronautics and space (DLR, project FKZ 50 OR 1104). Based on observations made with the Nordic Optical Telescope, operated on the island of La Palma jointly by Denmark, Finland, Iceland, Norway, and Sweden, in the Spanish Observatorio del Roque de los Muchachos of the Instituto de Astrofisica de Canarias. This research has made use of the NASA/IPAC Extragalactic Database (NED) which is operated by the Jet Propulsion Laboratory, California Institute of Technology, under contract with the National Aeronautics and Space Administration.
Facilities: NOT(NOTCAM) SDSS HST
References
- Bahcall et al. (1997) Bahcall J.N., Kirhakos S., Saxe D.H. & Schneider D.P., 1997, ApJ, 479, 642
- Batcheldor (2010) Batcheldor D., 2010, ApJ Letters, 711, 108
- Bennert et al. (2008) Bennert N., Canalizo G., Jungwiert B., Stockton A., Schweizer F., Peng C.Y., Lacy M., 2008, ApJ, 677, 846
- Bennert et al. (2011) Bennert V.N., Auger M.W., Treu T., Woo J.-H., Malkan M.A., 2011 (arXiv:1102.1975)
- Canalizo et al. (2007) Canalizo G., Bennert N., Jungwiert B., Stockton A., Schweizer F., Lacy M., Peng C., 2007, ApJ, 669, 801
- Cisternas et al. (2011) Cisternas M., Jahnke K., Inskip K.J., Kartaltepe J., Koekemoer A.M., Lisker T., Robaina A.R., Scodeggio M., et al., 2011, ApJ, 726, 57
- Croom et al. (2004) Croom S.M., Schade D., Boyle B.J., Shanks T., Miller L., Smith R.J., 2004, ApJ, 606, 126
- Decarli et al. (2007) Decarli R., Gavazzi G., Arosio I., Cortese L., Boselli A., Bonfanti C., Colpi M., 2007, MNRAS, 381, 136
- Decarli et al. (2008a) Decarli R., Labita M., Treves A., Falomo R., 2008a, MNRAS, 387, 1237
- Decarli et al. (2008b) Decarli R., Dotti M., Fontana M., Haardt F., 2008b, MNRAS Letters, 386, 15
- Decarli et al. (2010a) Decarli R., Falomo R., Treves A., Kotilainen J.K., Labita M., Scarpa R., 2010a, MNRAS, 402,2441
- Decarli et al. (2010b) Decarli R., Falomo R., Treves A., Labita M., Kotilainen J.K., Scarpa R., 2010b, MNRAS, 402, 2453
- Decarli, Dotti & Treves (2011) Decarli R., Dotti M., Treves A., 2011, MNRAS, 416
- De Rosa et al. (2011) De Rosa G., Decarli R., Walter F., Fan X., Jiang L., Kurk J., Pasquali A., Rix H. W., 2011, ApJ, 739, 56
- Di Matteo, Springel & Hernquist (2005) Di Matteo T., Springel V. & Hernquist L., 2005, Nature, 433, 604
- Dong et al. (2007) Dong X., Wang T., Yuan W., Zhou H., Shan H., Wang H., Lu H., Zhang K., 2007, ASPC, 373, 57
- Dunlop et al. (2003) Dunlop J.S., McLure R.J., Kukula M.J., Baum S.A., O’Dea C.P., Hughes D.H., 2003, MNRAS, 340, 1095
- Evans & Koratkar (2004) Evans I.N., Koratkar A.P., 2004, ApJ Supp., 150, 73
- Falomo et al. (2005) Falomo R., Kotilainen J.K., Scarpa R., Treves A., 2005, A&A, 434, 469
- Ferrarese & Merritt (2000) Ferrarese L., Merritt D., 2000, ApJ Letters, 539, 9
- Fine, Jarvis & Mauch (2011) Fine S., Jarvis M.J., Mauch T., 2011, MNRAS, 412, 213
- Floyd et al. (2004) Floyd D.J.E., Kukula M.J., Dunlop J.S., et al., 2004, MNRAS, 355, 196
- Gallo et al. (2008) Gallo E., Treu T., Jacob J., Woo J.H.,Marshall P.J., Antonucci R., 2008, ApJ, 680, 154
- Gebhardt et al. (2000) Gebhardt K., Bender R., Bower G., Dressler A., Faber S.M., Filippenko A.V., Green R., Grillmair C., et al., 2000, ApJ Letter, 539, 13
- Graham et al. (2011) Graham A.W., Onken C.A., Athanassoula E., Combes F., 2011, MNRAS, 412, 2211
- Greene & Ho (2004) Greene J.E., Ho L.C., 2004, 610, 722
- Greene & Ho (2007) Greene J.E., Ho L.C., 2007, 670, 92
- Gultekin et al. (2009) Gultekin K., Richstone D.O., Gebhardt K., Lauer T.R., Tremaine S., Aller M.C., Bender R., Dressler A., et al., 2009 (arXiv:0903.4897)
- Hamilton et al. (2002) Hamilton T.S., Casertano S., Turnshek D.A., 2002, ApJ, 576, 61
- Häring & Rix (2004) Häring N., Rix H.-W., 2004, ApJ Letters, 604, 89
- Hopkins et al. (2007) Hopkins P.F., Hernquist L., Cox T.J., Robertson B., Krause E., 2007, ApJ, 669, 45
- Jahnke et al. (2009) Jahnke K., Bongiorno A., Brusa M., Capak P., Cappelluti N., Cisternas M., Civano F., Colbert J., et al., 2009, submitted to ApJ Letters (arXiv:0907.5199)
- Jiang et al. (2011) Jiang Y.-F., Greene J.E., Ho L.C., 2011, accepted for public. in ApJ (arXiv:1107.4103)
- Kauffmann & Haenelt (2000) Kauffmann G., Haenelt M., 2000, MNRAS, 311, 576
- Kim et al. (2008) Kim M., Ho L.C., Peng C.Y., Barth A.J., Im M., 2008, ApJ Suppl., 179., 283
- King (2005) King A., 2005, ApJ Letters, 635, 121
- Kormendy & Richstone (1995) Kormendy J. & Richstone D., 1995, ARA&A, 33, 581
- Kotilainen & Falomo (2004) Kotilainen J.K., Falomo R., 2004, A&A, 424, 107
- Kotilainen et al. (2007) Kotilainen J.K., Falomo R., Labita M., Treves A., & Uslenghi M., 2007, ApJ 660 1039
- Kotilainen et al. (2009) Kotilainen J.K., Falomo R., Decarli R., Treves A., Uslenghi M., Scarpa R., 2009, ApJ, 703, 1663
- Kukula et al. (2001) Kukula M.J., Dunlop J.S., McLure R.J., et al., 2001, MNRAS, 326, 1533
- Kurk et al. (2007) Kurk J.D., Walter F., Fan X., Jiang L., Riechers D.A., Rix H.-W., Pentericci L., Strauss M.A., et al., 2007, ApJ, 669, 32
- Labita et al. (2009) Labita M., Decarli R., Treves A., Falomo R., 2009, MNRAS, 399, 2099
- Magorrian et al. (1998) Magorrian J., Tremaine S., Richstone D., et al., 1998, AJ, 115, 2285
- Malbon et al. (2007) Malbon R.K., Baugh C.M., Frenk C.S., Lacey C.G., 2007, MNRAS, 382, 1394
- Mannucci et al. (2001) Mannucci F., Basile F., Poggianti B. M. et al., 2001, MNRAS, 326, 745
- Marconi & Hunt (2003) Marconi A., & Hunt L.K., 2003, ApJ Letters, 589, 21
- Marconi et al. (2009) Marconi A., Axon D.J., Maiolino R., Nagao T., Pietrini P., Risaliti G., Robinson, A., Torricelli G., 2009, ApJ Letters, 698, 103
- McLure et al. (2006) McLure R.J., Jarvis M.J., Targett T.A., Dunlop J.S., Best P.N., 2006, MNRAS, 368, 1395
- Merloni et al. (2010) Merloni A., Bongiorno A., Bolzonella M., Brusa M., Civano F., Comastri A., Elvis E., Fiore F., et al., 2010, ApJ, 708, 137
- Netzer et al. (2007) Netzer H., Lira P., Trakhtenbrot B., Shemmer O., Cury I., 2007, ApJ, 671, 1256
- Peng et al. (2006a) Peng C.Y., Impey C.D., Ho L.C., Barton E.J., Rix H.-W., 2006a, ApJ, 640, 114
- Peng et al. (2006b) Peng C.Y., Impey C.D., Rix H.-W., Kochanek C.S., Keeton C.R., Falco E.E., Lehár J., McLeod B.A., 2006b, ApJ, 649, 616
- Peterson & Wandel (2000) Peterson B.M. & Wandel A., 2000, ApJ Letters, 540, 13
- Richards et al. (2011) Richards G.T., Kruczek N.E., Gallagher S.C., Hall P.B., Hewett P.C., Leighly K.M., Deo R.P., Kratzer R.M., et al., 2011, AJ, 141, 167
- Ridgway et al. (2001) Ridgway S., Heckman T., Calzetti D., Lehnert M., 2001, ApJ, 550, 122
- Robertson et al. (2006) Robertson B., Hernquist L., Cox T.J., Di Matteo T., Hopkins P.H., Martini P., Springel V., 2006, ApJ, 641, 90
- Shankar (2009) Shankar F., 2009, New Astr. Review, 53, 57
- Shen et al. (2010) Shen Y., Richards G.T., Strauss M.A., Hall P.B., Schneider D.P., Snedden S., Bizyaev D., Brewington H., et al., 2010, arXiv:1006.5178
- Silk & Rees (1998) Silk J., Rees M.J., 1998, A&A Letter, 331, 1
- Simard et al. (2011) Simard L., Mendel J.T., Patton D.R., Ellison S.L., McConnachie A.W., 2011, arXiv:1107.1518
- Targett et al. (2011) Targett T.A., Dunlop J.S., McLure R.J., MNRAS submitted (arXiv:1107.2397)
- Thorton et al. (2008) Thornton C.E., Barth A.J., Ho L.C., Rutledge R.E., Greene, J.E., 2008, ApJ, 686, 892
- Trakhtenbrot & Netzer (2010) Trakhtenbrot B., Netzer H., 2010, MNRAS Letters, 406, 35
- Uslenghi & Falomo (2008) Uslenghi M. & Falomo, R. 2008, Proc. Erice, in press.
- Véron-Cetty & Véron (2010) Véron-Cetty M.-P., Véron P., 2010, A&A, 518, 10
- Vestergaard & Wilkes (2001) Vestergaard M., Wilkes B.J., 2001, ApJ Suppl., 134, 1
- Vestergaard (2002) Vestergaard M., 2002, ApJ, 571, 733
- Vestergaard & Peterson (2006) Vestergaard M., Peterson B.M., 2006, ApJ, 641, 689
- Volonteri & Natarajan (2009) Volonteri M., Natarajan P., 2009, MNRAS, 400, 1911
- Walter et al. (2003) Walter F., Bertoldi F., Carilli C., Cox P., Lo K.Y., Neri R., Fan X., Omont A., et al., 2003, Nature, 424, 406
- Walter et al. (2004) Walter F., Carilli C., Bertoldi F., Menten K., Cox P., Lo K.Y., Fan X., Strauss M., 2004, ApJ Letters, 615, 17
- Willott, McLure & Jarvis (2003) Willott C.J., McLure R.J., Jarvis M.J.,2003, ApJ Letters, 587, 15
- Willott et al. (2010) Willott C., Albert L., Arzoumanian D., Bergeron J., Crampton D., Delorme P., Hutchings J.B., Omont A., et al., 2010, AJ, 140, 546
- Wyithe & Loeb (2006) Wyithe J.S.B., Loeb A., ApJ, 634, 910
- Xiao et al. (2011) Xiao T., Barth A.J., Greene J.E., Ho L.C., Bentz M.C., Ludwig R.R., Jiang Y.,
- York et al. (2000) York D.G., Adelman J., Anderson J.E.Jr., Anderson S.F., Annis J., Bahcall N.A., Bakken J.A., Barkhouser R., Bastian S., Berman E., et al., 2000, AJ, 120, 1579