Wide-field imaging of NGC 4365’s globular cluster system: The third subpopulation revisited
Abstract
Analysis of the globular cluster (GC) system of the giant elliptical (E3) galaxy NGC 4365, from eight Hubble Space Telescope/Advanced Camera for Surveys (ACS) pointings and a wide-field Subaru/SuprimeCam (S-Cam) image, is presented. Using magnitude, colour and size criteria we obtain a catalogue of GC candidates. We also measure the photometric properties of the galaxy starlight, including a new measure of the effective radius.We determine the lower limit on the number of GCs to be and show that the GC system extends beyond 134 kpc (9.5 galaxy effective radii). We revisit the question of whether NGC 4365 has a bimodal or trimodal GC colour distribution and find support for three distinct GC colour subpopulations (i.e. blue, green and red). Sérsic profile fits to the radial surface density of each subpopulation reveal that the blue GCs are more extended than either red or green GCs. The median half light radii for GCs in the blue, green and red subpopulations are , and parsec respectively. The estimated subpopulation ellipticities are , and for the blue, green and red GCs, where alignment with the photometric position angle of the galaxy () is assumed. A KS test on the mass functions show a per cent probability that all three subpopulations are distinct from one another. We also find radial gradients of GC size and colour (metallicity) and a blue tilt. The properties, including surface density profile, position angle, ellipticity and radial colour gradient, of the red GC subpopulation are very similar to the properties of NGC 4365’s starlight. This result supports the hypothesis that red GCs are formed along with the bulk of the diffuse starlight in the galaxy. NGC 4365 has a kinematically distinct core and a significant misalignment between the photometric and kinematic major axes. We discuss the possibility that these kinematic features are related to the presence of the distinct third GC subpopulation. We briefly discuss implications for the formation of NGC 4365, finding that major merger, multi-phase collapse and accretion formation scenarios could all account for the existence of a third GC subpopulation.
1 Introduction
1.1 Globular cluster colour bimodality
Bimodality in the colour distribution of GC systems in elliptical galaxies was first clearly demonstrated by Zepf & Ashman (1993). Since then, it has been shown to be a common feature in large galaxies of all Hubble types (e.g. Forbes, Brodie & Grillmair 1997; Larsen et al. 2001; Peng et al. 2006). Spectroscopic observations of small samples of extragalactic GCs have generally found them to be very old ( 12 Gyrs), similar to their Milky Way counterparts. Such old ages support the interpretation of colours as a good proxy for metallicity. Thus the photometric observations of large samples of GCs indicate two metallicity subpopulations: a blue, or metal poor, subpopulation and a red, or metal rich, subpopulation. These metallicity subpopulations often reveal distinct kinematic distributions (Lee et al., 2010; Arnold et al., 2011; Foster et al., 2011) similar to those observed in the Milky Way’s GC system (Zinn, 1985). The mean colour/metallicity of the two subpopulations correlate with the host galaxy luminosity (Peng et al., 2006). The presence of distinct subpopulations indicates that GC system formation was not a simple one-step process with (at least) two phases of GC formation suggested. Various models have been proposed to explain the two formation modes (Ashman & Zepf, 1992; Forbes et al., 1997; Côté et al., 1998; Beasley et al., 2002; Bekki et al., 2008).
The interpretation of colour bimodality corresponding to metallicity bimodality has been challenged recently by Yoon et al. (2006), Cantiello & Blakeslee (2007) and Blakeslee et al. (2010) who suggested that the transformation from colour into metallicity is strongly non-linear. Beyond the Milky Way, there are very few GC systems observed with reasonable numbers of GCs in which to examine the spectroscopic metallicity distribution directly. However for those that do exist, i.e. NGC 4472 (Strader et al., 2007), NGC 5128 (Woodley et al., 2010) and NGC 4594 (Alves-Brito et al., 2011) spectroscopic metallicity bimodality is confirmed.
With large photometric samples one can also examine other properties of extragalactic GC subpopulations. These include their radial and azimuthal distributions, luminosity or mass functions and physical sizes (if imaging with suitable resolution is available). Such properties also often reveal differences between the blue and red subpopulations (see review by Brodie & Strader, 2006). For example, the red GCs are usually more centrally concentrated than the blue GCs, and have a density profile, mean colour and spatial distribution that matches the bulge/spheroid component of the galaxy (Forbes & Forte, 2001). The blue GCs have been measured to have larger mean sizes on average than the red GCs (Jordán, 2004).
Although most large galaxies with well-studied GC systems reveal clear colour bimodality, there are some exceptions (see selected galaxies in Peng et al., 2006). One notable exception is the giant elliptical galaxy NGC 4365 which reveals a broad colour distribution at all GC magnitudes. Here we revisit the issue of a possible third GC subpopulation at intermediate colours in NGC 4365.
1.2 GC subpopulations of NGC 4365
Here we study NGC 4365, a giant elliptical (E3) galaxy (Ferrarese et al., 2006) on the far edge of the Virgo Cluster, 23.1 Mpc away (Blakeslee et al., 2009) with mag (Ferrarese et al., 2006). There is debate as to whether the apparent Kinematically Distinct Core (KDC) of the galaxy is an actual kinematic property or the observed effect of triaxial orbits (e.g. Davies et al., 2001; van den Bosch et al., 2008). NGC 4365 is also one of few galaxies that rotate about the photometric minor rather than major axis (Davies et al., 2001). Tal et al. (2009) claim evidence of a faint fan feature in the SW of the galaxy.
Forbes (1996) and Forbes et al. (1996) studied the GC system properties of NGC 4365 and other giant elliptical galaxies with KDCs. Bimodality was not suspected at the time in most GC systems and they found no significant differences between NGC 4365 and other giant elliptical galaxies with KDCs. Two independent groups working with HST/WFPC2 imaging, Larsen et al. (2001) and Kundu & Whitmore (2001), found that the GC system of NGC 4365 was best fit by a unimodal distribution, whereas most of the elliptical galaxies in their samples were best fit by bimodal distributions. Soon afterwards, Puzia et al. (2002) analysed the GC system of NGC 4365, using the combination of HST/WFPC2 optical and VLT/ISAAC K-band photometry to break the age-metallicity degeneracy, which is a problem inherent to photometric analysis of GCs. In their analysis they found what appeared to be a slightly younger and very metal rich subpopulation in addition to two old subpopulations. When Larsen et al. (2003) published Lick indices (obtained from Keck/LRIS) of 14 GCs in NGC 4365 it still looked likely that the galaxy hosted some old GCs and some very metal rich, young GCs that “conspire to produce the single broad distribution observed in optical colors” (Larsen et al., 2003).
However, when Brodie et al. (2005) extended the sample of NGC 4365 GCs with Lick indices by adding 19 new objects (also re-observing 3 objects from Larsen et al., 2003) they found a uniform old age for all the GCs in the sample and suggested that the third GC subpopulation in the system, also found at intermediate optical colours, was due to a population with intermediate metallicity not young age. Hempel & Kissler-Patig (2004) published “better age determinations” for the intermediate GC subpopulation by including observations in another infrared filter and Kundu et al. (2005) approached the problem with deeper HST observations in the H-band. Larsen et al. (2005) confirmed the presence of intermediate optical colour GCs at small galactocentric radii (from an analysis of optical HST/ACS photometry) and compared photometric age determinations with spectroscopic ones to assess the accuracy of photometrically determined ages. This work cast some doubt on the accuracy with which ages and metallicities can be measured using a combination of infrared and optical photometry. Later, Hempel et al. (2007) published a photometric comparison of elliptical galaxies in the centres of clusters and those in smaller groups, claiming (from optical and near-infrared photometry) that many group elliptical galaxies (including NGC 4365) host intermediate age GCs. Using g, z and K filter photometry, Chies-Santos et al. (2011) showed that NGC 4365’s GCs all have similar ages (much like the other large ellipticals in their sample) but that the distribution in the g-z direction was significantly different to other large ellipticals.
While there is still debate on the nature (in age, colour and metallicity) of a third GC subpopulation in NGC 4365, there is consensus that the GC system of NGC 4365 is different to other galaxies of similar luminosity. Most analyses of NGC 4365’s GC system subpopulations to date have been done with tens or hundreds of GCs. We revisit this issue in colour using thousands of GC candidates from optical photometry over most of the spatial extent of the galaxy, to analyse whether there is statistically significant indication of three colour subpopulations in its GC system.
1.3 Paper Structure
In Section 2 and 3 we overview the data acquisition and reduction for the Subaru/S-Cam and HST/ACS photometry respectively. We describe the GC candidate selection criteria and detail the photometric properties of the GC candidate samples in Section 4. Section 5 describes the properties of the galaxy light and we proceed to the analysis of the GC system properties in Section 6, first in terms of the properties of the total GC system and then in terms of the subpopulations and their characteristics. We discuss results in Section 7 before concluding.
2 Subaru/Suprime Cam Data
2.1 Observations and data reduction
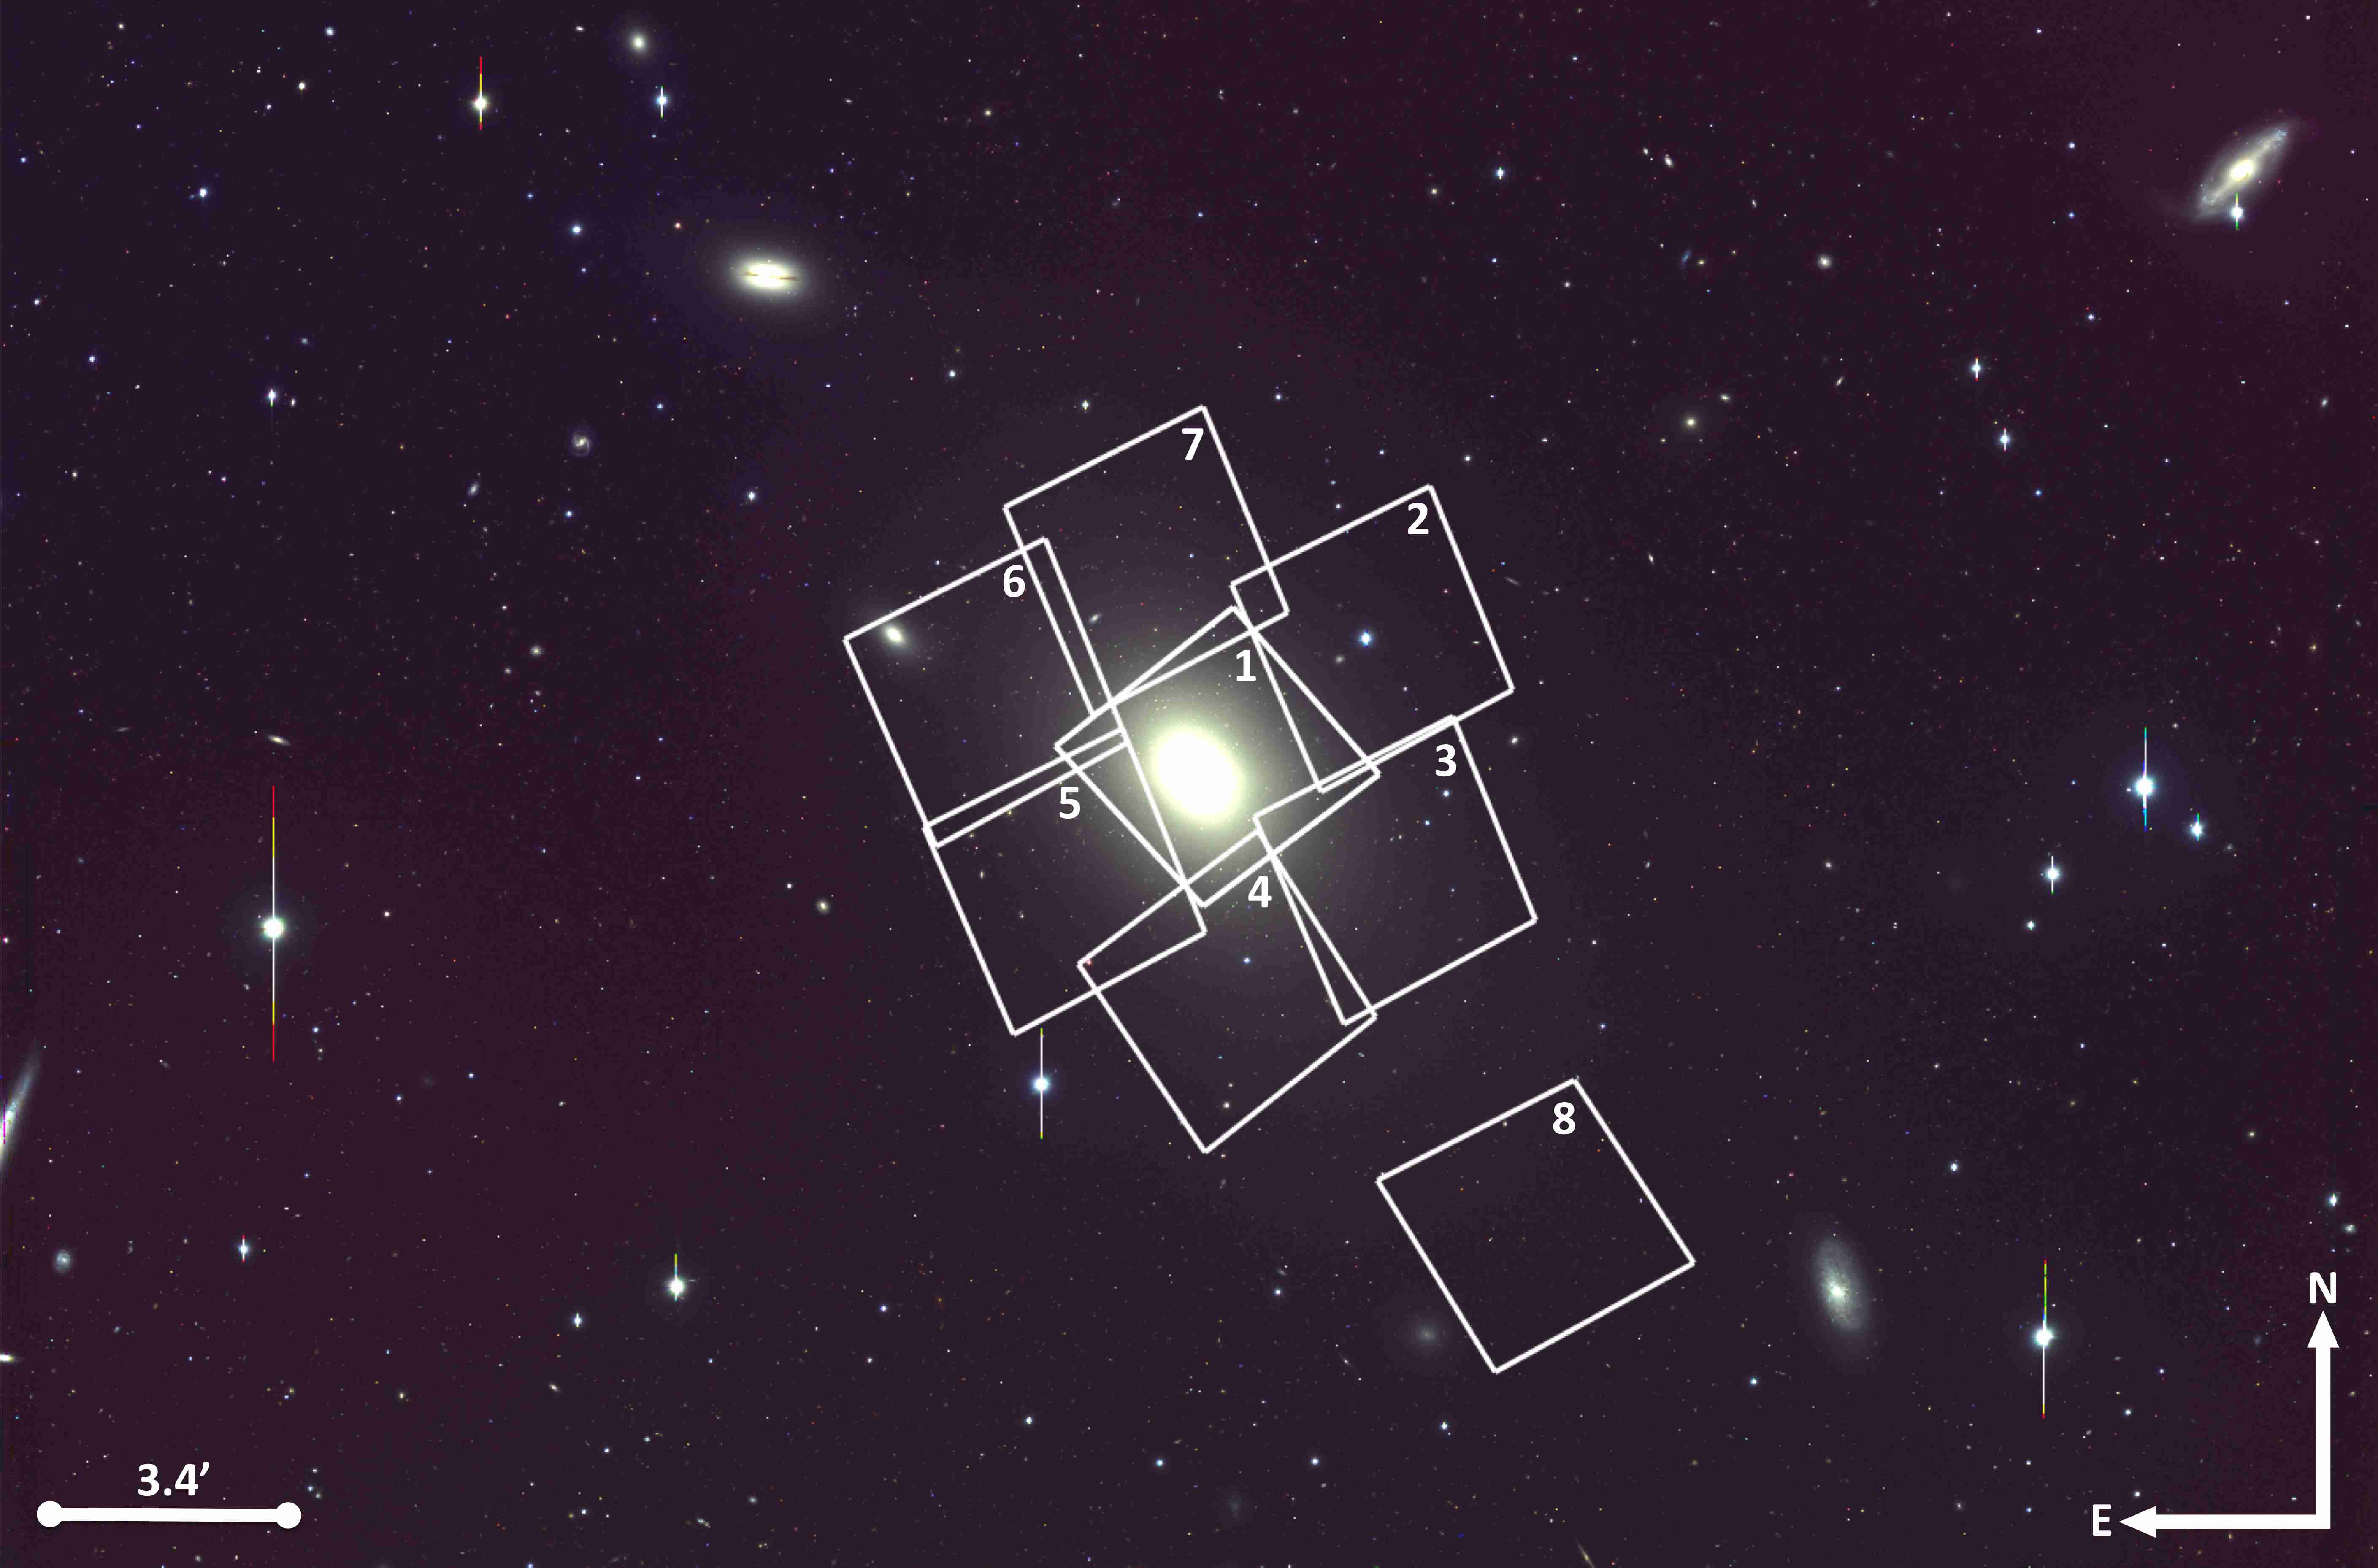
On 2008, April we obtained arcmin three-filter imaging of NGC 4365 using Subaru/S-Cam. Conditions were good and the worst seeing was arcsec, exposure times were s, s and s for , and filters respectively. The images were bias subtracted, flat field corrected and stacked using the SDFRED package (Yagi et al., 2002; Ouchi et al., 2004) and put onto the USNO-B2 astrometric system. Figure 1 shows a combination of the , and filter images. The S-Cam instrument has a pixel scale of arcsec.
The NGC 4365 galaxy light was modelled and subtracted in each of the three filters using the IRAF task ELLIPSE before an object detection algorithm was employed. This was done to increase the success with which the DAOFIND detection algorithm finds faint objects in the central regions of the galaxy (it is unsuccessful at finding objects in areas in which the background surface brightness varies). The standard deviation of the background, after galaxy subtraction, was counts in , counts in and counts in . Detection thresholds of , and in , and respectively were used so as to probe as deep as possible in all areas of the images, with the assurance that the selection criteria employed later (see Section 4.2) would remove most spurious detections (due to cosmic rays, background fluctuations and galaxy subtraction artifacts).
2.2 Photometry and calibration
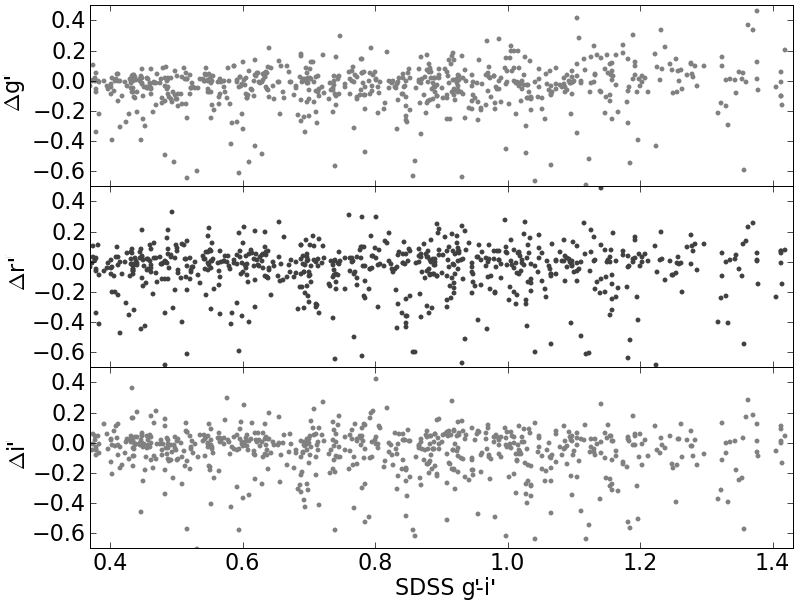
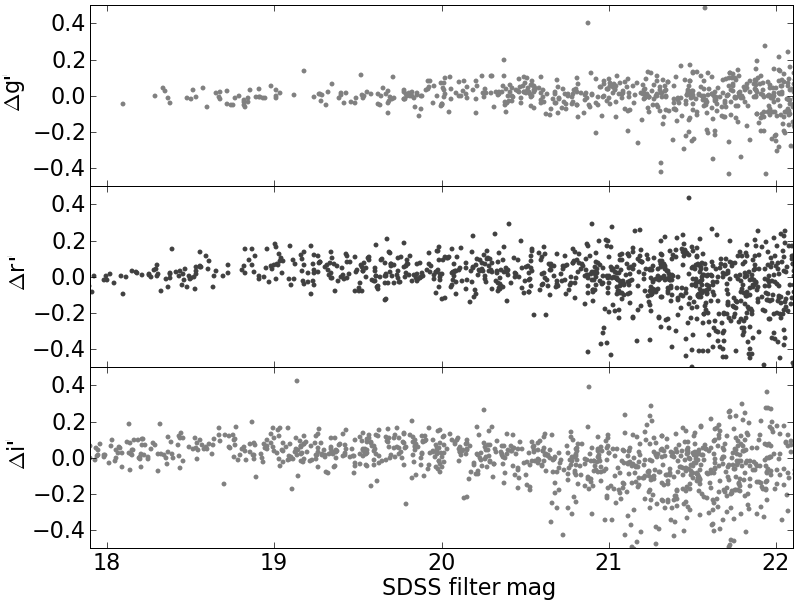
The point-like objects (see Section 4.2.1 for details on point source determination) brighter than were used to define an optimum aperture for which to extract the photometry. The photometry was extracted at a radius of 3.5 pixels in and 3.0 pixels in and (the seeing was in and but in the filter). The radius of extraction was chosen as a trade-off between increasing error from background noise and increasing uncertainty in the correction for light outside the extraction aperture (i.e. an aperture correction). The aperture correction was mag in , mag in and mag in . The sky value was calculated as the mode of all pixels in an annulus between 15 and 20 pixels from the centre of the object.
Standard stars were not observed with NGC 4365, instead the photometry was calibrated using bright point-like objects () detected in the NGC 4365 field that were also found in the Sloan Digital Sky Survey (SDSS) catalogue. Both PSF and model derived SDSS magnitudes were used for this and no systematic difference was found in the results. There were 1822, 2174 and 2813 cross matched objects for calibration in , and filters respectively and the photometric calibration zeropoints were determined from a best fit linear relation between the SDSS catalogue magnitudes and the S-Cam instrumental magnitudes. These were found to be , and on the AB photometric system. The zeropoint corrected residuals of point-like objects in each filter are shown in Figure 2, plotted against colour (left) and filter magnitude (right). The SDSS and S-Cam , and filters show good agreement with no obvious systematic colour or magnitude trend.
It was necessary to correct for foreground dust extinction as such a correction was not applied to the SDSS calibration objects. We used the Schlegel et al. (1998) dust maps to calculate the extinction correction in each filter. The values were compared at different positions across the field and not found to vary significantly. For , and filters the extinction correction values used were , and mag. Hereafter we quote extinction corrected magnitudes and colours.
3 HST/ACS Data
3.1 Observations and object measurement
We obtained, from the Hubble Legacy Archive, and ( and for one pointing) filter imaging for eight separate pointings of the HST/ACS instrument around NGC 4365. Table 1 summarises these observations and Figure 1 shows the ACS pointing footprint on the S-Cam image. These archival data probe down to , at a per cent completeness level (Jordán et al., 2007). The resolution of HST/ACS data (pixel scale is arcsec) partially resolves GCs at the distance of NGC 4365, 23.1 Mpc away (Blakeslee et al., 2009).
| Central | Exposures | HST | |||
|---|---|---|---|---|---|
| R.A. | Dec. | Filter | Time (s) | ID | |
| F475W | 750 | ||||
| 1 | 12:24:27.0 | 07:19:20.8 | F850LP | 1210 | 9401 |
| F475W | 680 | ||||
| 2 | 12:24:17.5 | 07:21:09.5 | F850LP | 1170 | 10582 |
| F475W | 680 | ||||
| 3 | 12:24:16.0 | 07:17:37.1 | F850LP | 1170 | 10582 |
| F475W | 680 | ||||
| 4 | 12:24:26.3 | 07:15:44.8 | F850LP | 1170 | 10582 |
| F475W | 680 | ||||
| 5 | 12:24:36.4 | 07:17:25.1 | F850LP | 1170 | 10582 |
| F475W | 680 | ||||
| 6 | 12:24:41.3 | 07:20:18.2 | F850LP | 1170 | 10582 |
| F475W | 680 | ||||
| 7 | 12:24:31.5 | 07:22:20.4 | F850LP | 1170 | 10582 |
| F475W | 1744 | ||||
| 8 | 12:24:07.2 | 07:12:11.3 | F775W | 1624 | 9488 |
The eight individual ACS fields were analysed using a custom built pipeline (see e.g. Strader et al. 2006 and Spitler et al. 2006) to find small, round objects and measure their magnitudes and half light radii (henceforward referred to as object size). For details on the methods used by the pipeline including point spread function determination see Strader et al. (2006).The object lists from each field were collated, with the arithmetic mean taken of the sizes and magnitudes in the field overlap areas, and associated errors adjusted to reflect the more accurate measurement.
The measured magnitudes and sizes are compared with those published for objects in the central field (Jordán et al., 2009). The magnitude measurements show no evidence of a statistically-significant systematic offset from the published data. The scatter increases to fainter objects but is on the order of 0.1 magnitudes. The size measurements in this work show a small arcsec systematic offset to smaller sizes attributed to differences in size measurement techniques.
4 GC candidate Selection
4.1 HST/ACS GCs
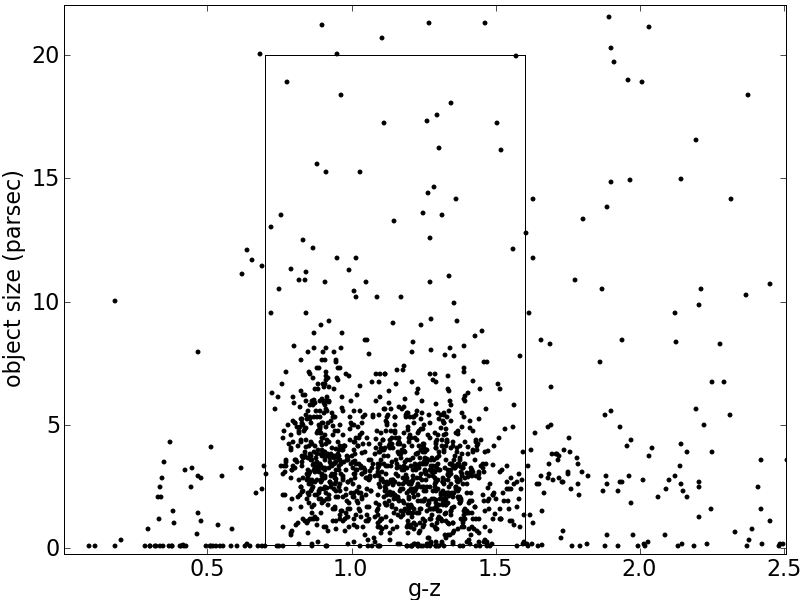
GC candidates were selected from the HST/ACS images based on their size, colour and magnitude. The GC candidate distribution is selected to have colours and sizes . The choice of colour upper and lower bounds was based on the colour size diagram shown in Figure 3. There is a clear drop off in the density of objects bluewards of 0.75 and a similar but less clear drop off redwards of 1.6 ( using the empirical transformation of Peng et al. (2006)). While most of the GC candidates in Figure 3 are resolved, the redder GC candidates show a size distribution that overlaps with objects of zero size (objects indistinguishable from stellar point sources). A size cut at 0.1 pc ( arcsec) was made because at smaller sizes the objects did not show a distribution that was centrally concentrated on the galaxy and therefore does not sample mainly GCs. A generous upper bound on size of ( arcsec) was employed to exclude background galaxies but include possible Ultra Compact Dwarfs (UCDs) in the system. Lastly, only objects fainter than (M mag) are considered GC candidates of NGC 4365, following the convention of the ACS VCS published catalogue (Jordán et al., 2009). The catalogue contains no objects fainter than mag. Objects brighter than are most likely to be stars.
4.2 Subaru/SuprimeCam GCs
4.2.1 Point source determination
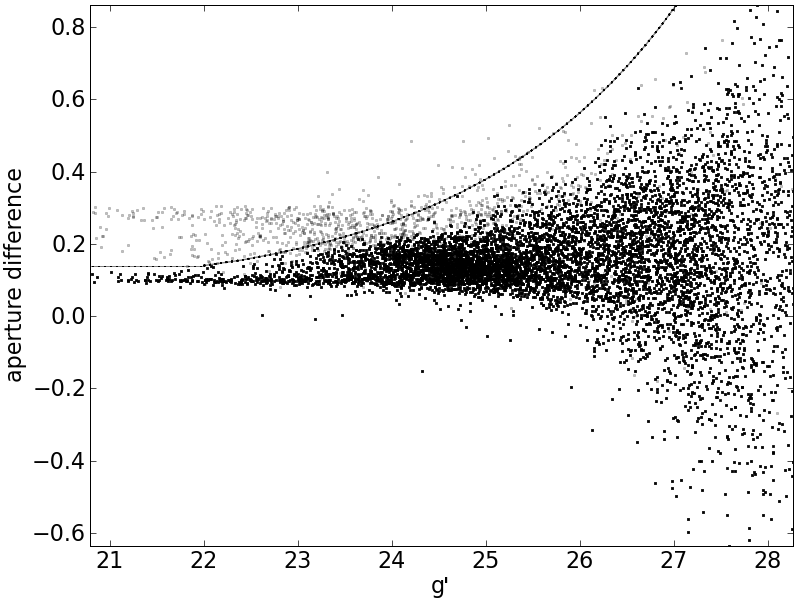
At the distance of NGC 4365, GCs are not resolved by our Subaru observations and consequently they cannot be separated from stars in our Galaxy via a size distinction. By selecting only objects that are unresolved in the S-Cam imaging background galaxies are excluded from the analysis of NGC 4365’s GC system. Here the distinction between a point-like object (mostly stars and NGC 4365 GCs) and an extended object (galaxies) is determined by a measure of the flux difference between two aperture radii. Shown in Figure 5 are the objects that were identified to be point-like in all three filters. Magnitudes were extracted for two apertures different in radius by a half or full pixel (filter dependent) both centered on the object. Extended objects have extra light in the larger aperture compared to point-like objects.
The lists of point-like objects for each filter were cross-matched in position and only objects classed as point-like in all three filters were kept in the sample. This was done using the IRAF task TMATCH with a tolerance in positional offset between images of arcsec (this was determined by the uncertainty in astrometry at the image edges). Because the photometry is deeper in the filter than either or filters this procedure likely excluded genuine faint GCs from the analysis that were detected in but not in either of the other filters. Using a cross-matching technique spurious detections (due to cosmic rays etc.) in any of the three filters were eliminated and only objects with photometry in all three filters selected.
4.2.2 Colour-colour and magnitude selection
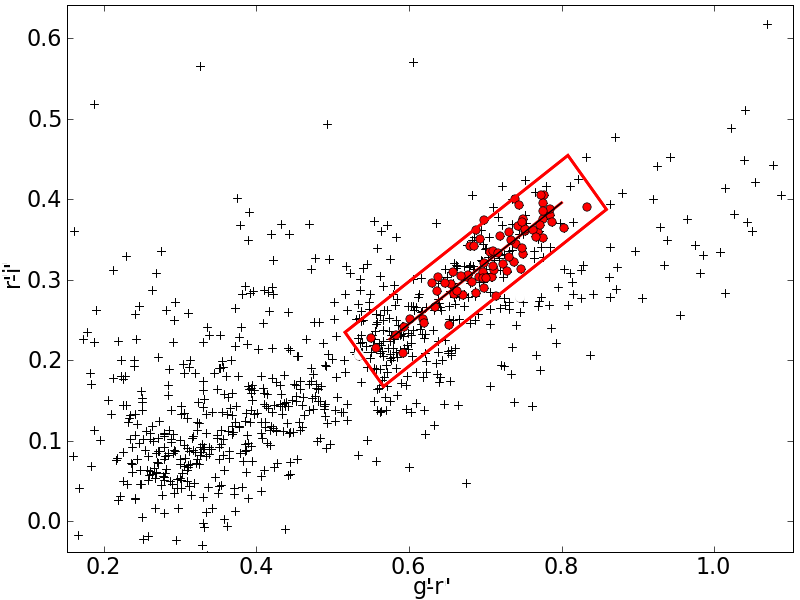
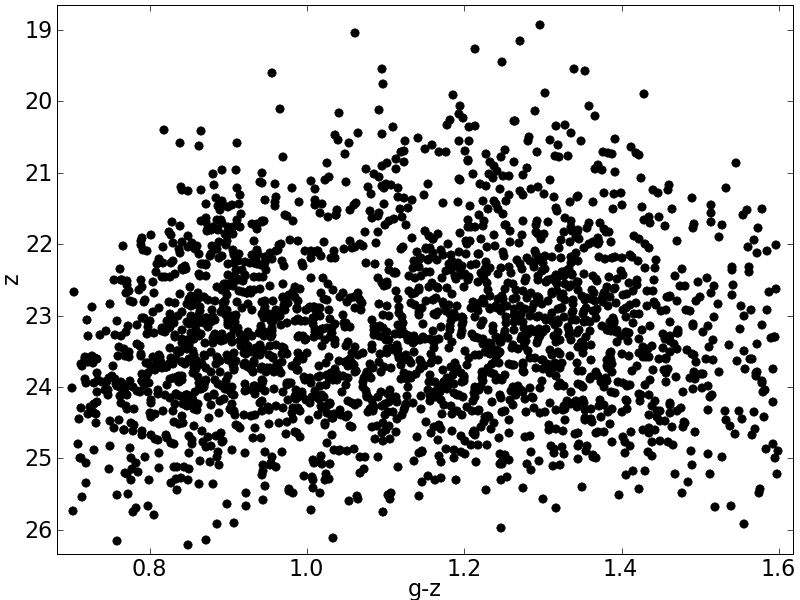
As shown in Figure 3 the HST/ACS is able to partially resolve GCs at the distance of NGC 4365 and can therefore directly distinguish between unresolved foreground stars, GCs and resolved background galaxies. We used the central HST/ACS pointing to determine where on a S-Cam vs. diagram the GC sequence lies by matching S-Cam point source detections with ACS GC candidates. A line was fitted to the brightest S-Cam objects found to be GC candidates in the ACS field and used to make a box in each direction from the best fit GC sequence line. Objects were considered to be consistent with the GC colour-colour definition if the standard error in their photometry placed them within the box (see Figure 6). The selected distribution contains objects with colours , corresponding to metallicities of when the Lee, Park & Hwang (2010) empirical transformation is used.
An upper limit on the magnitude of any GC candidate was set to ( mag) by the brightest GC found by HST/ACS in the central field of NGC 4365. A limit of 0.1 mag in photometric error resulted in a lower limit of mag on the blue end of the colour-colour selection and mag on the red end of the colour-colour selection.
4.3 Contamination and completeness
At galactocentric radii smaller than arcmin S-Cam detection numbers drop due to galaxy subtraction artifacts and at radii greater than arcmin ACS detections are no longer spatially complete due to the tiling pattern of HST/ACS pointings. Therefore only in an annulus between and arcmin from the centre of NGC 4365 is it possible to compare the object detections and photometry for the S-Cam and ACS imaging. This was done to determine the level of contamination in the S-Cam GC sample (contamination is defined as non GC objects that meet the colour, size and magnitude conditions set for the S-Cam photometry) as well as to determine the photometric completeness of our S-Cam imaging. This analysis is relative to the HST/ACS sample but the ACS imaging is almost perfectly complete several magnitudes deeper than our Subaru/S-Cam imaging (Jordán et al., 2009).
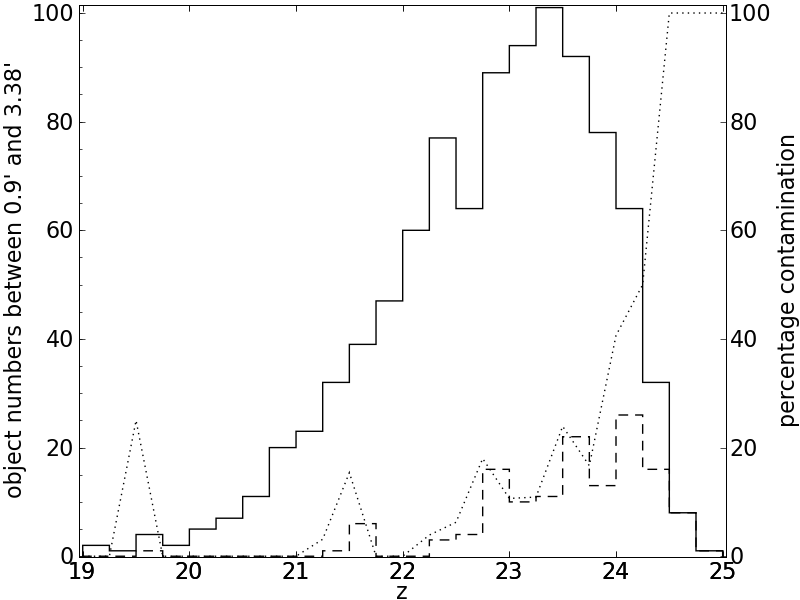
The contamination percentage of the sample in S-Cam was determined by keeping record of the GC candidates detected in the ACS imaging but removed by the conditions outlined in Section 4.1. At a magnitude of , 50 per cent of S-Cam GC candidates are determined to be contamination and at mag essentially all of the S-Cam GC candidates are contaminants. Across the whole GC candidate sample the contamination determined in this way is objects and if the sample is restricted to only objects brighter than mag this value drops to objects . The luminosity function of GCs can be well described by a Gaussian distribution peaked at the turnover magnitude of mag (Jordán et al., 2007), which corresponds to mag at the distance of NGC 4365 and all GC candidates described in further analysis are brighter than this turnover magnitude.
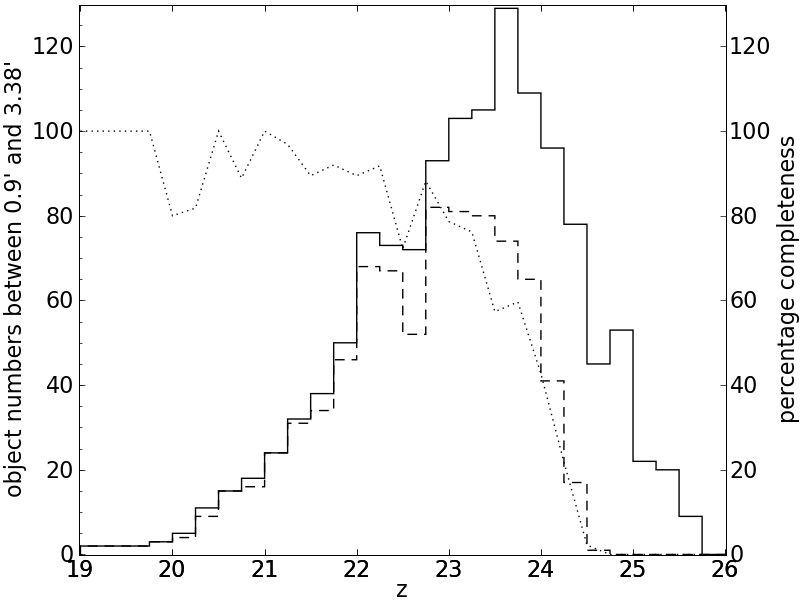
The completeness of the S-Cam imaging was determined by keeping record of how many of the HST/ACS detected objects were also detected by the Subaru/S-Cam imaging at different magnitudes. The S-Cam imaging is found to be 50 per cent complete at mag and 70 per cent complete at mag as shown in Figure 9.
In the very central regions (radii arcmin) of NGC 4365 the HST/ACS detection of GC candidates is inhibited by the high surface brightness of the galaxy. In Jordán et al. (2007) the completeness of objects is tabulated as a function of object size, object magnitude and surface brightness of the galaxy at the location of the GC candidate. For this analysis it is only necessary to consider completeness as a function of radius. We measured the average surface brightness of the galaxy in arcmin annuli on the ACS imaging. We compared that to the completeness fraction for an object of mean size arcsec ( parsec) and mag, which is representative of the GC candidate sample. At distances of and arcmin from the galaxy centre the ACS imaging is 93.3 and 98.9 per cent complete.
4.4 Overview of GC selection
The selection of GC candidates from the Subaru/S-Cam photometry was done based on object size, magnitude and locus in colour-colour space compared to GC candidates obtained from HST/ACS photometry. Point-like objects were selected in each S-Cam filter using a limit on the flux difference between two radii apertures (see Section 4.2.1). The astrometry of the ACS GC catalogue was shifted to that of the S-Cam catalogue. The positions of objects classed as point-like in all S-Cam filters were compared with the positions of GC candidates obtained from the ACS photometry (see Section 4.1 for ACS selection criteria; colours , sizes and magnitudes ). The matched S-Cam point-like objects were used to determine the locus of GCs on a vs. diagram. No contaminating objects could be visually identified on inspection of the GC candidates brighter than mag. Finally, estimates of the contamination and completeness of the S-Cam catalogue were determined by comparison with the ACS catalogue (see Section 4.3). The full catalogue of NGC 4365’s GC candidates, found either ACS or S-Cam imaging, is included as online supplementary material in FullGlobList.dat.
5 Analysis of the galaxy light
5.1 Parameters of the isophotal fits
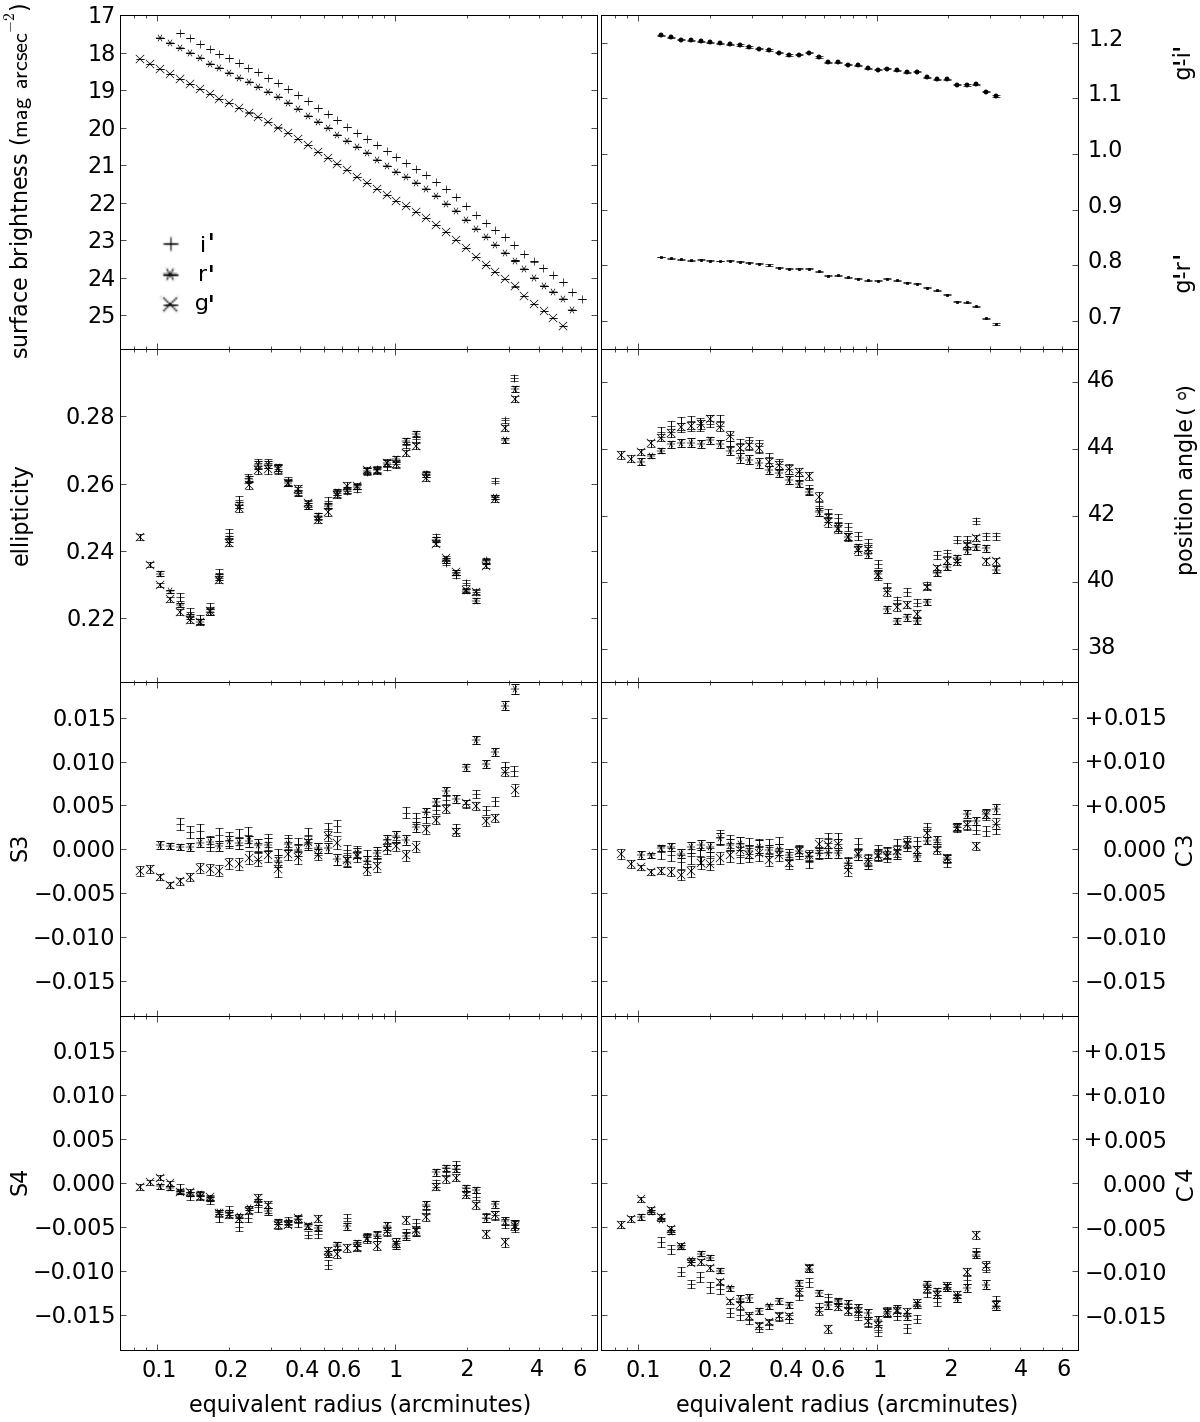
We used the IRAF task ELLIPSE to model and subtract the galaxy light from the Subaru/S-Cam photometry. From the model of the galaxy light we obtain the surface brightness, ellipticity, position angle and higher order Fourier terms (S3, S4, C3, C4) in and filters for NGC 4365. Results are plotted in Figure 10 and briefly discussed here. We have surface brightness information for all three filters between and arcmin. We fit Sérsic profiles (Graham & Driver, 2005), i.e.
| (1) |
to the three surface brightness profiles, where is the effective radius of the galaxy, is the surface brightness at that radius, is the shape parameter of the Sérsic profile and . The fitted values are tabulated in Table 2.
| Filter | |||
|---|---|---|---|
| (mag ) | (arcmin) | ||
| g | |||
| r | |||
| i |
The quoted value for NGC 4365’s effective radius (Goudfrooij et al., 1994; Bender et al., 1992) is arcmin based on a de Vaucouleurs profile (equivalent to a Sérsic profile with the parameter set to 4) fitted by Burstein et al. (1987). When a de Vaucouleurs profile is fit to the data in this work the effective radius is found to be arcmin but we find this to be a significantly poorer fit than a general Sérsic profile. For all further analysis we use our value of arcmin ( kpc), with an value of . This is close to the value of arcmin ( kpc) with in that Chen et al. (2010) found and slightly smaller than the value of arcmin ( kpc) with in that Kormendy et al. (2009) found.
Results for the ellipticity, position angle and higher order Fourier terms in this work agree with the values Goudfrooij et al. (1994) found in the and filters and extend arcmin further, to . The ellipticity measured in this work varies between 0.22 at arcmin and 0.28 at arcmin and is consistent with that seen by Goudfrooij et al. (1994) interior to arcmin. The position angle shows a small twist of beyond the radial range explored by Goudfrooij et al. (1994). The S3 parameter (coefficient to the sine term in the fit) shows an indication of increase at the edge of their radial range ( arcmin) which is confirmed in this work (between and arcmin) and correspondingly the S4 parameter increases between and arcmin. There is no significant difference in C3 and C4 parameters between Goudfrooij et al. (1994) and this work. The C4 disky/boxy parameter remains at values between -0.01 and -0.02 out to arcmin, indicating that NGC 4365 has boxy isophotal structure to large radii. The galaxy colour becomes bluer with increasing galactocentric radius, changing by mag from to arcmin for both and colour indices. A similar trend, implying a negative metallicity gradient, is seen in the Goudfrooij et al. (1994) B–I colour index.
6 Analysis of the GC System
6.1 Characterising the total GC System
6.1.1 Surface Density
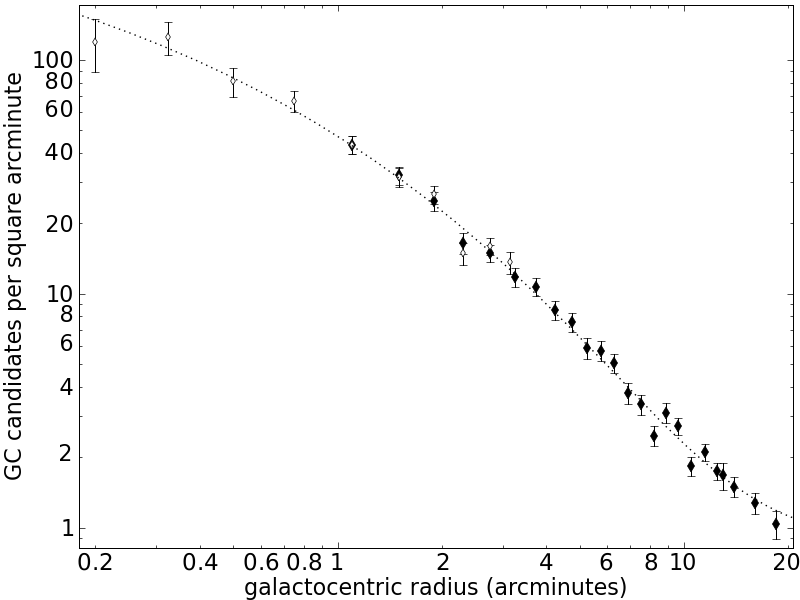
By combining the wide field imaging from S-Cam with the spatially resolved imaging from ACS and further restricting the GC candidate sample to objects brighter than the turnover magnitude we can derive a very accurate radial surface density profile over a factor of 100 in radius. To derive surface density profiles, the number of GC candidates in each radial bin were divided by the total area in that radial bin. The results for both the S-Cam and ACS GC candidate samples are plotted on Figure 11.
We expect very little contamination in the density profile, with more than 90 per cent completeness in this magnitude range (see Section 4.3). A Sérsic profile plus a background parameter, i.e.
| (2) |
where
| (3) |
is fitted to the combined S-Cam and ACS radial surface density of GC candidates and shown in Figure 11. is the effective radius of the GC system, is the density at the effective radius and is the shape parameter of the Sérsic profile. The fitted parameters are recorded in Table 3. The value for contamination expected from the analysis in Section 4.3 () agrees within with the value from the Sérsic profile fit ().
| () | (arcmin) | () | |
We are not able to define the edge of NGC 4365’s GC system with certainty as the profile shown in Figure 11 is still decreasing at arcmin ( kpc), which is the very edge of the spatial coverage available to us with S-Cam imaging. In order to confirm the edge of the GC system even larger field of view imaging would be required. We can make an estimate of the total number of GCs associated with NGC 4365 by simply doubling the number of GC candidates brighter than the turnover magnitude ( and ). This assumes that there is no inherent asymmetry in the GC luminosity function, the GC system of NGC 4365 contains few GCs beyond arcmin and that the sample is complete and free of contamination. We determine the total number of GCs in NGC 4365’s GC system to be . This is likely to be a lower limit and doubles the expected number of GCs in NGC 4365 from the value of calculated by Peng et al. (2008). They use the narrow field of view of one HST/ACS and three HST/WFPC2 pointings to derive an extrapolated GC surface density profile that is not publicly available. We suggest that the surface density profile that Peng et al. (2008) fit to the GC candidates underestimated the radial extent of NGC 4365’s GC system.
These total GC numbers convert to specific frequency (Harris & van den Bergh, 1981) values of (Peng et al., 2008) and determined from this work for . Several other large elliptical galaxies with similar have specific frequency values comparable to the measured here. NGC 1407 has , NGC 1399 has (Spitler et al., 2008) and Peng et al. (2008) find for M84. Fitting a power law to the radial density beyond the Sérsic effective radius we find a slope (i.e. power-law exponent) of to allow comparisons with analysis of other galaxies in the literature.
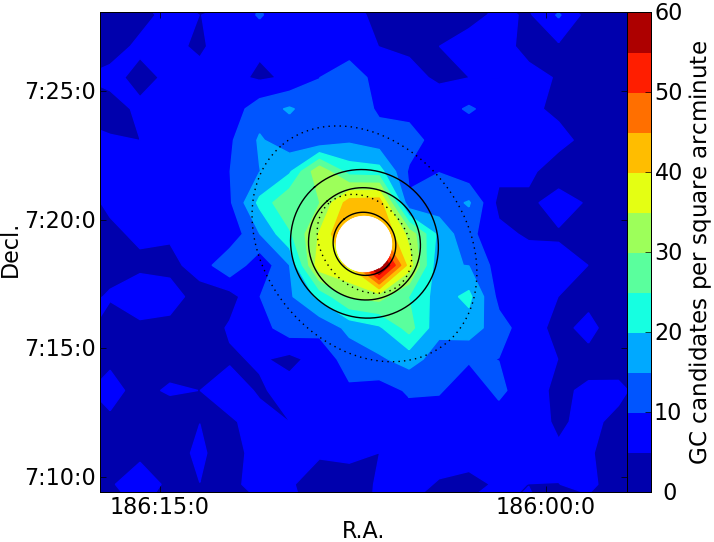
By binning the GC candidate positions into R.A. and Dec. defined squares we derive a two-dimensional density distribution for the GC candidates. This is shown in Figure 12 along with selected galaxy surface brightness isophotes from the filter as determined by the IRAF task ELLIPSE. McLaughlin et al. (1994) use
| (4) |
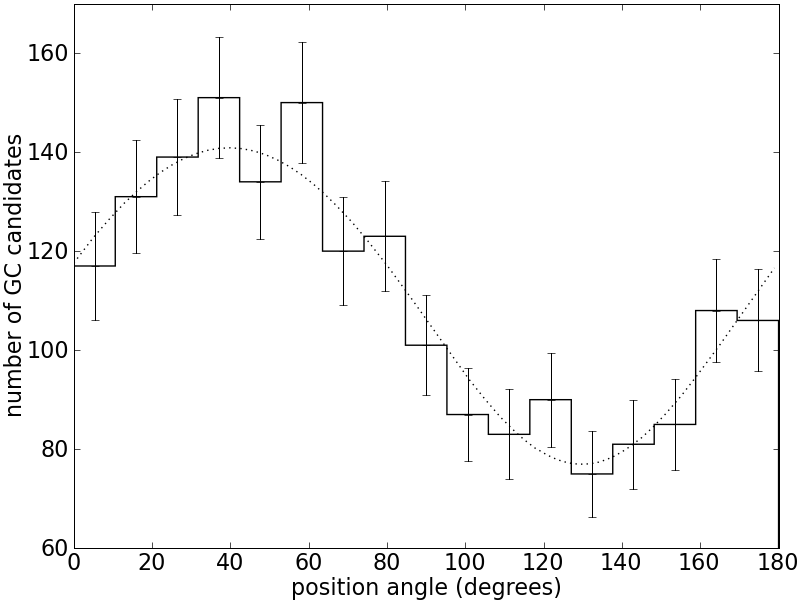
to fit for the position angle () and ellipticity () of the GC system of M87. They fit to the density of GCs as a function of azimuthal distribution and we follow the same procedure. We use the previously determined power law exponent () and the fitted background value (), allowing the normalisation constant (k) as well as the position angle and ellipticity to vary. We find the position angle of the GC system to be and the ellipticity to be , see Figure 13. The GC system of NGC 4365 has a similar position angle to the galaxy light () but is clearly much more elliptical than the starlight of NGC 4365 (which has an ellipticity of ). We see qualitative agreement with this analysis in Figure 12.
6.1.2 Colour Distribution
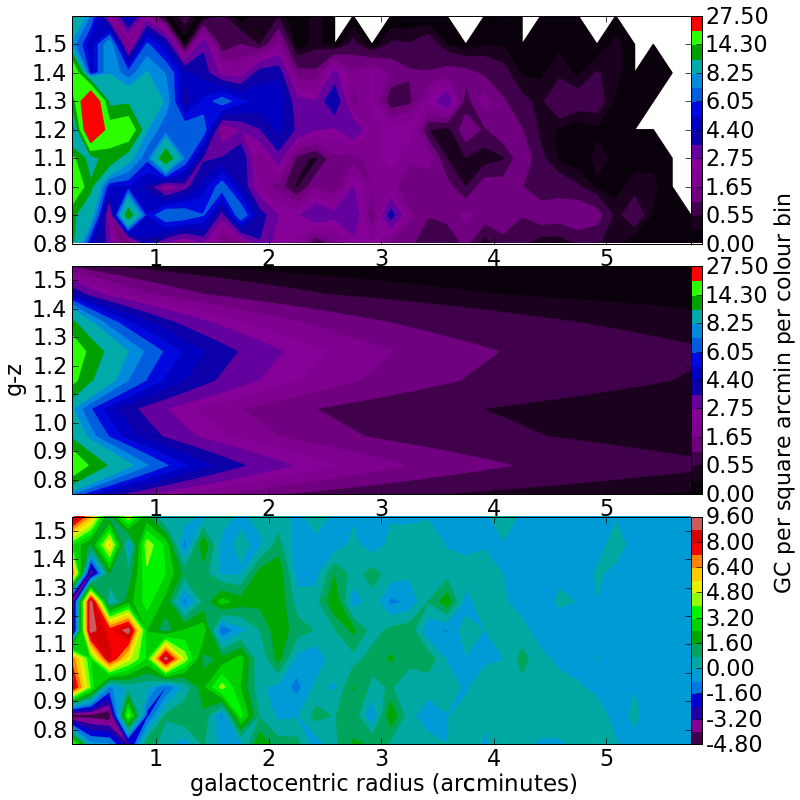
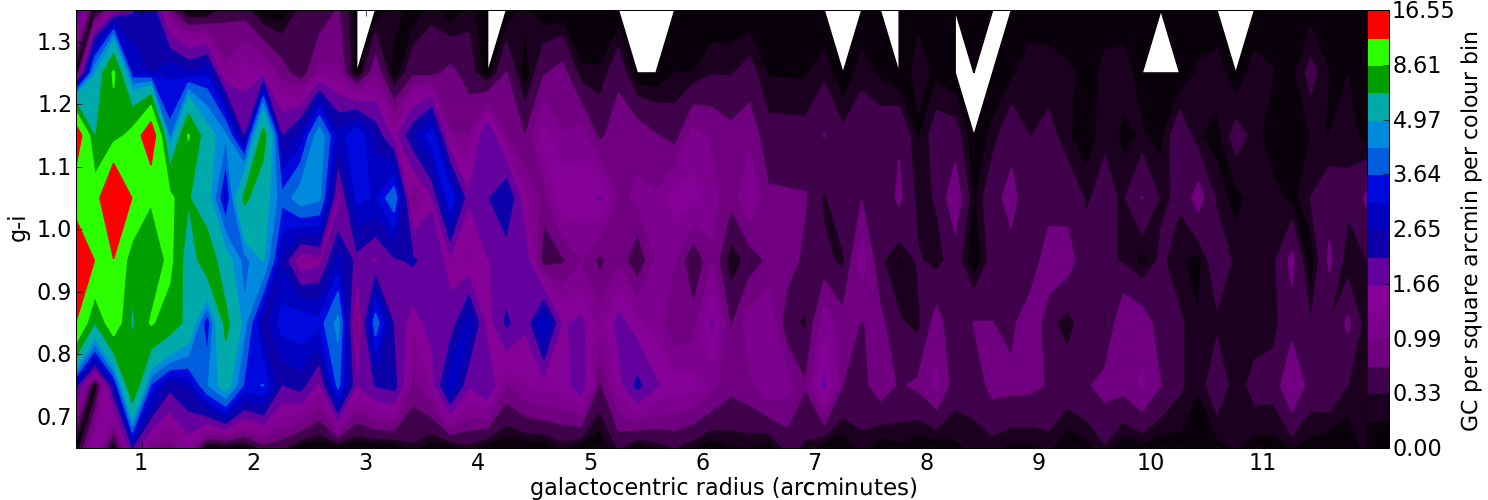
Before performing a quantitative analysis of the surface density characteristics of GC subpopulations in NGC 4365 we can make a qualitative assessment of colour-radius substructure by examining the surface density of GCs in colour-radius space. This is shown in Figures 14 and 15. At galactocentric radii larger than arcmin in the top panel of Figure 14 the blue and red GC subpopulations of NGC 4365 are visible as distinct sequences at and respectively. At radii smaller than arcmin and possibly between and arcmin there is evidence of a third subpopulation of GCs intermediate in colour. Note the clear overdensity of GCs candidates at intermediate to red colours and within arcmin in both Figures 14 and 15. These data confirm a similar observation by Larsen et al. (2005) where evidence of intermediate colour GCs were found at radii smaller than arcmin. We are able to extend the analysis of the GC colour substructure with radius to arcmin with HST/ACS imaging (see Figure 14) and to arcmin with S-Cam imaging (see Figure 15). Beyond arcmin in Figure 15 the colour distribution seems to be dominated by 2 colour modes but there is some indication of GCs at intermediate colours.
Recently, observers have found gradients in the peak colour of the GC subpopulations with galactocentric radius (see Harris, 2009a, b; Liu et al., 2011; Forbes et al., 2011). Both blue and red subpopulations’ peak colour shifts to bluer colours at larger radii. Forbes et al. (2011) find the most extreme gradient to date in the galaxy NGC 1407. If the red subpopulation of NGC 4365 were similar to that of NGC 1407 then the peak colour for the red subpopulation would change from at the galaxy centre to at arcmin, and the red subpopulation would have intermediate colours at large radii. In the bottom panel of Figure 14 and in Figure 15 an overdensity of GC candidates with intermediate colours is visible at very small radii that cannot be accounted for by a gradient in the peak colour of the red subpopulation. We note that if this intermediate colour overdensity at small galactocentric radii is a distinct subpopulation and there is a gradient in the red subpopulation of NGC 4365 then statistical tests for bimodality or trimodality based on colour distribution alone might not be able to distinguish between these two subpopulations conclusively.
6.2 Radial colour gradients
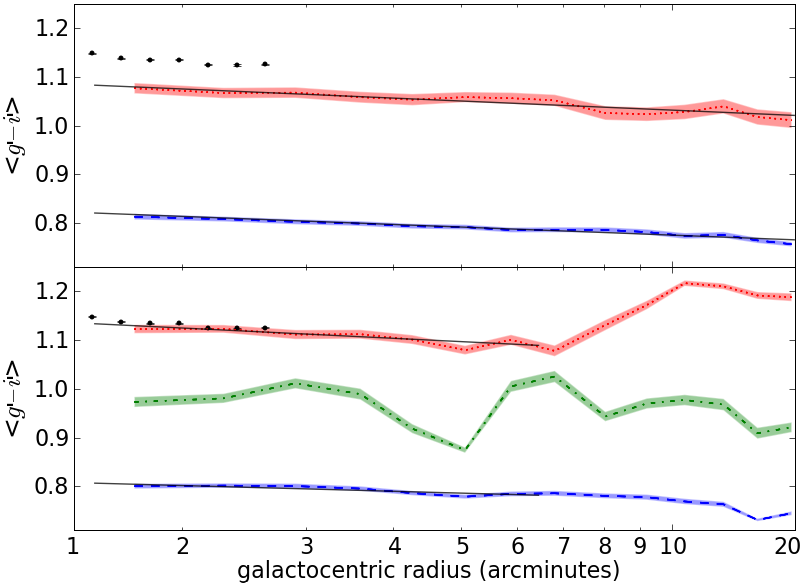
Several groups have recently found shallow but significant gradients in the mean colour of GC subpopulations (see Harris, 2009a, b; Liu et al., 2011; Forbes et al., 2011). The radial extent of the Subaru/S-Cam imaging makes this an excellent data set to determine whether there are gradients present in the GC subpopulations of NGC 4365. The presence of an intermediate colour subpopulation will influence the gradient determined and therefore we consider the case of a bimodal and a trimodal distribution separately. The heteroscedastic KMM algorithm was run on a rolling sample of GC candidates and the peak value determined for both bimodal and trimodal instances for the S-Cam data set. The rolling sample consisted of 360 GC candidates input to KMM at each step and between each step the 120 candidates with lowest galactocentric radius were replaced with the 120 candidates closest to, but at least as far as, the furthest candidate in the previous sample. A linear relation was fitted to the S-Cam peak colours, to arcmin in the bimodal case and arcmin in the trimodal case, i.e.
| (5) |
Results are tabulated in Table 4. The linear blue gradient values are consistent within errors but the linear red gradient is significantly steeper in the trimodal case. The green gradient measured in the trimodal case is consistent with zero.
| Subpopulation | Bimodal Case | Trimodal Case |
|---|---|---|
| (dex per arcmin) | (dex per arcmin) | |
| Blue | ||
| Green | - | |
| Red |
| Subpopulation | Bimodal Case | Trimodal Case |
|---|---|---|
| (dex per dex) | (dex per dex) | |
| Blue | ||
| Green | - | |
| Red |
We also fit a line to the logarithm of the radius normalised by using arcmin, i.e.
| (6) |
Results are tabulated in Table 5. Here both blue and red gradients are consistent within errors for the bimodal and trimodal cases. The green subpopulation does not have a measurable gradient in this case either. Liu et al. (2011) measure colour gradients for NGC 4365 GCs using the central ACS pointing in the bimodal case, finding a blue slope of and a red slope of dex per dex. The radial range of their measurements do not overlap with ours and we see that the radial colour gradient of the blue subpopulation remains constant when moving to larger galactocentric radii while the radial colour gradient of the red subpopulation steepens significantly with increasing galactocentric radius. We use the Lee, Park & Hwang (2010) empirical relationship between GC colour and metallicity to give a metallicity gradient, i.e.
| (7) |
| Subpopulation | Bimodal Case | Trimodal Case |
|---|---|---|
| (dex per dex) | (dex per dex) | |
| Blue | ||
| Red |
The gradient of the mean metallicity with galactocentric radius is shallower in the trimodal case for the blue subpopulation but for the red subpopulation the gradients in the bimodal and trimodal cases are consistent. We note that the rolling peak colour found by KMM is only consistent with the galaxy colour in the trimodal case (see Figure 16).
We conclude that the NGC 4365 GC subpopulations show a shallow but significant colour gradient with galactocentric radius, regardless of whether the GC system is interpreted as being bimodal or trimodal. Forbes et al. (2011) tabulate metallicity-radius gradients in units of dex per dex for several galaxies on which this measurement has been done. The gradients measured for NGC 4365 are steeper than the mean, but not the steepest measured. Results vary from to for the blue subpopulation and from to for the red subpopulation in Forbes et al. (2011) Table 1. These gradients explain why statistical analyses of the colour distribution (collapsed in radius) of NGC 4365’s GC system give inconclusive results.
6.3 Magnitude colour trends
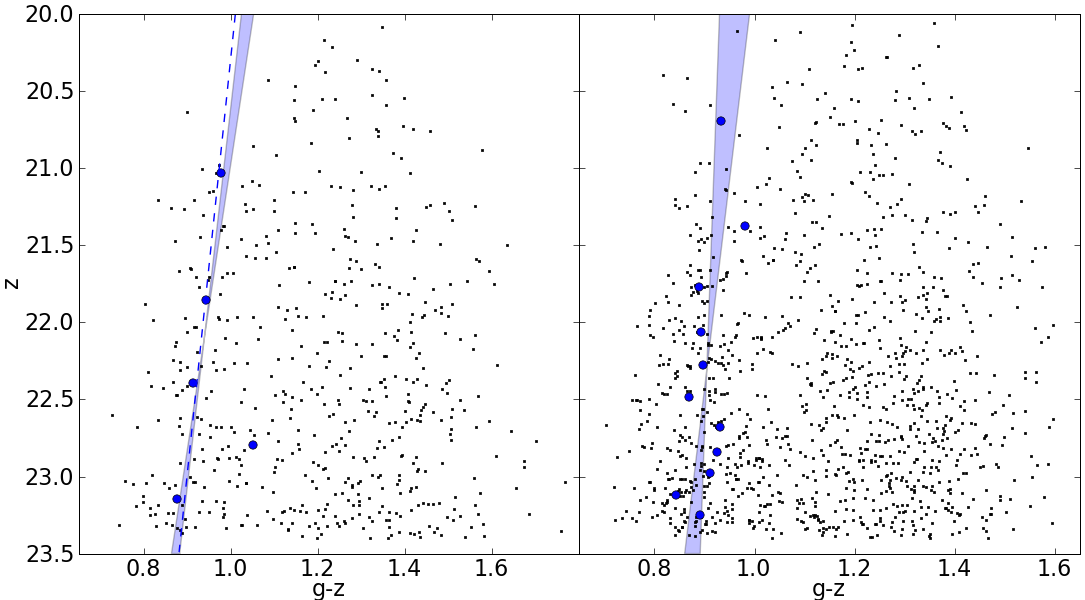
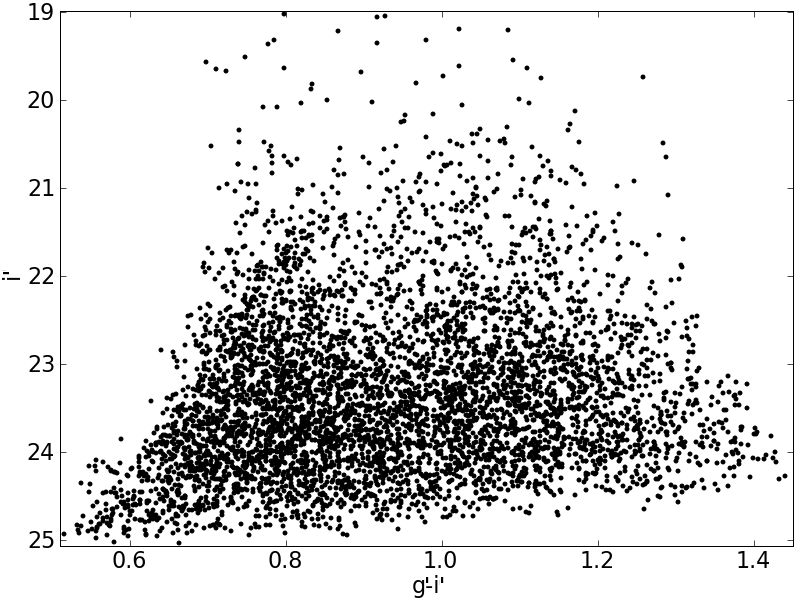
In the determination of the magnitude colour trends we only investigate the blue subpopulation of the GC system, we search for a ‘blue tilt’ (Strader et al., 2006). We do this in order to decide whether the blue tilt could be the cause of the intermediate colour overdensity seen in Figures 4, 14 and 15. The bimodal KMM mean colour values at various magnitudes were determined by dividing the GC sample into magnitude subsets with equal numbers. The mean magnitude of GC candidates in each subset is plotted against the blue heteroscedastic Gaussian mean value found by KMM in Figure 17. We did this analysis for the central HST/ACS pointing as well as for the full set of eight HST/ACS pointings and found that both cases show a significant gradient but that the slope is steeper in the central region () than for all pointings combined (). Mieske et al. (2006) use the central ACS pointing and combine GCs for all galaxies in the range to determine a slope of using the same KMM method. In Figure 17 we see that this lies very close to our fitted line. They also find a steepening slope when GCs closer the the galaxy centre are used.
6.4 Quantifying the GC subpopulations
We compare NGC 4365’s GC colour distribution with that of other Virgo cluster galaxies, using the ACS Virgo Cluster Survey (VCS) photometry (Peng et al., 2006). They fit a homoscedastic bimodal distribution using Kaye’s Mixture Model (KMM) algorithm and obtained mean colour values of 0.98 and 1.36 for the blue and red subpopulations of NGC 4365 respectively, as well as a width of 0.15 for both subpopulations. They also fit linear relations between mean colour and absolute galaxy magnitude, , for both GC subpopulations, assuming all Virgo Cluster galaxies have the same distance. The relations predict mean colour values of and for the blue and red subpopulations when the conventional distance for NGC 4365 (23.1 Mpc) is used. They concluded that aside from having a large number of red GCs, NGC 4365 has an unremarkable colour distribution compared to their sample (Peng et al., 2006).
Fitting a bimodal homoscedastic distribution to NGC 4365’s GCs, with KMM, using all eight available ACS pointings we find similar values to the ones found by ACS VCS (i.e. 0.94 and 1.30 for the blue and red peak colours and a width of 0.12). However, on visual inspection the fit to the GC distribution is skewed to redder colours when compared to the actual colour distribution. We also fit both bimodal and trimodal heteroscedastic distributions to the GC colour distributions, obtaining mean blue and red values of 0.89 and 1.25 in the bimodal case, and 0.88, 1.12 and 1.34 in the trimodal case. In neither case does the mean blue colour lie close to the vs. relation (values are 1.4 and 1.6 away from the relation) but only in the trimodal case does the red mean colour lie close to the Peng et al. (2006) v.s. relation, where the value is 0.7 away from the relation instead of 1.8 away. This is a motivation to describe the GC system of NGC 4365 in terms of three rather than two subpopulations.
From this point forward we assume that the GC system of NGC 4365 contains three subpopulations, a blue, green (intermediate colour) and red subpopulation. There are radial gradients in colour and a blue tilt but in neither case are they enough to explain the strong overdensity seen at intermediate colours in both Figures 14 and 15. In addition, there is better agreement with the colour - galaxy luminosity relations of Peng et al. (2006) to the other Virgo cluster galaxies and a near perfect match between galaxy light and mean red subpopulation colours if we assume that NGC 4365 has three subpopulations.
In the trimodal case, the green GCs would likely ‘contaminate’ the blue and red subpopulations to all except the bluest and reddest colours. A simple split based on colour would leave a high percentage of green GCs in both the blue and red subpopulations and visa versa. Therefore, we formulate a probability that a GC belongs to either a blue, green or red subpopulation based on its colour and galactocentric radius. Note that red (metal rich) GCs are generally found to be more centrally concentrated than blue (metal poor) GCs (Brodie & Strader, 2006) thus GC galactocentric radius is an important factor in the probability calculation. We assume that each of the three subpopulations are fairly well described by a Gaussian in colour (without skewness or kurtosis) and that the peak and width of the Gaussian is independent of galactocentric radius (i.e. no radial colour gradient) but make no further assumptions about the radial distribution of any of the three subpopulations. Given evidence of radial colour gradients we note that this assumption is strictly inaccurate. We make this assumption because colour gradients are shallow compared to the width of the GC colour distributions and the calculation of gradient values contain other significant assumptions about the radial distribution of the subpopulations that we wish to avoid. The following paragraphs describe how we assign a probability that a GC is blue, green or red (henceforth blue-green-red probability).
| ACS (g-z) | S-Cam (g’-i’) | |||
|---|---|---|---|---|
| peak | width | peak | width | |
| Blue | 0.89 | 0.07 | 0.80 | 0.07 |
| Red | 1.32 | 0.12 | 1.13 | 0.10 |
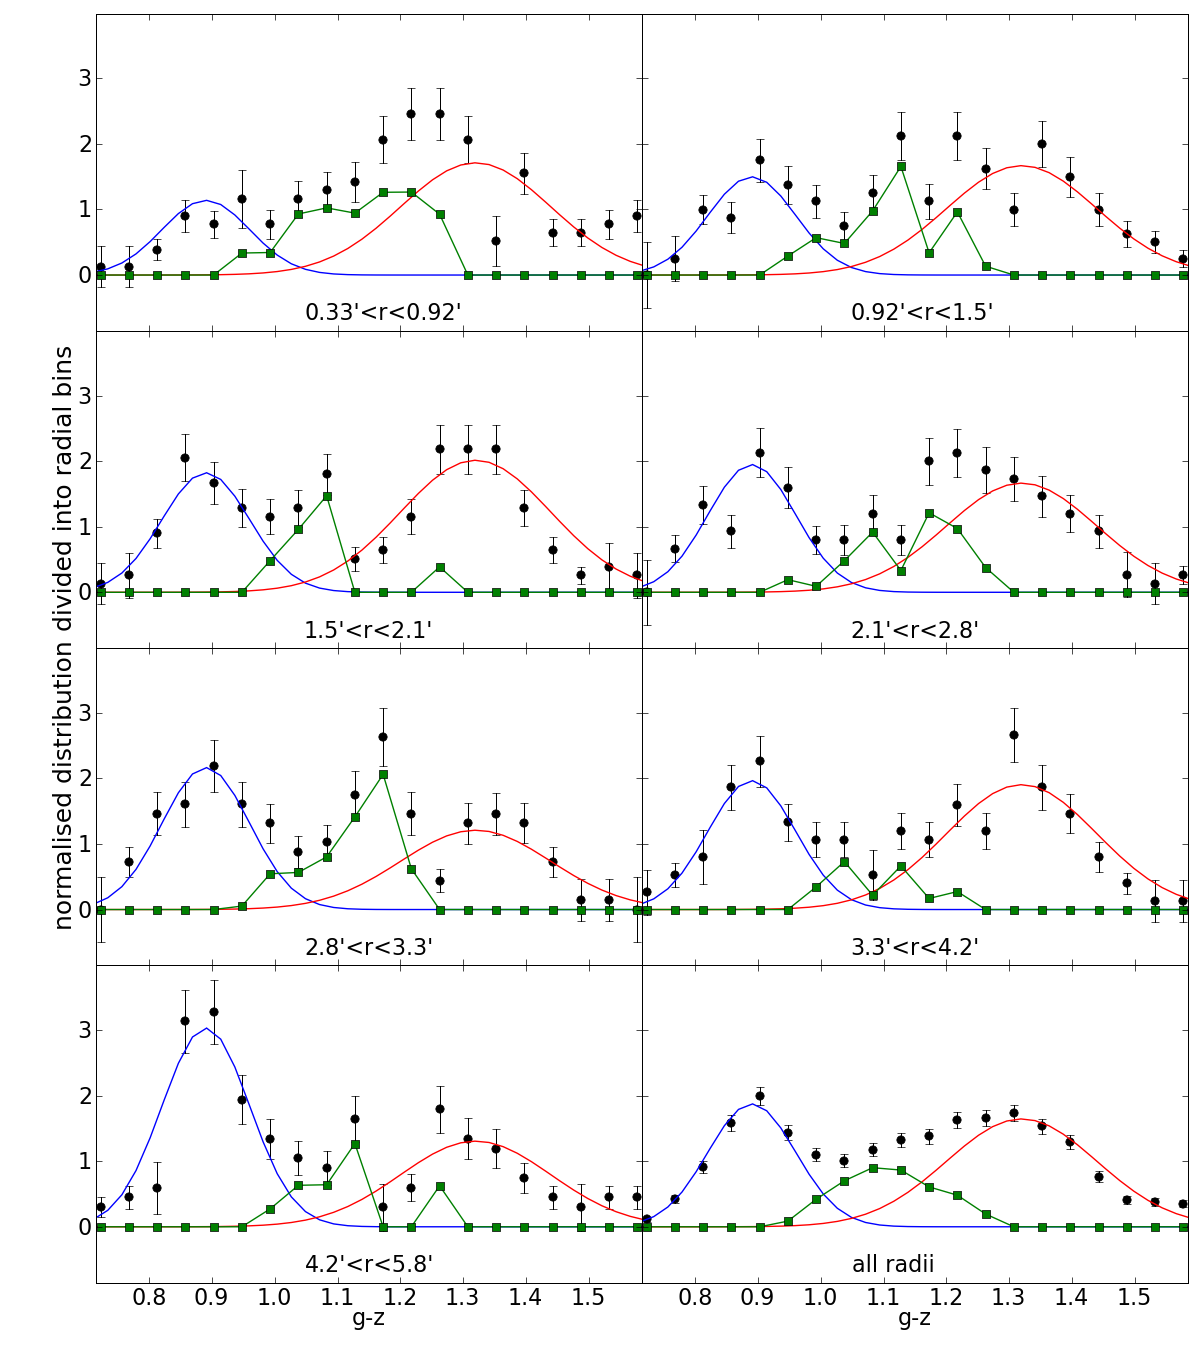
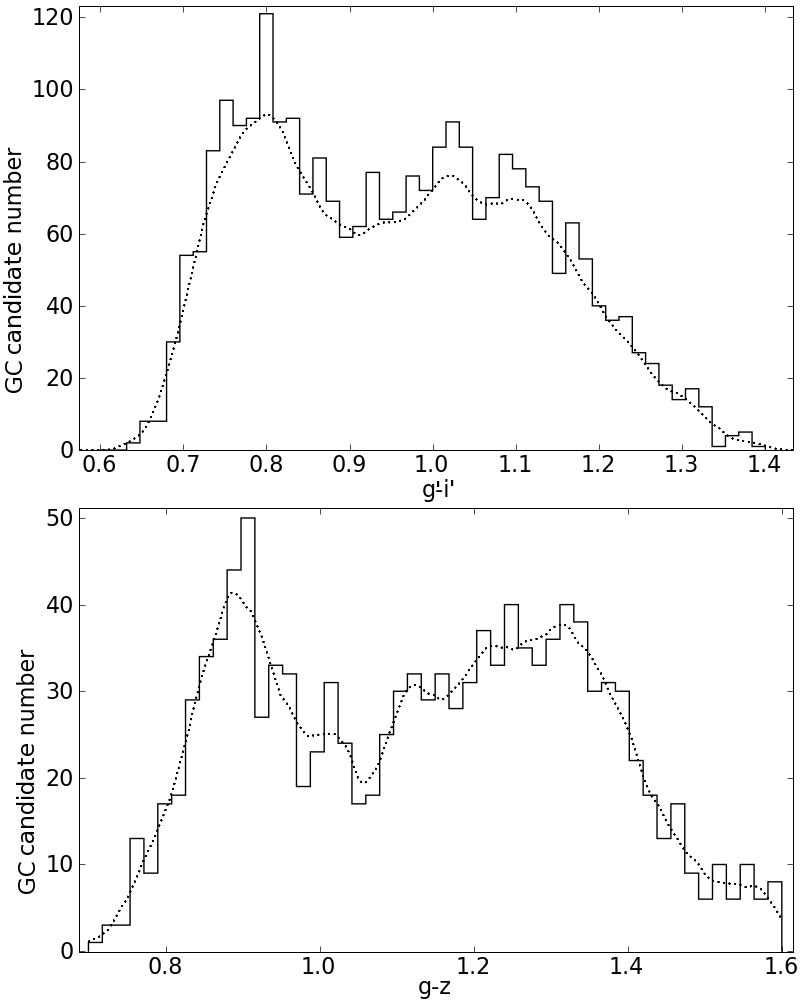
The peak of the blue Gaussian distribution was determined from the bluest peak of an Epanechnikov kernel smoothing of the colour distribution (Silverman, 1986) and the width of the blue Gaussian distribution was determined from the colour at which 68 per cent of the GCs bluewards of the peak were included in the distribution (assuming that green GCs would not be present in significant numbers at such blue colours). See Figure 18 for the S-Cam colour distribution and kernel smoothing. The peak position and width of the red distribution were calculated similarly and all values are shown in Table 7. As seen in the bottom right panels of Figures 19 and 20, where GCs at all radii are included for each sample, the Gaussian distributions for blue and red subpopulations determined in this way are a reasonable fit to the extreme blue and red ends of the GC colour distribution.
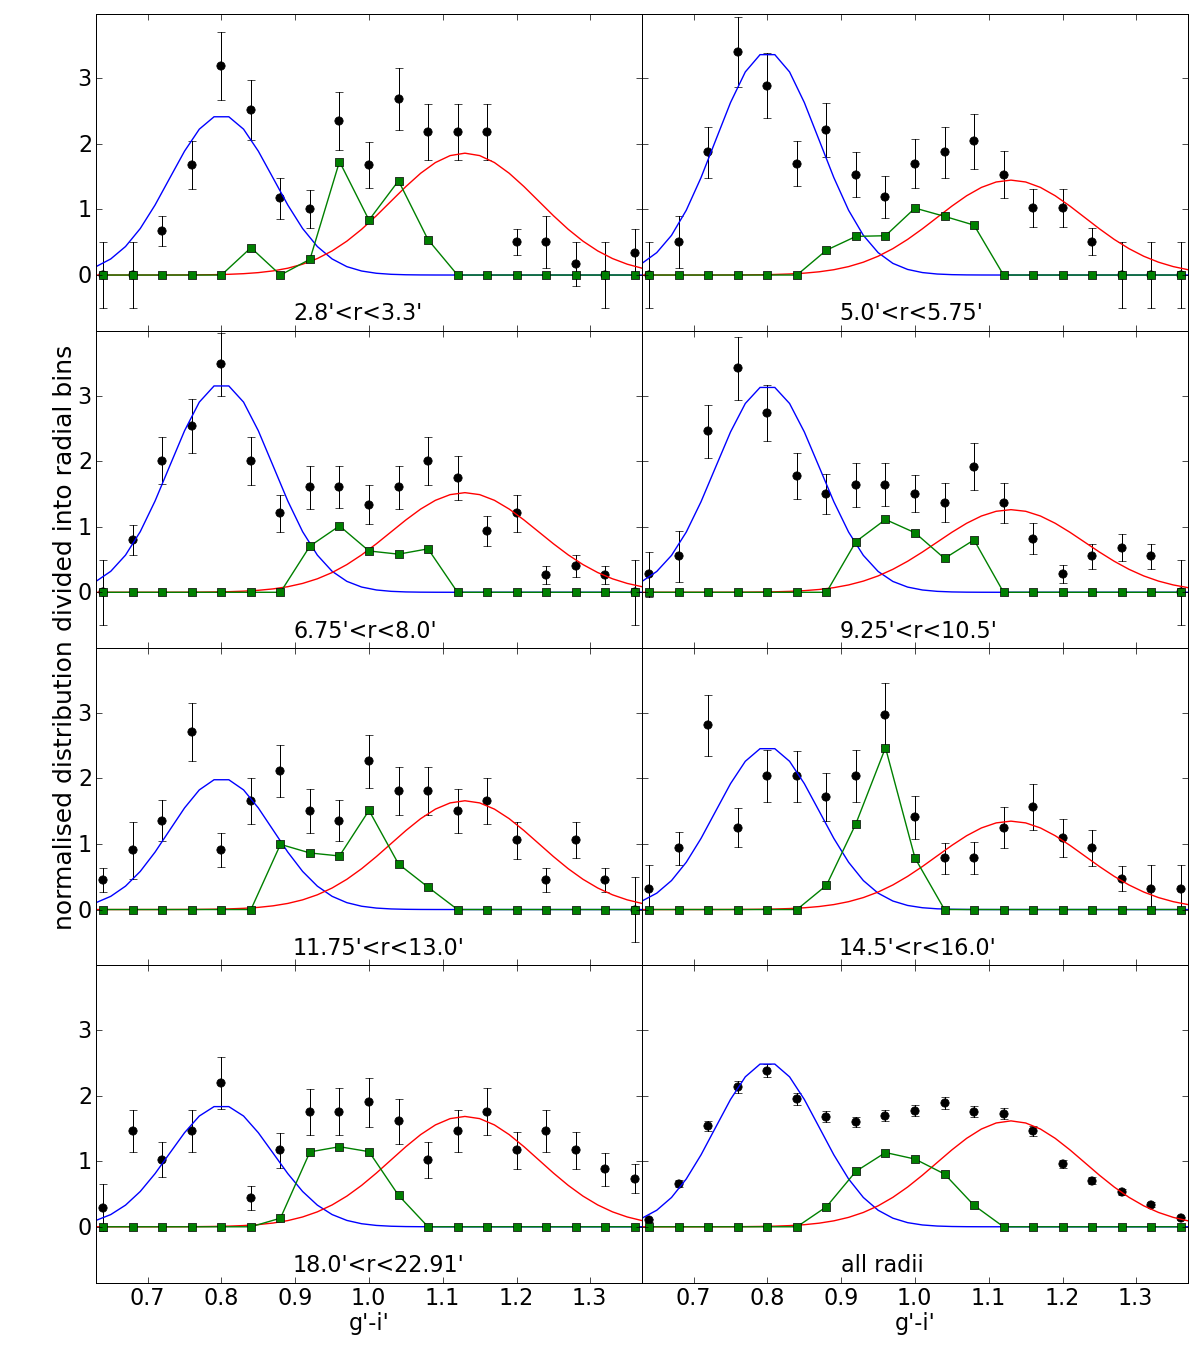
To assess the number of blue, green and red GCs as a function of colour and radius, the GCs in each sample (ACS or S-Cam) were split into radial bins of roughly equal object number and for each radial bin blue and red Gaussian distributions were fitted to the normalised colour histogram. Peak and width values were held constant across radial bins, as determined from the whole sample (see Table 7), and the normalisations of the distributions were fitted separately for each radial bin. This was a minimization fit. The blue and red numbers were calculated by adding the GCs in the extreme colour regions (where no significant green ‘contamination’ is expected) to the percentage of the total objects expected to belong to either the blue or red subpopulations (obtained by integrating the blue and red Gaussian distributions over intermediate colours). The green GC numbers were defined by subtracting both the blue and red subpopulation numbers from the total number in the distribution. These values were used to determine a radial surface density profile for each subpopulation (discussed further in Section 6.5.1), which is used to calculate the probability that a GC at any radius or colour belongs to the blue, green or red subpopulations.
The process used to determine the blue-green-red probability of a GC starts by determining the relative number of GCs in each subpopulation at the galactocentric radius of the GC. This is done by comparing the values of the radial surface density profile for each subpopulation. The relative numbers of GCs in each population are used to scale the normalisations of the three Gaussian distributions and comparing the relative values of all three Gaussian distributions at the colour of the GC we calculate the probability of an object being blue, green, or red.
6.5 Characterising the GC system subpopulations
6.5.1 Surface density
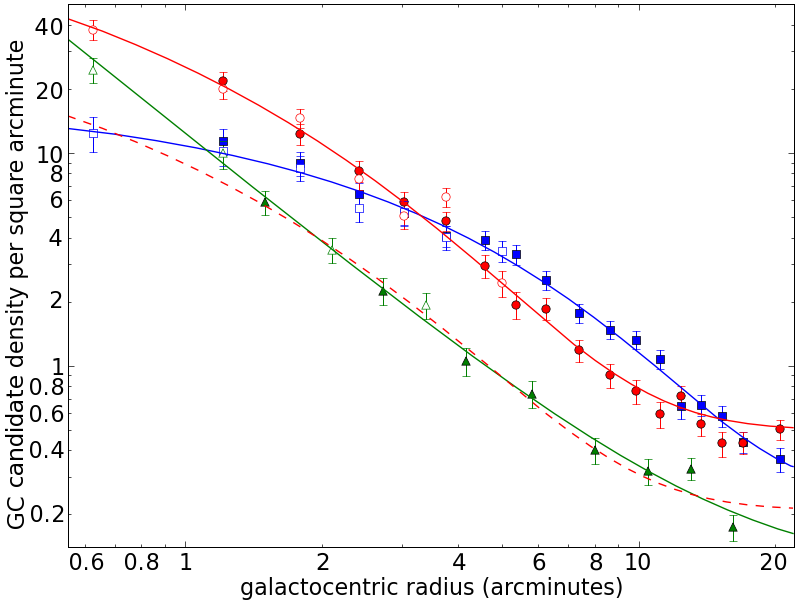
As described in Section 6.4 we counted the blue, green and red GCs in each radial bin assuming that the red and blue GC colour distributions are well fit by Gaussians. In Figure 21 the radial surface density data for all three subpopulations are shown with the best fit surface density model in each case. The red and blue subpopulation distributions are both well fit by a Sérsic profile added to a background term. The values we found are recorded in Table 8. The background terms were estimated from the outermost radial surface density value. The effective radius, or half number radius, of the blue subpopulation ( arcmin) is more than twice as large as the effective radius of the red subpopulation ( arcmin) and the Sérsic n values are consistent within combined errors. The green subpopulation can be fit by the red subpopulation Sérsic profile if the two innermost density points are omitted (points interior to arcmin) and we fit for and the (see Table 8 for the fitted values).
| () | (arcmin) | () | ||
|---|---|---|---|---|
| Blue | ||||
| Green | ||||
| Red |
We also fit a two parameter power law plus a background term
| (8) |
to the entire radial range of the green subpopulation, finding , and . Comparing the slope of a power law fit to the blue () and red () distributions over a radial range from 0.5 to 11 arcmin (4 to 70 kpc) we can quantitatively verify that the green and red GC subpopulations are more centrally concentrated than the blue GC subpopulation and that the slope of the green and red subpopulations are consistent with each other.
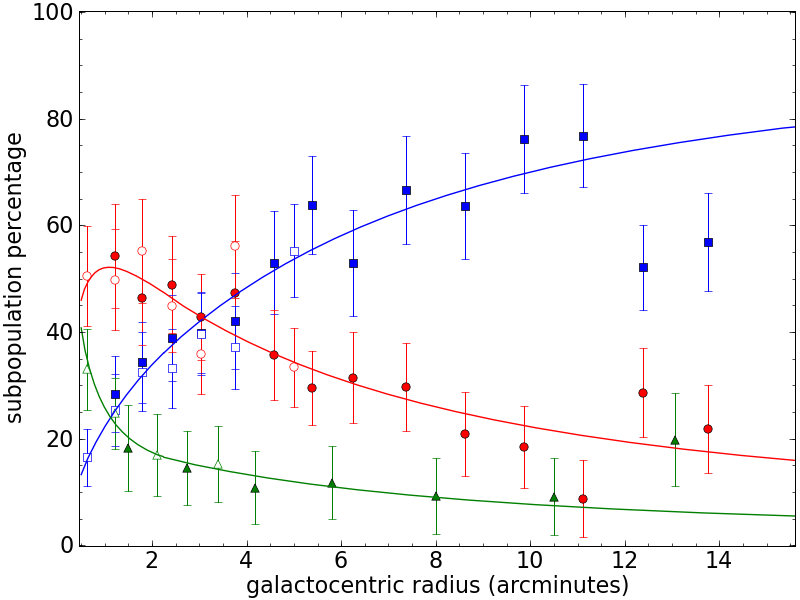
In Figure 22 the percentage of the total GC candidate number that is attributed to each subpopulation is plotted as a function of galactocentric radius. The data points have been background subtracted and the curves derived from the profile fits in Figure 21 are plotted without the addition of background terms. In the case of the green subpopulation the curve shown is a combination of the power law fit in the inner parts ( arcmin) and the Sérsic profile beyond that. We do this to adequately display the behaviour of the intermediate colour surface density both in the inner (power law behaviour) and outer (Sérsic behaviour) parts, noting that we plot lines to guide the eye and not for analysis. In agreement with previous work (see review by Brodie & Strader, 2006) the red subpopulation dominates the GC system in the inner parts and the blue subpopulation dominates in the outer parts. We also see that the green subpopulation only contributes significantly to the GC system at very small galactocentric radii ( arcmin). This is in agreement with the qualitative analysis of the colour-galactocentric radius properties of the GC system earlier in this work (see Section 6.1.2) and with Larsen et al. (2005).
6.5.2 GC half light sizes
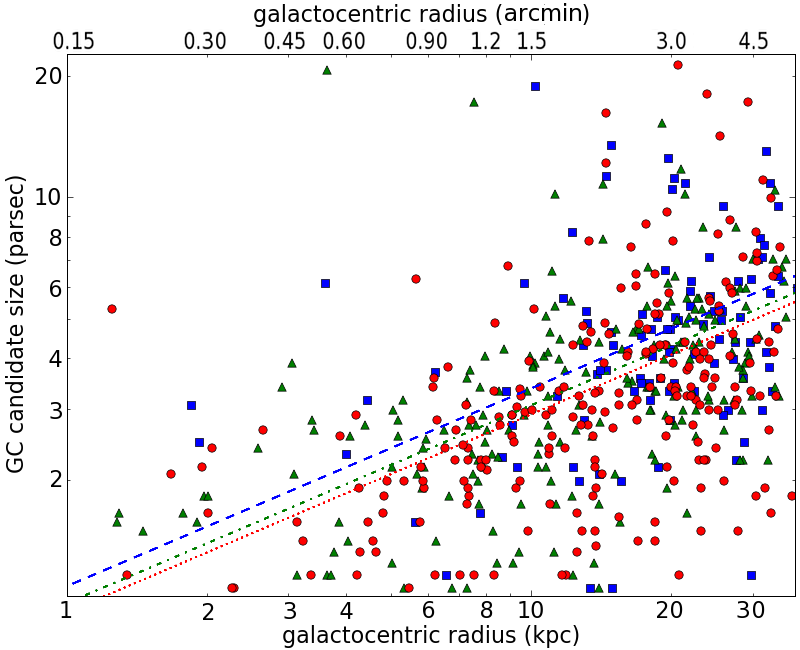
Here we measure subpopulation sizes (median half light radii) as well as trends in candidate size with galactocentric radius from the ACS photometry. As described in Section 6.4 each GC candidate is assigned a probability of belonging to each subpopulation. For example a candidate arcmin from the galaxy centre with has probabilities: per cent, per cent and per cent. Defining the blue and red GCs with a colour probability larger than 95 per cent and green GCs with a probability larger than 80 per cent there are 315, 426 and 491 GC candidates in each of the blue, green and red high probability subsamples. There are no green GC candidates with a probability larger than 95 per cent so we compare medium probability green candidates (80-95 per cent) with high probability blue and red candidates. The aforementioned example is not defined as part of either blue, green or red high probability subsamples.
We determine the median half light radius of the GCs;
These sizes were measured on GCs brighter than (109, 223 and 269 blue, green and red high probability subsample GCs) using ISHAPE (Larsen, 1999) where the method is described in Strader et al. (2006). The median sizes correspond to , and parsec respectively. Blue GCs have a significantly larger median size than either green or red GCs. However, the sizes of the green GCs are only slightly larger than the red GCs. This is possibly due to distinct characteristic sizes for each subpopulation but could also be explained by a continuous trend in GC size with GC colour (e.g. Jordán, 2004).
As well as a possible trend of GC size with colour we also see a trend of GC size with galactocentric radius. In Figure 23 a trend of increasing GC candidate size with increasing galactocentric radius is visible. Fitting a two parameter power law to the GC candidates brighter than we find
All three subpopulations show a clear size increase with distance from the galaxy centre with a power law slope of dex per dex. This measurement extends to , one of only four similar measurements extending beyond . Harris (2009a) measured a slope of on a composite sample of six massive galaxies, Gómez & Woodley (2007) measured a slope of for metal poor GCs and for metal rich GCs in NGC 5128 and Spitler et al. (2006) measured a slope of in NGC 4594. The slope we measure is steeper than any of the previous values and much closer to the value measured for our own Galaxy ( for metal rich GCs, see Gómez & Woodley 2007). We conclude that there is more variability, between galaxies, in the relationship of GC size with galactocentric radius than previously found. Shown in Figure 23 are the GCs in all three high probability subpopulation samples and power law fits. We set the slope of the fits to and found normalisations of , and for the blue, green and red samples respectively. This results agrees with analysis of GC subpopulation median sizes.
6.5.3 Mass function
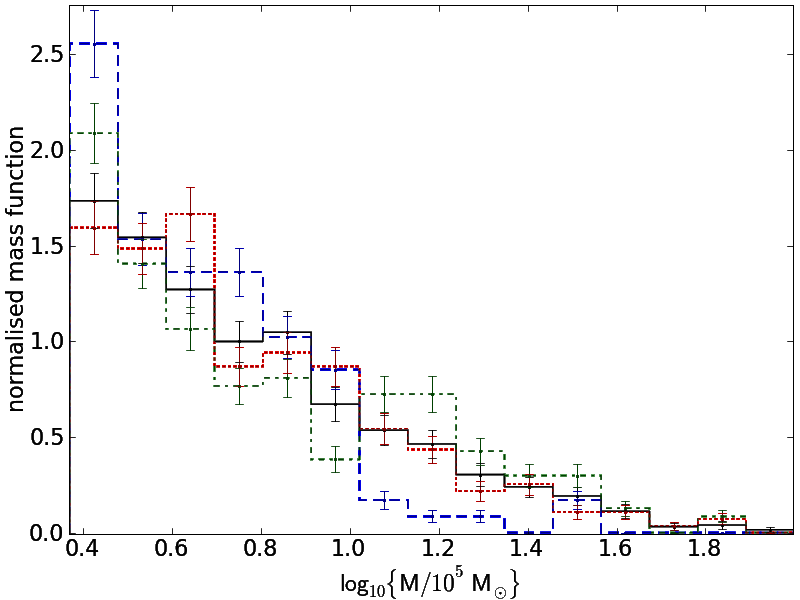
We compare the mass function of the high probability subpopulation GC candidates (as defined in Section 6.5.2). The mass for each GC candidate was derived using the colour dependent values for the filter mass-to-light () ratio in Table 5 of Jordán et al. (2007). They used PEGASE 2.0 with a modified Salpeter initial mass function from Kennicutt (1983) and an age of 13 Gyr for all GCs. We used magnitudes brighter than to calculate the mass functions (plotted in Figure 24). We ran the Kolmogorov-Smirnov (KS) test on each pair with a common mass range of . The KS test gives a probability of 98.3 per cent that the blue and red subpopulations are drawn from different distributions and gives a probability of more than 99.9 (99.4) per cent that the green subpopulation is drawn from a different distribution than the blue (red) subpopulation. The discrepancy between the three subpopulations is greatest around in the cumulative mass distribution the KS test uses for its analysis.
Analysis of the mass function of GC subpopulations indicates that the green subpopulation is distinct from both blue and red subpopulations, containing a significantly larger percentage of objects between and than either blue or red subpopulations, as can be clearly seen in Figure 24. This overdensity of green subpopulation objects can also be seen in Figure 4 around and . It is possible that UCDs or dE nuclei contaminate the bright, mid-colour range (Strader et al., 2006) to produce this feature.
6.5.4 Azimuthal properties
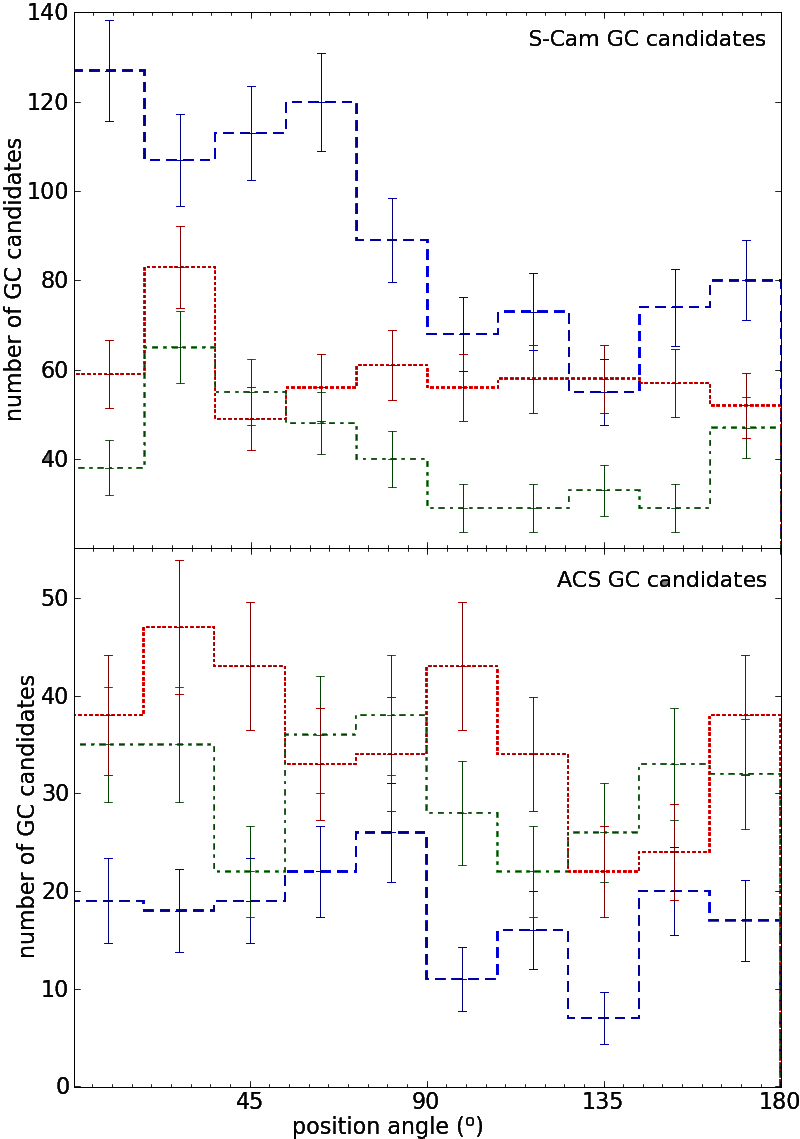
In Figure 25 we show the azimuthal distribution of high probability colour subpopulation GC candidates (as defined in Section 6.5.2) for S-Cam and ACS. We restrict the samples to radii where we have complete azimuthal coverage so as not to bias the samples in any direction. The position angle data is folded at to improve number statistics. The bottom panel of Figure 25 shows that there is no position angle signal within errors for any of the three subpopulations in the ACS sample. The S-Cam azimuthal distribution in the top panel does show some structure; the high probability blue GC candidates are more likely to have position angles between and , which is consistent with the blue GC subpopulation being elongated along the major axis of NGC 4365 (the galaxy has a position angle of , see Section 5). The red distribution shows an almost flat azimuthal distribution (indicating an almost circular GC system) and the green distribution shows a very shallow sinusoidal distribution with a peak between and . It is clear that the blue GC system is very elongated along the position angle of the galaxy and likely that both green and red subpopulations also have a similar position angle to the galaxy starlight. We obtain estimates of the ellipticity of the blue, green and red subpopulations by fixing the position angle (to ) as well as the power law exponent and background value as described in Section 6.1.1, Equation 4 and following the same fitting procedure. We find that the estimated ellipticity for the blue and green subpopulations are the same within errors and also consistent with the ellipticity measured for the whole GC sample in Section 6.1.1. The estimated ellipticity of the red subpopulation is much smaller than the blue and green values. It is consistent with zero and also the ellipticity measured for the galaxy light (see Table 9).
We also split each subpopulation into an inner and outer radial bin with equal numbers in each and refit for ellipticity but did not detect radial variation in ellipticity for any of the three subpopulations.
| Galaxy Light | Blue | Green | Red |
|---|---|---|---|
The agreement in ellipticity between the galaxy light and the red GC subpopulation is consistent with literature findings that red GC subpopulations generally follow the properties of galaxy field stars more closely than blue GC subpopulations. The blue GC subpopulation dominates in the outer regions of the galaxy and also dominates the measurement of the ellipticity of the GC system. It can be seen qualitatively in Figure 12 and quantitatively from the results in Table 9 that the blue subpopulation is significantly more elliptical than the galaxy field stars.
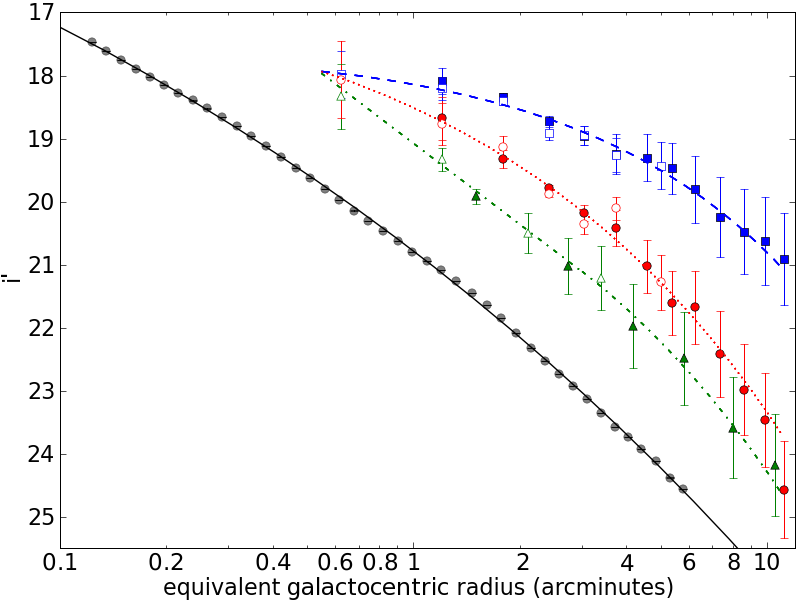
6.6 Comparison with galaxy surface brightness
The galaxy surface brightness profile from the filter photometry is compared with the GC surface density profiles in Figure 26. We compare the galaxy surface brightness profile with times the logarithm of the GC surface density profile and arbitrarily scaled for ease of viewing, i.e.
| (9) |
where is the GC radial surface density profile and is the determined background value. Visually, the shape of the blue GC surface density profile is very different to that of the galaxy surface brightness whereas both red and green GC surface density profiles have shapes similar to the galaxy light. Both red and green density profiles are slightly steeper than the galaxy light profile beyond arcmin.
7 Discussion
In previous work on NGC 4365, evidence of an additional subpopulation of GCs at intermediate (green) colours was based on small numbers and restricted to the central regions (Puzia et al., 2002; Larsen et al., 2003; Hempel & Kissler-Patig, 2004; Brodie et al., 2005; Kundu et al., 2005; Larsen et al., 2005). The large sample of GCs in this work, covering an extended radial range, allows us to revisit these claims in the optical wavelength range.
We applied several independent statistical tests to the colour distribution, i.e. Chi-Squared minimization (), the Kolmogorov-Smirnov (KS) test and Kaye’s Mixture Model (KMM) algorithm. When the entire radial range of our imaging is used our statistical tests cannot conclusively rule out a bimodal interpretation, partly because GC subpopulations do not have strictly Gaussian colour distributions.
When examining GC subpopulation colours with radius we find significant negative colour/metallicity gradients in both the bimodal and trimodal cases. Due to its radial colour gradient, the red subpopulation has somewhat greener colours at large radii. This explains why statistical tests showed inconclusive results when the full radial extent of the imaging was used. However, this cannot explain the central green overdensity that motivates splitting NGC 4365’s GCs into three subpopulations.
We compared the photometrically observable properties of blue, green and red GCs (measured here to contain 43, 17 and 40 per cent of total GCs respectively). The high probability blue, green and red samples have colour ranges of , and where definitions are based on kernel smoothing of the GC colour distribution. We find evidence for different properties between the subpopulations. The green GCs are intermediate in size to the blue and red subpopulations (clearly smaller than the blue GCs and marginally larger than the red ones) and have a significantly different mass function to both blue and red subpopulations. The size differences could be due to a continuous trend with colour rather than specific subpopulation properties (see Jordán, 2004) but the differences in mass functions suggest that the three subpopulations are indeed distinct. Green GCs also have a significantly steeper surface density profile than red GCs within arcmin ( kpc) from the galaxy centre. However, the green and red subpopulations can be described by the same radial surface density profile, with different normalisations, beyond arcmin ( kpc). The ellipticity of the green GC subpopulation is similar to the blue GC subpopulation and significantly more elongated than that of the red. We do not detect any variation in ellipticity of the subpopulations with galactocentric radius to 11 arcmin (74 kpc). These results lend support to the idea that blue, green and red GCs form three distinct subpopulations.
With the same three subpopulation division we find a number of similarities between the properties of the red subpopulation and the galaxy light of NGC 4365. The radial colour gradient of the galaxy light and mean colour of the red GC subpopulation are virtually identical (see also Spitler, 2010; Forbes &
Forte, 2001). The ellipticity of the red subpopulation is consistent with that of the galaxy starlight and the surface density profile of the red subpopulation is closer to the starlight surface brightness profile than either blue or green subpopulations. These results confirm similar findings in the literature (Brodie &
Strader, 2006) and support GC formation scenarios in which the red subpopulation is closely linked to the formation of the bulk of the galaxy field stars.
To understand the physical implications of optical colour trimodality we consider the relationship between optical colours, metallicities and ages. There is considerable debate about whether the colour distribution of GC systems is a good proxy for the metallicity distribution, even if uniform old ages for GCs are assumed (see discussions on the non-linearity of colour-metallicity transformations by Yoon et al., 2006; Cantiello & Blakeslee, 2007; Hempel et al., 2007). It is also possible that one or more of the GC subpopulations have significantly younger ages caused by a merger (see Hibbard & Mihos, 1995; Schweizer & Seitzer, 1998; Montuori et al., 2010) though there is little spectroscopic evidence of young ages for NGC 4365 GCs (Brodie et al., 2005).
The green subpopulation might be a consequence of a unique evolutionary history of NGC 4365. The kinematically distinct core (KDC) in the stellar light might be a signal of this. This property is only found in galaxies the SAURON team (de Zeeuw et al., 2002) classify as slow rotators in the inner regions (Emsellem et al., 2007). The KDC is confined within arcsec ( kpc) of the galaxy centre and the stellar population inside and outside the KDC are indistinguishable in age and metallicity. Inside arcsec the stars rotate around the minor axis and outside arcsec they rotate around the major axis (Davies et al., 2001). Davies et al. (2001) suggest that the KDC might have been formed in the merger of “gas-rich fragments at high redshift” and state that they find no evidence of recent star formation in NGC 4365. The effective radius of the galaxy ( arcmin or kpc) and the radial extent of the green subpopulation ( arcmin) are much larger than the KDC. It is possible that the formation of the green GC subpopulation is linked to the formation of the KDC but since they are not spatially correlated, and other elliptical galaxies with KDCs show no clear indication of a green subpopulation, the connection is not clear.
The core must have been formed very early on because Davies et al. (2001) find the same Gyr luminosity-weighted age for the KDC and the rest of NGC 4365, with no sharp changes in metallicity across the boundary of the KDC. If the formation of the green subpopulation is linked then we would expect the green subpopulation to also be very old. Brodie et al. (2005) found evidence that the green subpopulation was indeed old but this analysis was based on a small number of GCs. We might also expect to find rotation for the green subpopulation to be offset by compared to the other GC subpopulations and the bulk of the starlight, if it is associated with the formation of the KDC.
Another possible signature of the unique evolutionary history could be the significant misalignment between the galaxy’s kinematic and photometric major axes. While KDCs are relatively common in elliptical galaxies, the minor axis rotation of the bulk of NGC 4365’s starlight is relatively uncommon. Van den Bosch et al. (2008) use triaxial orbit based models to explain NGC 4365’s apparent minor axis rotation and KDC. The combination of axisymmetry in the inner parts with triaxiality in the outer parts that van den Bosch et al. (2008) describe is consistent with the age and metallicity of the KDC but bears no obvious relation to the formation of a green GC subpopulation in NGC 4365. Alternatively, Hoffman et al. (2010) show that a Gyr old major merger remnant with per cent progenitor gas fraction has a kinematic signature remarkably similar to NGC 4365. The gas rich major merger that Hoffman et al. (2010) describe is a tempting explanation for the presence of green GCs because all NGC 4365’s anomalies would have one explanation. Given that the green GC subpopulation is likely old (Brodie
et al., 2005) and there is no evidence for young stars in the KDC (Davies et al., 2001) this would have to be a very early major merger.
The current galaxy and GC system formation scenarios that describe mechanisms for producing bimodality in GC systems could also explain GC system trimodality for a subset of galaxies under certain conditions.
In the multiphase collapse scenario GC systems are formed during two phases, the first phase produces metal poor GCs, is truncated by one of a variety of possible mechanisms and then later the second phase produces the metal rich GCs (Forbes et al., 1997). In this context a GC system that is trimodal in metallicity could simply be the result of three formation phases truncated twice (by the same or two different mechanisms). The truncation of the metal poor formation phase could be caused by a universal epoch of reionization but, for truncation to happen twice, at least one truncation mechanism has to be related to nearby galaxies or a process internal to the galaxy, like an active galactic nucleus.
The major merger formation scenario (Zepf & Ashman, 1993), where metal poor GCs are present in galaxies before mergers and metal rich GCs are formed during major mergers, could be consistent with some galaxies containing three GC subpopulations. If a galaxy underwent a very early gaseous major merger and later another major merger it may have two subpopulations more metal rich than the metal poor GC subpopulation. Depending on the age and metallicity difference it could appear trimodal in colour.
The accretion model for GC system formation (Côté et al., 1998) found more than two modes in some of their simulated GC systems before a third GC subpopulation was considered for NGC 4365 from observations. Côté et al. (1998) mention that more than two peaks are present in some of their simulations when a very steep luminosity function (Schechter function ) is used. They find that the peak of the metal poor population correlates with the slope of the luminosity function and that for very steep slopes the metal poor peak is more metal poor. It is conceivable that the merger histories of some giant elliptical galaxies will therefore show the presence of a third, old, intermediate metallicity subpopulation.
The questions that remain include distinguishing which of these formation scenarios best explain the GC system of NGC 4365 and determining whether the trimodality in the colour distribution of the GC system is reflected in the metallicity distribution. The method in Foster et al. (2010) for determining metallicity from the Calcium triplet indices could provide a large sample of metallicity measurements over a wide field of view to assess whether the metallicities of the three colour subpopulations we define here are distinct. The spectroscopic analysis of a large number of GCs could also be used to build a picture of the kinematics of the GC system of NGC 4365 and its subpopulations. An understanding of NGC 4365’s GC system kinematics could distinguish whether two or three subpopulations were all formed in situ, whether the more metal rich populations were accreted or whether the subpopulations are the result of several major mergers.
8 Summary and Conclusions
Combining the photometric depth, size information and resolution of HST/ACS data with the spatial extent and three filter imaging of the Subaru/S-Cam data we can achieve a uniquely detailed, and unmatched spatially extensive, analysis of NGC 4365’s GC system. The GC system extends beyond 134 kpc from the galaxy centre to . The blue GC subpopulation has not yet reached the background level at the very edges of our Subaru/S-Cam imaging. We place a lower limit on the total number of GCs to be .
We find further evidence to support the existence of a distinct third subpopulation at intermediate colours in the GC system of NGC 4365. We also find a trend of increasing GC size with galactocentric radius and negative gradients in the colour/metallicity of both blue and red subpopulations with galactocentric radius. The blue subpopulation shows evidence for a blue tilt. Comparing the GC system with the galaxy light we find that the red subpopulation has a similar colour, radial colour gradient, ellipticity and radial surface density slope to the galaxy light.
Based on various measured properties we find it most likely that the green subpopulation is distinct from the blue and red subpopulations. Consequently, it is very likely that NGC 4365 has had a unique evolutionary history causing the existence of a third GC subpopulation in this giant elliptical, where most similar galaxies only have two. The photometric properties of the blue and red GC subpopulations are consistent with the properties found for those of other giant elliptical GC systems, therefore any formation scenario for the green subpopulation must leave the predicted properties of the other two subpopulations relatively unchanged.
Future analysis of spectroscopy already obtained for this system will help determine the origin of the green subpopulation of NGC 4365’s GC system.
9 Acknowledgements
We thank the reviewer, A. Graham, C. Foster, M. Owers, A. Romanowsky and A. Chies-Santos for insightful discussions. We also thank M. Smith, V. Pota, C. Usher and S. Kartha for support during the preparation of this manuscript. Based in part on data collected at Subaru Telescope, which is operated by the National Astronomical Observatory of Japan. Based in part on observations made with the NASA/ESA Hubble Space Telescope, and obtained from the Hubble Legacy Archive, which is a collaboration between the Space Telescope Science Institute (STScI/NASA), the Space Telescope European Coordinating Facility (ST-ECF/ESA) and the Canadian Astronomy Data Centre (CADC/NRC/CSA).
References
- Alves-Brito et al. (2011) Alves-Brito A., Hau G. K. T., Forbes D. A., Spitler L. R., Strader J., Brodie J. P., Rhode K. L., 2011, ArXiv e-prints
- Arnold et al. (2011) Arnold J. A., Romanowsky A. J., Brodie J. P., Chomiuk L., Spitler L. R., Strader J., Benson A. J., Forbes D. A., 2011, ApJ, 736, L26+
- Ashman et al. (1994) Ashman K. M., Bird C. M., Zepf S. E., 1994, AJ, 108, 2348
- Ashman & Zepf (1992) Ashman K. M., Zepf S. E., 1992, ApJ, 384, 50
- Beasley et al. (2002) Beasley M. A., Baugh C. M., Forbes D. A., Sharples R. M., Frenk C. S., 2002, MNRAS, 333, 383
- Bekki et al. (2008) Bekki K., Yahagi H., Nagashima M., Forbes D. A., 2008, MNRAS, 387, 1131
- Bender et al. (1992) Bender R., Burstein D., Faber S. M., 1992, ApJ, 399, 462
- Blakeslee et al. (2010) Blakeslee J. P., Cantiello M., Peng E. W., 2010, ApJ, 710, 51
- Blakeslee et al. (2009) Blakeslee J. P., Jordán A., Mei S., Côté P., Ferrarese L., Infante L., Peng E. W., Tonry J. L., West M. J., 2009, ApJ, 694, 556
- Brodie & Strader (2006) Brodie J. P., Strader J., 2006, ARA&A, 44, 193
- Brodie et al. (2005) Brodie J. P., Strader J., Denicoló G., Beasley M. A., Cenarro A. J., Larsen S. S., Kuntschner H., Forbes D. A., 2005, AJ, 129, 2643
- Burstein et al. (1987) Burstein D., Davies R. L., Dressler A., Faber S. M., Stone R. P. S., Lynden-Bell D., Terlevich R. J., Wegner G., 1987, ApJS, 64, 601
- Cantiello & Blakeslee (2007) Cantiello M., Blakeslee J. P., 2007, ApJ, 669, 982
- Chen et al. (2010) Chen C., Côté P., West A. A., Peng E. W., Ferrarese L., 2010, ApJS, 191, 1
- Chies-Santos et al. (2011) Chies-Santos A. L., Larsen S. S., Kuntschner H., Anders P., Wehner E. M., Strader J., Brodie J. P., Santos J. F. C., 2011, A&A, 525, A20+
- Côté et al. (1998) Côté P., Marzke R. O., West M. J., 1998, ApJ, 501, 554
- Davies et al. (2001) Davies R. L., Kuntschner H., Emsellem E., Bacon R., Bureau M., Carollo C. M., Copin Y., Miller B. W., Monnet G., Peletier R. F., Verolme E. K., de Zeeuw P. T., 2001, ApJ, 548, L33
- de Zeeuw et al. (2002) de Zeeuw P. T., Bureau M., Emsellem E., Bacon R., Carollo C. M., Copin Y., Davies R. L., Kuntschner H., Miller B. W., Monnet G., Peletier R. F., Verolme E. K., 2002, MNRAS, 329, 513
- Emsellem et al. (2007) Emsellem E., Cappellari M., Krajnović D., van de Ven G., Bacon R., Bureau M., Davies R. L., de Zeeuw P. T., Falcón-Barroso J., Kuntschner H., McDermid R., Peletier R. F., Sarzi M., 2007, MNRAS, 379, 401
- Ferrarese et al. (2006) Ferrarese L., Côté P., Jordán A., Peng E. W., Blakeslee J. P., Piatek S., Mei S., Merritt D., Milosavljević M., Tonry J. L., West M. J., 2006, ApJS, 164, 334
- Forbes et al. (2011) Forbes D., Spitler L., Strader J., Romanowsky A., Brodie J., Foster C., 2011, ArXiv e-prints
- Forbes (1996) Forbes D. A., 1996, AJ, 112, 954
- Forbes et al. (1997) Forbes D. A., Brodie J. P., Grillmair C. J., 1997, AJ, 113, 1652
- Forbes & Forte (2001) Forbes D. A., Forte J. C., 2001, MNRAS, 322, 257
- Forbes et al. (1996) Forbes D. A., Franx M., Illingworth G. D., Carollo C. M., 1996, ApJ, 467, 126
- Foster et al. (2010) Foster C., Forbes D. A., Proctor R. N., Strader J., Brodie J. P., Spitler L. R., 2010, AJ, 139, 1566
- Foster et al. (2011) Foster C., Spitler L. R., Romanowsky A. J., Forbes D. A., Pota V., Bekki K., Strader J., Proctor R. N., Arnold J. A., Brodie J. P., 2011, MNRAS, pp 906–+
- Gómez & Woodley (2007) Gómez M., Woodley K. A., 2007, ApJ, 670, L105
- Goudfrooij et al. (1994) Goudfrooij P., Hansen L., Jorgensen H. E., Norgaard-Nielsen H. U., de Jong T., van den Hoek L. B., 1994, A&AS, 104, 179
- Graham & Driver (2005) Graham A. W., Driver S. P., 2005, PASA, 22, 118
- Harris (2009a) Harris W. E., 2009a, ApJ, 699, 254
- Harris (2009b) Harris W. E., 2009b, ApJ, 703, 939
- Harris & van den Bergh (1981) Harris W. E., van den Bergh S., 1981, AJ, 86, 1627
- Hempel & Kissler-Patig (2004) Hempel M., Kissler-Patig M., 2004, A&A, 428, 459
- Hempel et al. (2007) Hempel M., Kissler-Patig M., Puzia T. H., Hilker M., 2007, A&A, 463, 493
- Hibbard & Mihos (1995) Hibbard J. E., Mihos J. C., 1995, AJ, 110, 140
- Hoffman et al. (2010) Hoffman L., Cox T. J., Dutta S., Hernquist L., 2010, ApJ, 723, 818
- Jordán (2004) Jordán A., 2004, ApJ, 613, L117
- Jordán et al. (2007) Jordán A., McLaughlin D. E., Côté P., Ferrarese L., Peng E. W., Mei S., Villegas D., Merritt D., Tonry J. L., West M. J., 2007, ApJS, 171, 101
- Jordán et al. (2009) Jordán A., Peng E. W., Blakeslee J. P., Côté P., Eyheramendy S., Ferrarese L., Mei S., Tonry J. L., West M. J., 2009, ApJS, 180, 54
- Kennicutt (1983) Kennicutt Jr. R. C., 1983, ApJ, 272, 54
- Kormendy et al. (2009) Kormendy J., Fisher D. B., Cornell M. E., Bender R., 2009, ApJS, 182, 216
- Kundu & Whitmore (2001) Kundu A., Whitmore B. C., 2001, AJ, 121, 2950
- Kundu et al. (2005) Kundu A., Zepf S. E., Hempel M., Morton D., Ashman K. M., Maccarone T. J., Kissler-Patig M., Puzia T. H., Vesperini E., 2005, ApJ, 634, L41
- Larsen (1999) Larsen S. S., 1999, A&AS, 139, 393
- Larsen et al. (2003) Larsen S. S., Brodie J. P., Beasley M. A., Forbes D. A., Kissler-Patig M., Kuntschner H., Puzia T. H., 2003, ApJ, 585, 767
- Larsen et al. (2001) Larsen S. S., Brodie J. P., Huchra J. P., Forbes D. A., Grillmair C. J., 2001, AJ, 121, 2974
- Larsen et al. (2005) Larsen S. S., Brodie J. P., Strader J., 2005, A&A, 443, 413
- Lee et al. (2010) Lee M. G., Park H. S., Hwang H. S., 2010, Science, 328, 334
- Lee et al. (2010) Lee M. G., Park H. S., Hwang H. S., Arimoto N., Tamura N., Onodera M., 2010, ApJ, 709, 1083
- Liu et al. (2011) Liu C., Peng E. W., Jordán A., Ferrarese L., Blakeslee J. P., Côté P., Mei S., 2011, ApJ, 728, 116
- McLaughlin et al. (1994) McLaughlin D. E., Harris W. E., Hanes D. A., 1994, ApJ, 422, 486
- Mieske et al. (2006) Mieske S., Jordán A., Côté P., Kissler-Patig M., Peng E. W., Ferrarese L., Blakeslee J. P., Mei S., Merritt D., Tonry J. L., West M. J., 2006, ApJ, 653, 193
- Montuori et al. (2010) Montuori M., Di Matteo P., Lehnert M. D., Combes F., Semelin B., 2010, A&A, 518, A56+
- Ouchi et al. (2004) Ouchi M., Shimasaku K., Okamura S., Furusawa H., Kashikawa N., Ota K., Doi M., Hamabe M., Kimura M., Komiyama Y., Miyazaki M., Miyazaki S., Nakata F., Sekiguchi M., Yagi M., Yasuda N., 2004, ApJ, 611, 660
- Owers et al. (2011) Owers M. S., Randall S. W., Nulsen P. E. J., Couch W. J., David L. P., Kempner J. C., 2011, ApJ, 728, 27
- Peng et al. (2006) Peng E. W., Jordán A., Côté P., Blakeslee J. P., Ferrarese L., Mei S., West M. J., Merritt D., Milosavljević M., Tonry J. L., 2006, ApJ, 639, 95
- Peng et al. (2008) Peng E. W., Jordán A., Côté P., Takamiya M., West M. J., Blakeslee J. P., Chen C., Ferrarese L., Mei S., Tonry J. L., West A. A., 2008, ApJ, 681, 197
- Puzia et al. (2002) Puzia T. H., Zepf S. E., Kissler-Patig M., Hilker M., Minniti D., Goudfrooij P., 2002, A&A, 391, 453
- Romanowsky et al. (2009) Romanowsky A. J., Strader J., Spitler L. R., Johnson R., Brodie J. P., Forbes D. A., Ponman T., 2009, AJ, 137, 4956
- Schlegel et al. (1998) Schlegel D. J., Finkbeiner D. P., Davis M., 1998, ApJ, 500, 525
- Schweizer & Seitzer (1998) Schweizer F., Seitzer P., 1998, AJ, 116, 2206
- Silverman (1986) Silverman B. W., 1986, Density estimation for statistics and data analysis
- Spitler (2010) Spitler L. R., 2010, MNRAS, 406, 1125
- Spitler et al. (2008) Spitler L. R., Forbes D. A., Strader J., Brodie J. P., Gallagher J. S., 2008, MNRAS, 385, 361
- Spitler et al. (2006) Spitler L. R., Larsen S. S., Strader J., Brodie J. P., Forbes D. A., Beasley M. A., 2006, AJ, 132, 1593
- Strader et al. (2007) Strader J., Beasley M. A., Brodie J. P., 2007, AJ, 133, 2015
- Strader et al. (2006) Strader J., Brodie J. P., Spitler L., Beasley M. A., 2006, AJ, 132, 2333
- Tal et al. (2009) Tal T., van Dokkum P. G., Nelan J., Bezanson R., 2009, AJ, 138, 1417
- van den Bosch et al. (2008) van den Bosch R. C. E., van de Ven G., Verolme E. K., Cappellari M., de Zeeuw P. T., 2008, MNRAS, 385, 647
- Woodley et al. (2010) Woodley K. A., Harris W. E., Puzia T. H., Gómez M., Harris G. L. H., Geisler D., 2010, ApJ, 708, 1335
- Yagi et al. (2002) Yagi M., Kashikawa N., Sekiguchi M., Doi M., Yasuda N., Shimasaku K., Okamura S., 2002, AJ, 123, 66
- Yoon et al. (2006) Yoon S., Yi S. K., Lee Y., 2006, Science, 311, 1129
- Zepf & Ashman (1993) Zepf S. E., Ashman K. M., 1993, MNRAS, 264, 611
- Zinn (1985) Zinn R., 1985, ApJ, 293, 424
Appendix A Statistical tests for trimodality
A.1 Kaye’s Mixture Model algorithm
| Comparing galaxies with Subaru/S-Cam photometry and colours where | |||||||||||||||
| Galaxy | Unimodal | p | Bimodal | p | Trimodal | p | Quadrumodal | ||||||||
| (2 over 1) | (3 over 2) | (4 over 3) | |||||||||||||
| NGC 4365 | 0.95 | 0.16 | 1679 | 0.000 | 0.79 | 0.05 | 642 | 0.003 | 0.78 | 0.04 | 600 | 0.252 | 0.78 | 0.05 | 642 |
| 1.05 | 0.12 | 1037 | 0.96 | 0.09 | 567 | 0.96 | 0.09 | 298 | |||||||
| 1.13 | 0.09 | 512 | 1.01 | 0.1 | 302 | ||||||||||
| 1.15 | 0.08 | 437 | |||||||||||||
| NGC 1407 | 0.92 | 0.16 | 1604 | 0.000 | 0.79 | 0.06 | 784 | 0.000 | 0.76 | 0.04 | 616 | - | 0.77 | 0.04 | 696 |
| 1.06 | 0.09 | 820 | 0.93 | 0.11 | 562 | 0.91 | 0.12 | 76 | |||||||
| 1.13 | 0.06 | 426 | 0.98 | 0.1 | 415 | ||||||||||
| 1.14 | 0.06 | 417 | |||||||||||||
| Comparing galaxies with HST/ACS photometry and colours | |||||||||||||||
| NGC 4365 | 1.12 | 0.22 | 1658 | 0.000 | 0.89 | 0.08 | 605 | 0.003 | 0.88 | 0.08 | 550 | 0.596 | 0.88 | 0.08 | 584 |
| 1.25 | 0.15 | 1053 | 1.12 | 0.12 | 488 | 1.11 | 0.12 | 203 | |||||||
| 1.13 | 0.12 | 620 | 1.19 | 0.14 | 348 | ||||||||||
| all point. | 1.36 | 0.11 | 523 | ||||||||||||
| NGC 4365 | 1.19 | 0.24 | 905 | 0.000 | 0.94 | 0.13 | 318 | 0.082 | 0.92 | 0.07 | 120 | 0.915 | 0.91 | 0.15 | 45 |
| 1.33 | 0.17 | 587 | 0.98 | 0.17 | 192 | 0.92 | 0.07 | 204 | |||||||
| 1.33 | 0.17 | 593 | 1.08 | 0.19 | 61 | ||||||||||
| cent. point. | 1.34 | 0.17 | 595 | ||||||||||||
| M60 | 1.24 | 0.26 | 795 | 0.000 | 0.98 | 0.13 | 320 | 0.328 | 0.85 | 0.11 | 51 | - | 0.83 | 0.10 | 43 |
| 1.43 | 0.15 | 475 | 1.00 | 0.09 | 255 | 1.00 | 0.09 | 272 | |||||||
| 1.41 | 0.16 | 489 | 1.29 | 0.08 | 147 | ||||||||||
| cent. point. | 1.49 | 0.13 | 333 | ||||||||||||
The most common tool to determine the statistical significance of GC bimodality is the Kaye’s Mixture Model (KMM) code (Ashman et al., 1994), designed to calculate the ‘p’ statistic for the significance of a homoscedastic bimodal Gaussian distribution being preferred over a unimodal Gaussian distribution. KMM is also capable of determining the significance of heteroscedastic multimodal distributions being preferred over a unimodal Gaussian distribution but the ‘p’ statistic in these cases is an approximation. Applied to our GC colour distribution for NGC 4365 both bimodal and trimodal distributions result in a ‘p’ statistic less than (a probability larger than 99.99 per cent that the multimodal distributions are preferred over the unimodal distribution). The traditional KMM code is however not capable of determining the probability that a trimodal distribution is preferred over a bimodal distribution.
Using an extension to the traditional KMM code, written by Dr Matthew Owers (Owers et al., 2011), we were able to assess a probability for three Gaussian modes over two Gaussian modes bearing in mind that the code was untested for application to GC colour distributions. We attempted to test the code at the same time as using it for our analysis by including checks on how the code performed with varying GC input numbers, analysis of other galaxies’ GC distributions and redundant calculations for the probability of four modes over three modes and bimodality over unimodality. The code showed variation of results with input GC number and gave results for other galaxies inconsistent with results in literature. Comparing results for NGC 4365 with NGC 1407 (data from Spitler et al. 2011 in prep. also used in Romanowsky et al. 2009; Foster et al. 2010; Forbes et al. 2011) the extended KMM test finds that both are trimodal (NGC 4365 with a probability of 99.7 per cent and NGC 1407 with a probability larger than 99.9 per cent) but there is little evidence in the literature for NGC 1407 being trimodal. When the number of GCs is halved for NGC 4365 (data from Peng et al., 2006) the probability of trimodality decreases below 95 per cent (to 91.8 per cent), even though the smaller sample is more central and we expect trimodality to be more prominent there.
A.2 The Kolmogorov-Smirnov test
| VCC number | 1226 | 1316 | 731 | 1535 |
|---|---|---|---|---|
| Other name | M49 | M87 | NGC 4365 | NGC 4526 |
| M49 | 0.79 | 0.86 | ||
| M87 | - | 0.45 | ||
| NGC 4365 | - | - | - |
The Kolmogorov-Smirnov (KS) test shows clearly that most giant elliptical galaxies have GC colour distributions that are significantly different from each other (subpopulation peak colours and widths vary between galaxies, see Table 11) (using GC catalogues from Peng et al., 2006). A sample of galaxies with reasonably large GC numbers were chosen to compare to each other and most galaxies show a probability of larger than 99 per cent of being drawn from a colour distribution different to any other galaxy in the sample. Two very large galaxies (M87 and M49) are consistent with being drawn from the same underlying colour distribution. It is clear that each galaxy’s GC system is formed independently of any other GC system but that similar galaxy properties can result in similar GC systems.
| Simulated | Actual colour distributions | |
|---|---|---|
| distributions | ACS | S-Cam |
| Bimodal | ||
| Trimodal | ||
We also used this test to compare colour distributions simulated from bimodal and trimodal descriptions of the data (as output by KMM) with the actual GC colour distribution and found that the observed GC distribution is significantly different from both simulated distributions. Table 12 shows that for all comparisons the KS test shows probabilities of almost 100 per cent that the simulated and actual distributions are significantly different. Neither simulated distribution is a good enough description of the observed distribution, likely because they cannot take into account the skewness and peakiness (kurtosis) of the observed distributions. The colour modes in GC systems are not perfectly Gaussian and therefore this method of analysis cannot distinguish between bimodal and trimodal Gaussian descriptions of the colour distribution to determine which is more likely.
A.3 Chi-Squared minimization
Comparing the bimodal and trimodal results for a reduced Chi-Squared () minimization is dependent on binning the data in colour. We have chosen to do this binning via an Epanechnikov kernel smoothing of the data rather than an histogram. With different colour bin sizes the statistical results will also be different. We have chosen bin sizes for the Epanechnikov kernel that are equal to the colour errors in the data.
Using the entire radial range of our data we can achieve the best number statistics but the results are not conclusive. For the ACS GCs, where we have better colour resolution, the best-fitting trimodal Gaussian distribution has a slightly smaller reduced value than the best-fitting bimodal distribution but the best fit third mode is very close to blue modes and contains many fewer objects. This ‘third mode’ is not best described as a third GC subpopulation but as an indication that the two modes of the underlying GC distribution are not pure Gaussian but probably Gaussians with both skewness and kurtosis. We do see a significantly smaller reduced value and a central third mode with a large proportion of the GCs in the S-Cam catalogue.
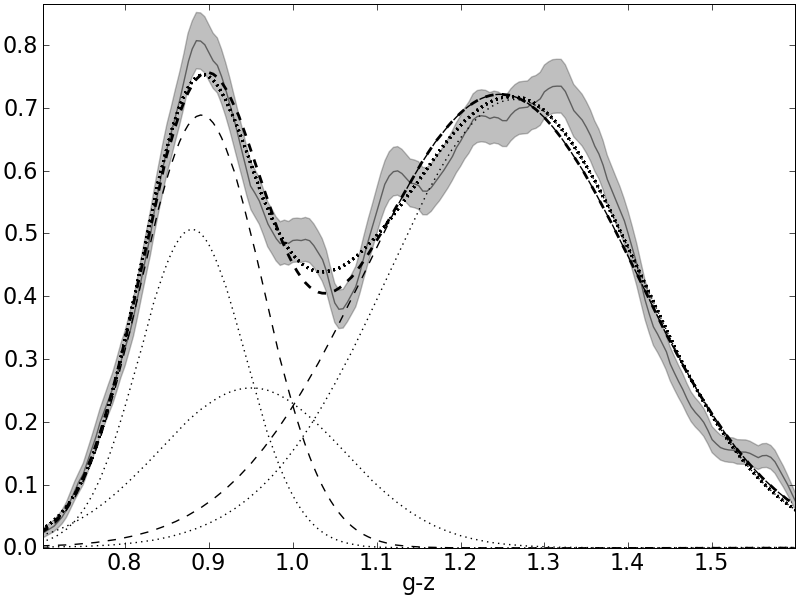
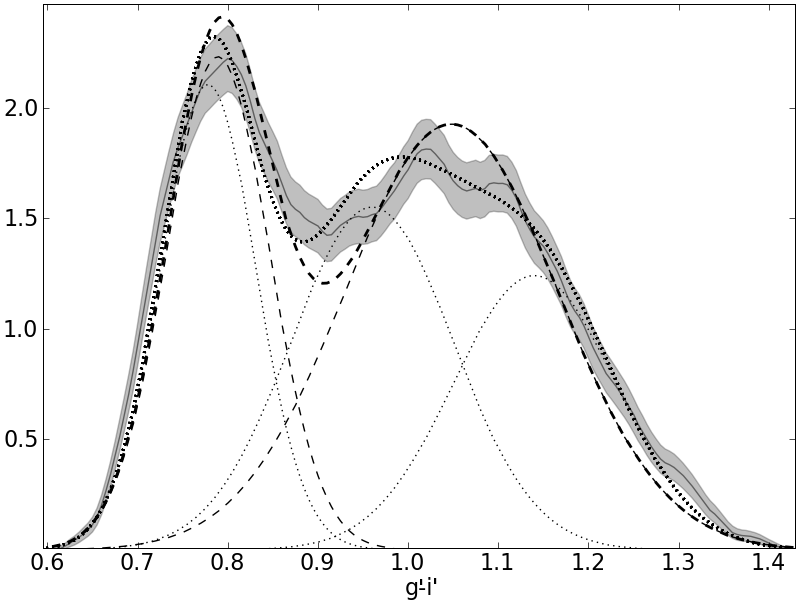
Appendix B Surface density data
| GC candidate radial surface density obtained from HST/ACS photometry | ||||||||||
| rgal | Total | err | rgal | Blue | errB | Red | errR | rgal | Green | errG |
| (arcmin) | (arcmin-2) | (arcmin) | (arcmin-2) | (arcmin-2) | (arcmin) | (arcmin-2) | ||||
| 0.20 | 119 | 30 | 0.62 | 12.5 | 2.3 | 38.0 | 4.1 | 0.63 | 24.6 | 3.3 |
| 0.32 | 125 | 20 | 1.2 | 10.2 | 1.5 | 20.0 | 2.1 | 1.2 | 9.9 | 1.5 |
| 0.50 | 81 | 11 | 1.8 | 8.5 | 1.1 | 14.5 | 1.5 | 2.1 | 3.51 | 0.46 |
| 0.75 | 66.5 | 6.8 | 2.4 | 5.48 | 0.74 | 7.57 | 0.86 | 3.4 | 1.92 | 0.27 |
| 1.10 | 43.4 | 4.0 | 3.0 | 5.27 | 0.69 | 5.06 | 0.67 | |||
| 1.50 | 31.6 | 2.9 | 3.8 | 4.03 | 0.52 | 6.22 | 0.64 | |||
| 1.90 | 26.6 | 2.4 | 5.0 | 3.47 | 0.40 | 2.44 | 0.33 | |||
| 2.30 | 14.9 | 1.6 | ||||||||
| 2.75 | 15.9 | 1.4 | ||||||||
| 3.15 | 13.6 | 1.5 | ||||||||
| GC candidate radial surface density obtained from Subaru/S-Cam photometry | ||||||||||
| 1.10 | 43.4 | 4.0 | 1.2 | 11.4 | 1.6 | 21.8 | 2.2 | 1.5 | 5.86 | 0.73 |
| 1.50 | 32.0 | 2.9 | 1.8 | 9.0 | 1.2 | 12.3 | 1.4 | 2.7 | 2.25 | 0.32 |
| 1.90 | 24.9 | 2.3 | 2.4 | 6.39 | 0.79 | 8.21 | 0.90 | 4.2 | 1.05 | 0.16 |
| 2.30 | 16.4 | 1.7 | 3.0 | 5.23 | 0.69 | 5.85 | 0.73 | 5.8 | 0.74 | 0.11 |
| 2.75 | 14.9 | 1.3 | 3.8 | 4.06 | 0.45 | 4.79 | 0.49 | 8.0 | 0.399 | 0.056 |
| 3.25 | 11.8 | 1.1 | 4.5 | 3.88 | 0.40 | 2.94 | 0.35 | 10.5 | 0.318 | 0.044 |
| 3.75 | 10.70 | 0.95 | 5.4 | 3.34 | 0.36 | 1.93 | 0.28 | 13 | 0.328 | 0.038 |
| 4.25 | 8.54 | 0.80 | 6.2 | 2.52 | 0.25 | 1.85 | 0.22 | 16 | 0.174 | 0.024 |
| 4.75 | 7.57 | 0.71 | 7.4 | 1.77 | 0.17 | 1.18 | 0.14 | |||
| 5.25 | 5.88 | 0.60 | 8.6 | 1.48 | 0.15 | 0.90 | 0.12 | |||
| 5.75 | 5.70 | 0.56 | 9.9 | 1.32 | 0.13 | 0.760 | 0.099 | |||
| 6.30 | 5.05 | 0.46 | 11.1 | 1.08 | 0.11 | 0.594 | 0.082 | |||
| 6.90 | 3.77 | 0.38 | 12.4 | 0.645 | 0.081 | 0.717 | 0.086 | |||
| 7.50 | 3.36 | 0.34 | 13.8 | 0.653 | 0.071 | 0.530 | 0.064 | |||
| 8.20 | 2.47 | 0.24 | 15.2 | 0.582 | 0.067 | 0.431 | 0.058 | |||
| 8.90 | 3.10 | 0.30 | 17.0 | 0.438 | 0.051 | 0.434 | 0.051 | |||
| 9.60 | 2.71 | 0.24 | 20.5 | 0.362 | 0.046 | 0.502 | 0.054 | |||
| 10.5 | 1.83 | 0.17 | ||||||||
| 11.5 | 2.10 | 0.17 | ||||||||
| 12.5 | 1.74 | 0.15 | ||||||||
| 13.5 | 1.67 | 0.14 | ||||||||
| 15.0 | 1.49 | 0.10 | ||||||||
| 17.2 | 1.274 | 0.087 | ||||||||
| 20.2 | 1.033 | 0.093 | ||||||||