Asteroseismic Diagrams from a survey of solar-like oscillations with Kepler
Abstract
Photometric observations made by the NASA Kepler Mission have led to a dramatic increase in the number of main-sequence and subgiant stars with detected solar-like oscillations. We present an ensemble asteroseismic analysis of 76 solar-type stars. Using frequencies determined from the Kepler time-series photometry, we have measured three asteroseismic parameters that characterize the oscillations: the large frequency separation (), the small frequency separation between modes of and (), and the dimensionless offset (). These measurements allow us to construct asteroseismic diagrams, namely the so-called C-D diagram of versus , and the recently re-introduced diagram. We compare the Kepler results with previously observed solar-type stars and with theoretical models. The positions of stars in these diagrams places constraints on their masses and ages. Additionally, we confirm the observational relationship between and that allows for the unambiguous determination of radial order and should help resolve the problem of mode identification in F stars.
Subject headings:
stars: oscillations1. Introduction
Solar-like oscillations are global modes that are stochastically excited by convection. A revolution in their study is now taking place thanks to photometric observations being made with NASA’s Kepler Mission (Koch et al., 2010). Most of the stars are observed at a long cadence of 29.4 minutes, sufficient for studying solar-like oscillations in red giants (e.g., Huber et al., 2010). However, up to 512 stars at a time may be observed at a short cadence (SC) of 58.85 s, rapid enough to sample oscillations in main-sequence and subgiant stars (e.g., Chaplin et al., 2010). This large number of stars makes it possible to perform large-scale analyses in what has been termed ‘ensemble asteroseismology’ (Chaplin et al., 2011b). The aim is to correlate observable global oscillation parameters with physical properties of the stars, such as mass, age and metallicity. This Letter presents a first attempt at such an analysis for main-sequence and subgiant stars, using a survey of solar-like oscillations made during the first ten months of the Kepler Mission.
2. Asteroseismic Parameters

The frequencies of solar-like oscillations for modes of high radial order and low spherical degree are well approximated by the so-called asymptotic relation (Tassoul, 1980):
| (1) |
The large frequency separation, , is the spacing between modes of the same degree and consecutive order and is a probe of the mean stellar density. The small frequency separations, , are sensitive to variations in the sound speed gradient near the core in main-sequence stars. This is highly dependent upon the mean molecular weight of the core and is therefore a probe of the star’s age. The quantities and are labeled in Figure 1, which shows the échelle diagram for the Kepler subgiant KIC 10395018 (Mathur et al., 2011).
The different dependencies of the large and small separations have led to the idea of plotting one against the other in the so-called C-D diagram (Christensen-Dalsgaard, 1984). Theoretical calculations for the C-D diagram have been carried out for main-sequence stars (e.g., Monteiro et al., 2002; Otí Floranes et al., 2005; Mazumdar, 2005; Gai et al., 2009; White et al., 2011) but prior to Kepler, observations were only available for a small number of stars. An observational C-D diagram has now been produced for red giants using Kepler observations (Bedding et al., 2010a; Huber et al., 2010). In this Letter we present an observational C-D diagram for main-sequence and subgiant stars.
The third asteroseismic parameter in equation (1) is the dimensionless offset which, as shown in Figure 1, is related to the absolute position of the ridge in the échelle diagram. The parameter has been rather neglected until recently, despite also being investigated originally by Christensen-Dalsgaard (1984). An asteroseismic diagram based on the relation between and was calculated from models by White et al. (2011) from the zero-age main-sequence to the tip of the red-giant branch. They found that evolutionary-model tracks in the diagram are more sensitive to the mass and age of subgiants than in the C-D diagram. On the observational side, the diagram has been published from Kepler red-giant data by Huber et al. (2010). Similar analysis was performed for CoRoT red giants by Mosser et al. (2011).
3. Observations and Data Analysis
The first ten months of Kepler SC asteroseismic observations (Q1-Q4) were used for a survey, observing about 2000 stars for one month each (Chaplin et al., 2011b). The time series have been prepared from the raw observations as described by Jenkins et al. (2010), and further corrected in the manner described by García et al. (2011). Several methods have been developed to detect oscillations and extract global oscillation parameters such as and , the frequency of maximum power (Campante et al., 2010; Hekker et al., 2010; Huber et al., 2009; Karoff et al., 2010; Mathur et al., 2010; Mosser & Appourchaux, 2009). A comparison of these methods has been made by Verner et al. (2011). Not all of the observed solar-type stars showed oscillations in the month-long survey data sets, partially due to the impact of stellar surface activity on the amplitude of oscillations (Chaplin et al., 2011a).
After determining which stars showed oscillations and their approximate values of and , several teams estimated the mode frequencies. In general, each star in our sample was only fitted by a few teams. The methods for extracting frequencies varied between teams (see Campante et al., 2011; Mathur et al., 2011, and references therein for details of the different methods used).
Since it is necessary to have clearly identifiable modes to measure and , and also to have modes to measure , we are restricted in our sample to stars that are bright and/or have the highest amplitudes. Furthermore, it is necessary to have enough identified modes to make a reliable fit. We required that at least three pairs of and modes were identified in each star. Stars with ambiguous mode identifications were also not considered. These were generally hotter stars with large linewidths, that made it difficult to distinguish between the ridges of and modes (e.g., see Appourchaux et al., 2008; Bedding et al., 2010b).
To select the final frequency list for each star, the results from different teams were compared with the smoothed power spectrum. Some teams reported modes for which there was no peak visible in the power spectrum (usually at low or high frequencies), and those were not included. The remaining lists that passed this comparison could provide measurements for , and that we deemed reliable. If more than one frequency list remained for a given star, we chose the one that most closely fitted the observed peaks in the smoothed power spectrum. If no reliable fit could be made, the star was excluded from this study. With more Kepler data, which will become available for most of these stars, reliable measurements of the separations and should be possible in the future.
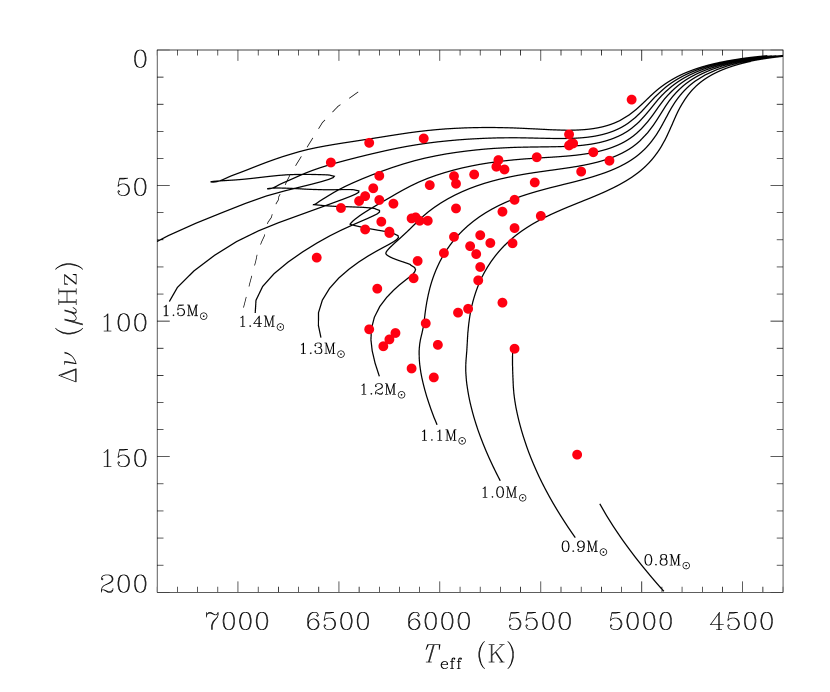
Our final sample contains 76 main-sequence and subgiant stars with apparent magnitudes ranging between 6.9 and 11.7. To illustrate their distribution, we show in Figure 2 a modified H-R diagram in which we plot (instead of luminosity) against effective temperature. Temperatures were determined by An et al. (in prep.) from multicolor photometry available in the Kepler Input Catalog (Brown et al., 2011). Solar-metallicity ASTEC evolutionary tracks (Christensen-Dalsgaard, 2008), neglecting diffusion and core overshoot, are overlaid. Our sample spans an approximate mass range of 0.9–1.6 . Subgiants dominate the sample because they are intrinsically brighter and their oscillations are higher in amplitude.
From the frequency list for each star we calculated , and using the method described by White et al. (2011). Briefly, a weighted least-squares fit was made to the radial (=0) frequencies to simultaneously determine and , as given by equation (1). The uncertainties in these parameters were determined from the fit. The fit was weighted by a Gaussian function centered at the frequency of maximum power, . This fitting method averages over variation of with frequency (curvature in échelle diagrams) that arise from acoustic glitches and the frequency dependence of the upper turning point (Pérez Hernández & Christensen-Dalsgaard, 1998; Roxburgh, 2010).
In the Sun, is known to decrease linearly with frequency (Elsworth et al., 1990). In calculating from models we performed a linear fit, initially allowing the gradient of as a function of frequency to be a free parameter. Again, the fit was weighted by a Gaussian function and the value of was determined at . However, for the vast majority of stars, the number and precision of the frequencies determined from the Kepler data do not yet justify the inclusion of the gradient as an extra free parameter in the fit. When fitting to the data we have kept this gradient constant at the well-determined solar value (). In practice, keeping this gradient constant did not significantly affect the measured value of , or its uncertainty.
4. Results
4.1. C-D diagram
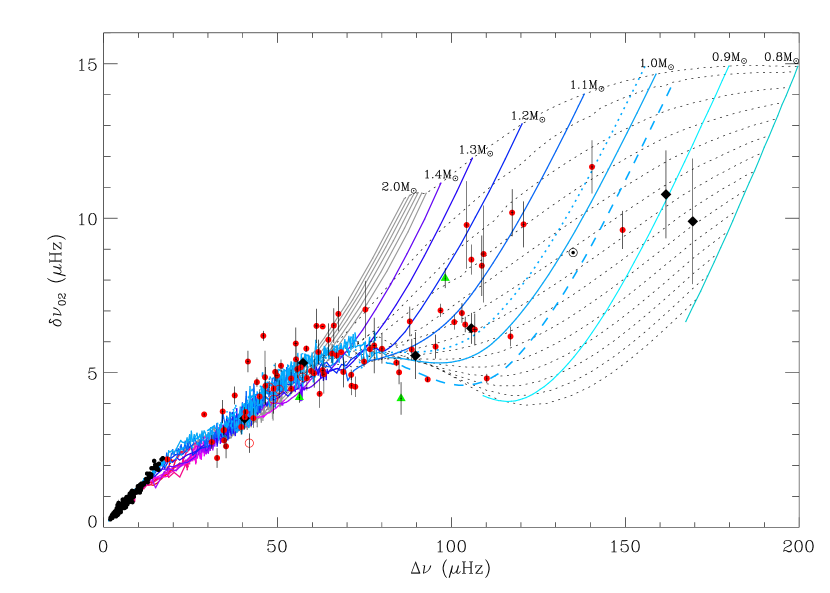
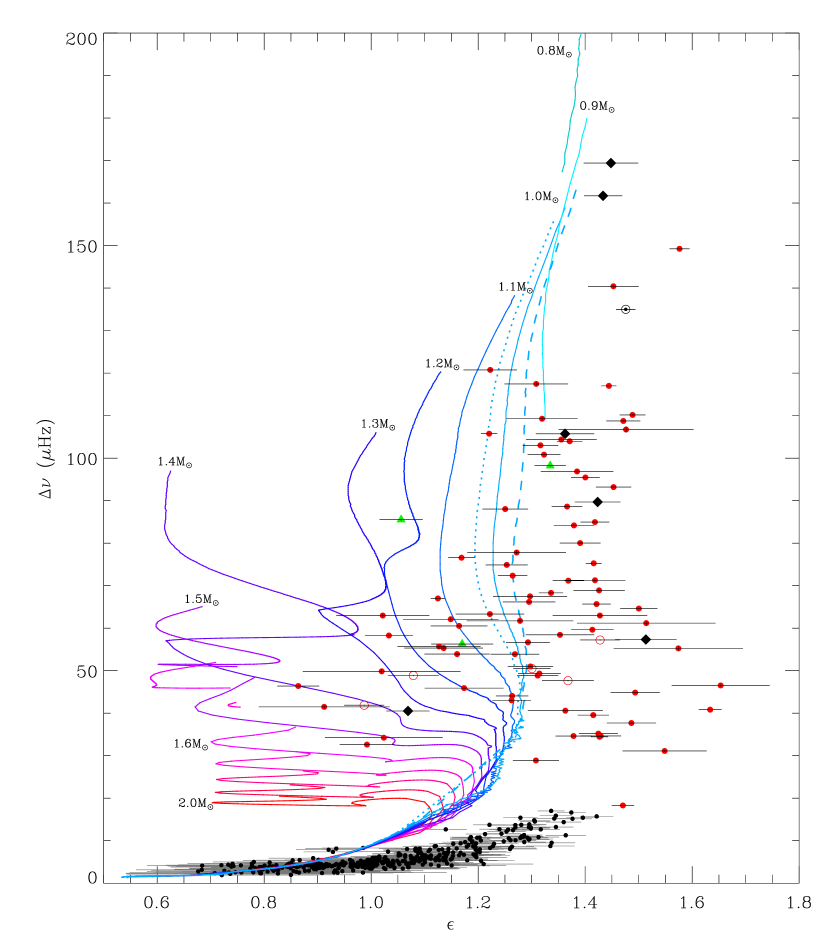
Figure 3 shows the C-D diagram for our sample (filled red circles). We also include: (i) five Kepler stars with previously published frequency lists (open red circles) – KIC 11026764 (known within the Kepler Asteroseismic Science Consortium as ‘Gemma’; Metcalfe et al., 2010), KIC 10273246 (‘Mulder’) and KIC 10920273 (‘Scully’; both Campante et al., 2011), and KIC 11234888 (‘Tigger’) and KIC 11395018 (‘Boogie’; both Mathur et al., 2011); (ii) three CoRoT stars (green triangles) – HD 49385 (Deheuvels et al., 2010), HD 49933 (Benomar et al., 2009) and HD 52265 (Ballot et al., 2011); (iii) six targets observed from the ground (black diamonds) – Cen A (Bedding et al., 2004), Cen B (Kjeldsen et al., 2005), Hyi (Bedding et al., 2007), Boo (Kjeldsen et al., 2003), Ara (Bouchy et al., 2005) and Cet (Teixeira et al., 2009); (iv) the Sun (usual symbol; Broomhall et al., 2009); and (v) 470 Kepler red giants for which , and were measured by Huber et al. (2010; black circles).
Stars evolve in the C-D diagram from the top-right to the bottom-left. In Figure 3 we also show the model evolutionary tracks as determined by White et al. (2011) for near-solar metallicity (), which are based on the ASTEC stellar models shown in Figure 2. During the main-sequence, the evolutionary tracks are well separated (at least for masses below ) but converge during the subgiant and red giant phases. Decreasing the metallicity has the effect of shifting the tracks up and to the left, and in the opposite direction for higher metallicity. We show the tracks for metal-poor () and metal-rich () solar-mass models for comparison (see White et al., 2011, for model C-D diagrams of different metallicities). To ensure that the observed values are directly comparable to those derived from models, the same recipe for measuring , and from data as described in Section 3 was also applied to the models.
The positions of the Kepler stars in the diagram are well covered by the models. In particular, the data show the convergence of different masses during the subgiant phase, as predicted by the modeling. As a result of this convergence, the value of must be measured with high precision for subgiant and red giant stars if it is to provide significantly more information about the structure of the star than alone. This was noted in the modeling of the Kepler subgiant KIC 11026764 by Metcalfe et al. (2010). To better constrain the masses and ages of subgiants, the diagram may prove more useful (see Section 4.2 below).
The presence of mixed modes in the oscillation spectrum can complicate the measurement of by shifting modes from their asymptotically expected frequencies. This is caused by coupling between modes in the envelope and modes in the core (Osaki, 1975; Aizenman et al., 1977). The coupling for is considerably weaker than for , but can still result in a significant shift in the measured value of . This is one cause of the scatter for subgiants of the observed values and also of the model tracks, which further increases the difficulty of determining stellar properties from the values of and alone. Metallicity also contributes to the observed scatter.
The C-D diagram is primarily useful for main-sequence stars, where the evolutionary tracks are well-separated. If the position of a star in the C-D diagram can be well determined and the metallicity is accurately estimated, then its mass and age can be constrained. The physical processes incorporated into the models can also affect the tracks (Mazumdar, 2005) and so masses and ages determined from the C-D diagram will be model dependent. Measurements of temperature and luminosity may aid in distinguishing between different models (Monteiro et al., 2002).
For the stars in our sample, we do not yet have reliable metallicities, so we are unable to provide accurate determinations of their masses and ages based upon their position in the C-D diagram. However, we are able to consider the precision with which these quantities could be determined if we assume a particular uncertainty in metallicity. We have considered several main-sequence stars of varying mass and age. With an uncertainty in of , the masses of these stars could be determined to within 4 to 7%. Age can generally be determined to within 1 Gyr. The precision of the age is heavily influenced by the uncertainty in and the position of the star in the C-D diagram. Many of these stars are being observed for an extended period of time with Kepler and the precision of these measurements will undoubtedly improve. With supporting ground-based spectroscopic observations and detailed modeling involving the individual frequencies, the fundamental properties of these stars will become well-determined and the data should provide significant tests of stellar models.
4.2. The Diagram
Figure 4 shows the observational diagram. Observations cannot determine the radial order directly, and so it is possible for to be uncertain by , particularly in the subgiants ( in the range 20–80 Hz). For these, we have taken to be in the range 0.7–1.7, but note there is some ambiguity for stars near the extremes of this range. The measurement of is complicated by its close relationship to : a small change in can induce a large change in . We have also measured using an alternative method: the variation of the large separation with frequency was measured as described by Mosser et al. (2010), before the radial modes were globally fit and derived, taking into account the mean curvature. A comparison of the values obtained by the two methods showed good agreement, although small systematic offsets exist, typically about 0.1. This offset is probably due to the combined effects of curvature (departure from equation (1)) and the slightly different range of frequencies over which and were measured. A single method must be applied to both models and data used to ensure consistency. In this Letter we have used the method outlined in Section 3.
The observed stars in Figure 4 are offset to the right of the models. This offset is well-known from helioseismology, in which there is a discrepancy between the observed and computed oscillation frequencies of the Sun arising from improper modeling of the near-surface layers (Dziembowski et al., 1988; Christensen-Dalsgaard et al., 1996). A rigorous comparison of the observations with models requires that the offset be taken into account, either by a proper modeling of near-surface layers, or by applying an empirical correction to the models as suggested by Kjeldsen et al. (2008). It remains to be shown whether this empirical correction is valid for stars over a wide range of evolutionary states.
As discussed by White et al. (2011), the value of may be a significant asteroseismic constraint on the masses and ages of stars. This is particularly useful for subgiants, for which the convergence of the evolutionary tracks in the C-D diagram limits the diagnostic potential of the - relation. However, it can be difficult in practice to constrain because it varies with frequency, as discussed in detail by White et al. (2011). As apparent in Figure 4, the value of is sometimes poorly determined. It should also be stressed that the model tracks will vary with metallicity (White et al., 2011), as can be seen from the solar-mass tracks of different metallicities in Figure 4. Nevertheless, for many stars is well constrained and with supporting spectroscopy to constrain metallicity, the diagram shows potential as a useful asteroseismic diagnostic tool.
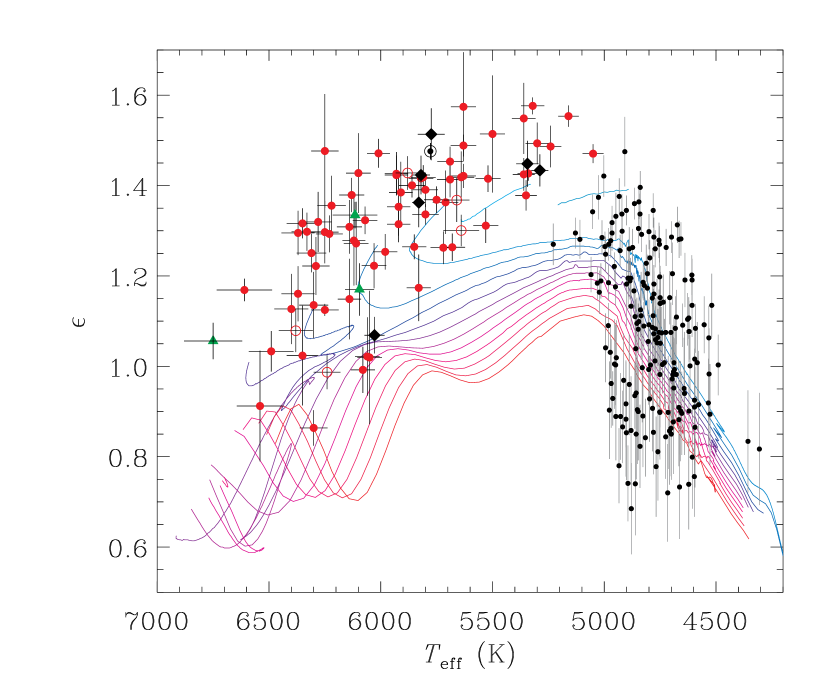
Finally we note that White et al. (2011) demonstrated a relationship between and effective temperature. We confirm this relationship observationally with our larger sample (Figure 5). With this diagram, the ambiguity over the value of , and therefore radial order, can be resolved. The extension of this relationship to higher shows promise for resolving the mode identification problem in F stars referred to in Section 3 (White et al. in prep).
References
- Aizenman et al. (1977) Aizenman, M., Smeyers, P., & Weigert, A. 1977, A&A, 58, 41
- Appourchaux et al. (2008) Appourchaux, T., et al. 2008, A&A, 488, 705
- Ballot et al. (2011) Ballot, J., et al. 2011, A&A, 530, A97
- Bedding et al. (2010a) Bedding, T. R., et al. 2010a, ApJ, 713, L176
- Bedding et al. (2007) Bedding, T. R., et al. 2007, ApJ, 663, 1315
- Bedding et al. (2004) Bedding, T. R., Kjeldsen, H., Butler, R. P., McCarthy, C., Marcy, G. W., O’Toole, S. J., Tinney, C. G., & Wright, J. T. 2004, ApJ, 614, 380
- Bedding et al. (2010b) Bedding, T. R., et al. 2010b, ApJ, 713, 935
- Benomar et al. (2009) Benomar, O., et al. 2009, A&A, 507, L13
- Bouchy et al. (2005) Bouchy, F., Bazot, M., Santos, N. C., Vauclair, S., & Sosnowska, D. 2005, A&A, 440, 609
- Broomhall et al. (2009) Broomhall, A., Chaplin, W. J., Davies, G. R., Elsworth, Y., Fletcher, S. T., Hale, S. J., Miller, B., & New, R. 2009, MNRAS, 396, L100
- Brown et al. (2011) Brown, T. M., Latham, D. W., Everett, M. E., & Esquerdo, G. A. 2011, AJ, 142, 112
- Campante et al. (2011) Campante, T. L., et al. 2011, A&A, 534, A6
- Campante et al. (2010) Campante, T. L., Karoff, C., Chaplin, W. J., Elsworth, Y. P., Handberg, R., & Hekker, S. 2010, MNRAS, 408, 542
- Chaplin et al. (2010) Chaplin, W. J., et al. 2010, ApJ, 713, L169
- Chaplin et al. (2011a) Chaplin, W. J., et al. 2011a, ApJ, 732, L5
- Chaplin et al. (2011b) Chaplin, W. J., et al. 2011b, Science, 332, 213
- Christensen-Dalsgaard (1984) Christensen-Dalsgaard, J. 1984, in Space Research in Stellar Activity and Variability, ed. A. Mangeney & F. Praderie, 11
- Christensen-Dalsgaard (2008) Christensen-Dalsgaard, J. 2008, Ap&SS, 316, 13
- Christensen-Dalsgaard et al. (1996) Christensen-Dalsgaard, J., et al. 1996, Science, 272, 1286
- Deheuvels et al. (2010) Deheuvels, S., et al. 2010, A&A, 515, A87
- Dziembowski et al. (1988) Dziembowski, W. A., Paterno, L., & Ventura, R. 1988, A&A, 200, 213
- Elsworth et al. (1990) Elsworth, Y., Howe, R., Isaak, G. R., McLeod, C. P., & New, R. 1990, Nature, 347, 536
- Gai et al. (2009) Gai, N., Bi, S. L., Tang, Y. K., & Li, L. H. 2009, A&A, 508, 849
- García et al. (2011) García, R. A., et al. 2011, MNRAS, 414, L6
- Hekker et al. (2010) Hekker, S., et al. 2010, MNRAS, 402, 2049
- Huber et al. (2010) Huber, D., et al. 2010, ApJ, 723, 1607
- Huber et al. (2009) Huber, D., Stello, D., Bedding, T. R., Chaplin, W. J., Arentoft, T., Quirion, P., & Kjeldsen, H. 2009, Communications in Asteroseismology, 160, 74
- Jenkins et al. (2010) Jenkins, J. M., et al. 2010, ApJ, 713, L87
- Karoff et al. (2010) Karoff, C., Campante, T. L., & Chaplin, W. J. 2010, arXiv: 1003.4167
- Kjeldsen et al. (2003) Kjeldsen, H., et al. 2003, AJ, 126, 1483
- Kjeldsen et al. (2005) Kjeldsen, H., et al. 2005, ApJ, 635, 1281
- Kjeldsen et al. (2008) Kjeldsen, H., Bedding, T. R., & Christensen-Dalsgaard, J. 2008, ApJ, 683, L175
- Koch et al. (2010) Koch, D. G., et al. 2010, ApJ, 713, L79
- Mathur et al. (2010) Mathur, S., et al. 2010, A&A, 511, A46
- Mathur et al. (2011) Mathur, S., et al. 2011, ApJ, 733, 95
- Mazumdar (2005) Mazumdar, A. 2005, A&A, 441, 1079
- Metcalfe et al. (2010) Metcalfe, T. S., et al. 2010, ApJ, 723, 1583
- Monteiro et al. (2002) Monteiro, M. J. P. F. G., Christensen-Dalsgaard, J., & Thompson, M. J. 2002, in ESA Special Publication, Vol. 485, Stellar Structure and Habitable Planet Finding, ed. B. Battrick, F. Favata, I. W. Roxburgh, & D. Galadi, 291
- Mosser & Appourchaux (2009) Mosser, B., & Appourchaux, T. 2009, A&A, 508, 877
- Mosser et al. (2010) Mosser, B., et al. 2010, A&A, 517, A22
- Mosser et al. (2011) Mosser, B., et al. 2011, A&A, 525, L9
- Osaki (1975) Osaki, J. 1975, PASJ, 27, 237
- Otí Floranes et al. (2005) Otí Floranes, H., Christensen-Dalsgaard, J., & Thompson, M. J. 2005, MNRAS, 356, 671
- Pérez Hernández & Christensen-Dalsgaard (1998) Pérez Hernández, F., & Christensen-Dalsgaard, J. 1998, MNRAS, 295, 344
- Roxburgh (2010) Roxburgh, I. W. 2010, Ap&SS, 328, 3
- Saio & Gautschy (1998) Saio, H., & Gautschy, A. 1998, ApJ, 498, 360
- Tassoul (1980) Tassoul, M. 1980, ApJS, 43, 469
- Teixeira et al. (2009) Teixeira, T. C., et al. 2009, A&A, 494, 237
- Verner et al. (2011) Verner, G. A., et al. 2011, MNRAS, 415, 3539
- White et al. (2011) White, T. R., Bedding, T. R., Stello, D., Christensen-Dalsgaard, J., Huber, D., & Kjeldsen, H. 2011, ApJ, in press