∎
Tel.: +49-89-300003916
Fax: +49-89-300003495
22email: saglia@mpe.mpg.de 33institutetext: Universitätssternwarte 44institutetext: Scheinerstraße 1, D-81679 München, Germany
Implementation of PhotoZ under Astro-WISE
Abstract
We describe the implementation of the PhotoZ code in the framework of the Astro-WISE package and as part of the Photometric Classification Server of the PanSTARRS pipeline. Both systems allow the automatic measurement of photometric redshifts for the millions of objects being observed in the PanSTARRS project or expected to be observed by future surveys like KIDS, DES or EUCLID.
Keywords:
Astronomy databases Properties of galaxies Red shiftpacs:
95.10.Jk 98.62.-g 98.62.Py1 Introduction
Since the completion of the Sloan Digital Sky Survey (SDSS) SDSS optical astronomy has moved on from the detailed studies of single objects to a phase where catalogues with millions of entries can be produced. This has allowed for detailed statistical studies of entire populations, as well as searches for extremely rare objects. Consequently, astronomers are forced to update their approach to data analysis and to embed their codes in database-supported applications that support efficient automatic procedures and easy administration of the analysis processes. One such case is the measurement of photometric redshifts for the hundreds of millions of galaxies that ongoing or future optical and near infrared photometric surveys will deliver.
We are directly involved in three large scale imaging surveys. The Panoramic Survey Telescope and Rapid Response System 1 (PanSTARRS1, see Kaiser04 ) project started regular operations in May 2010 and is producing a 5 band (grizy) survey of 3/4 of the sky that at the end of the forseen 3 years of observations, will be mag deeper than SDSS. Approximately two hundred million galaxies, a similar number of stars, about a million quasars and Type Ia Supernovae will be detected. VIKING (VISTA Kilo-Degree Infrared Galaxy Survey 111http://www.eso.org/public/teles-instr/surveytelescopes/vista/surveys.html) is a near-infrared 4 band (ZJHK) survey of 1500 square degrees of extragalactic sky that started in December 2009 at the VISTA telescope. This will be complemented in 5 optical bands (ubgri) by the Kilo Degree Survey (KIDS 222http://www.strw.leidenuniv.nl/kuijken/KIDS/) at the VST telescope, to start in October 2011. Finally, the Dark Energy Survey (DES 333http://www.darkenergysurvey.org/) will image 5000 square degrees around the southern galactic pole in 4 optical bands (bgri) at the CTIO telescope. Looking to the future, we are participating in the EUCLID 444http://sci.esa.int/science-e/www/area/index.cfm?fareaid=102 bid. If approved, the satellite will image 20000 square degrees of the extragalactic sky in the optical and NIR channels, providing unprecedented deep photometry for many millions of galaxies.
The science driving these projects ranges from Baryonic Acoustic Oscillations and growth of structure, to weak shear, galaxy-galaxy lensing and lensing tomography. All of them rely on the determination of accurate photometric redshifts for extremely large numbers of galaxies. Further science goals, like the detection of high redshift quasars and galaxies, the discovery of very cool stars, or the study of galaxy evolution with cosmic time will also profit from the availability of good photometric redshift and star/galaxy photometric classification. Therefore, in the last few years we have designed and implemented schemes to derive and keep organized photometric redshifts, probability distributions and star/galaxy classification for extremely large datasets.
Here we describe two aspects of these efforts; the PhotoZ implementation for Astro-WISE and the PanSTARRS1 Photometric Classification Server. The structure of the paper is as follows. Sect. 2 considers the algorithm at the core of our implementations and its recent scientific use. Sect. 3 discusses the implementation of the code for large data sets. In Sect. 3.1 we present its Astro-WISE incarnation and give examples of its use and evaluate its performances in Sect. 3.2. Sect. 3.3 is dedicated to the implementation of the code for the PanSTARRS1 survey. We draw our conclusions in Sect. 4.
2 The PhotoZ code: algorithm and science applications
In the last decade several efficient codes for the determination of photometric redshifts have been developed and a fair summary of these efforts would go well beyond the scope of the present contribution. In short, there are mainly two approaches, one based on empirical methods, the other on template fitting. In the first case one tries to parametrize the low-dimensional surface in color-redshift space that galaxies occupy using low-order polynomials, nearest-neighbor searches or neural networks Csabai03 ; Collister04 . These codes extract the information directly from the data, given an appropriate training set with spectroscopic information. Template fitting methods work instead with a set of model spectra from observed galaxies and stellar population models Padmanabhan05 ; Ilbert06 ; Mobasher07 ; Pello09 .
The PhotoZ code that we have implemented under Astro-WISE belongs to the second category and its original incarnation is described in Bender01 . The code estimates redshifts by comparing a set of discrete template SEDs T to the broadband photometry of the (redshifted) galaxies. For each SED the full redshift likelihood function including priors for redshift, absolute luminosity and SED probability is computed using the Bayes’ theorem:
| (1) |
where is the vector of measured colors, the galaxy absolute magnitude, is the probability of obtaining a normalized for the given dataset with its errors, redshift and template , and the prior distribution. This is a product of parametrized functions of the type:
| (2) |
where the variable stands for redshift or absolute magnitudes. Typically we use , or , and and with appropriate values for mean redshifts and ranges, or mean absolute magnitudes and ranges, which depend on the SED type. The set of galaxy templates is semi-empirical and is chosen to map the color space spanned by the different types of objects at different redshifts. The original set Bender01 includes 31 SEDs describing a broad range of galaxy spectral types, from early to late to star-bursting objects. Recently, we added a set of SEDs tailored to fit luminous red galaxies and one SED to represent the average QSO spectrum at redshift Saglia11 . Furthermore, the method also fits a set of stellar templates, allowing a star/galaxy classification and an estimate of the line-of-sight extinction for stellar objects. The templates cover typically the wavelength range Å up to 25000 Å (with the QSO template covering instead 300-8000 Å) and are sampled with a step typically 10 Å wide (varying from 5 to 20 Å; the QSO SED has Å). The method has been extensively tested and applied to several photometric catalogues with spectroscopic follow-ups. Given a (deep) photometric dataset covering the wavelength range from the U to the K band, excellent photometric redshifts with up to with at most a few percent catastrophic failures can be derived for every SED type (Gabasch04 , Feulner05 , Gabasch08 ). When applied to the 5 filter band catalogs of SDSS Greisel11 or of PanSTARRS Saglia11 , the code delivers for luminous red galaxies up to redshift . A more detailed description of the scientific merits of PhotoZ goes beyond the scope of this paper, see Hildebrandt10 to compare these performances to the ones achieved by other packages. The code is available in Fortran and C++ versions.
3 Implementation for large datasets
The science applications described in the previous section dealt with some thousand objects and could be managed by simple means, i.e. ascii-based catalogues. In the era of all-sky surveys and/or very deep fields, where millions, if not billions of objects are imaged, this approach is doomed to fail. The support of a database, the automatisation of the procedures and the tools to administrate the testing and analysis of the results become essential ingredients for a successful science project. Therefore, having in mind our participation in the PanSTARRS1 survey and future projects like KIDS, DES and possibly EUCLID (see Introduction), we designed and implemented two packages, PhotoZ for Astro-WISE (see Sect. 3.1 and 3.2) and the Photometric Classification Server (PCS) for PanSTARRS1 (see Sect. 3.3).
3.1 PhotoZ for Astro-WISE
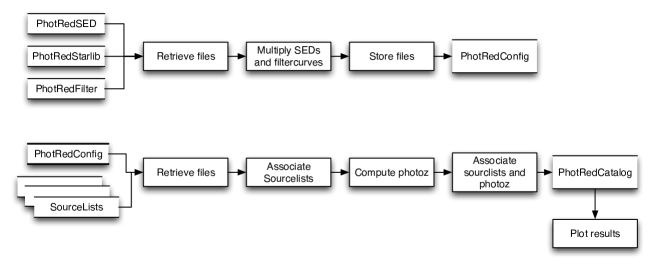
We embedded the PhotoZ code in Astro-WISE following the general philosophy of the package. A Python wrapper (PhotRedCatalog) interfaces the Oracle Astro-WISE database to the (Fortran) code, providing the necessary reading, executing and writing calls to construct the ascii input files with the photometry vectors, call the (compiled Fortran) PhotoZ code and transfer the ascii output back into the database. As usual in every Astro-WISE application, each persistent entry created in this last phase allows the backward tracing of the components down to the single raw and calibration frames that went into the production of the photometry used in the process. The option for a posteriori evaluation of the full redshift probability distribution for a list of selected objects is provided. A separate routine (PhotRedConfig) allows the folding of the available spectral energy distributions with the given filter curves on a predefined grid of redshifts to maximize the speed of the PhotoZ code for a given photometric set. Parallelization is obtained by splitting the list of objects to be analysed in smaller chunks, and executing separate calls of PhotoZ on the multiple cluster nodes. Visualization routines give the possibility to plot the best-fitting SED, the best-fitting stellar SED, the datapoints and the redshift probability distribution of selected objects. A schematic description of the structure of the PhotoZ code is given in Fig. 1
3.2 Examples and Performances
PhotoZ runs under Astro-WISE as implemented at the Munich node on the PanSTARRS cluster, a 175 nodes (each with 2.6GHz 4 CPUs and 6 GB memory, for a total of 700 CPUs) Beowulf machine with 180 TB disk space, attached to a PB robotic storing device, mounted at the Max-Planck Rechenzentrum in Garching. Two servers run the Oracle database. The Munich Astro-WISE node is federated with the central node of Groningen.
As an example how the system works, we describe the derivation of the photometric redshifts of galaxies detected in the Medium Deep Field 4 (MDF04) of PanSTARRS1 (see also 3.3 and Saglia11 ) in an Astro-WISE session. In this context below we indicate with “awe” the Python Astro-WISE prompt. For a detailed description how to run the commands discussed below we refer to the Astro-WISE manual 555http://www.astro-wise.org/portal/aw_howtos.shtml.
We first ingest the PanSTARRS1 filter curves:
- •
-
awe photredfilter = PhotRedFilter( pathname=’PS_g.filter’)
- •
-
awe photredfilter.filter=(Filter.mag_id==’PS_g g’)
- •
-
awe …
- •
-
awe photredfilter.make()
where PS_g.filter is an ASCII file with two columns, wavelength in Angstroms and the transmission of the PanSTARRS1 g filter at this wavelength. We repeat the process for the filters r, i, z and y. Then we configure the system, specifying the galaxy and stellar libraries (see Bender01 ):
- •
-
awe filt = (Filter.name == ’PS_g’)[0]
- •
-
awe pfg = (PhotRedFilter.filter == filt )[0]
- •
-
awe …
- •
-
awe pse = (PhotRedSED.sed_name == ’mod_e.sed’)[0]
- •
-
awe ps1 = (PhotRedSED.sed_name == ’mod_s210.sed’)[0]
- •
-
awe …
- •
-
awe starlib=(PhotRedStarlib.filename==’starlib_pickles.lis’)[0]
- •
-
awe pc = PhotRedConfig()
- •
-
awe pc.SEDs=[pse,ps1,…]
- •
-
awe pc.filters=[pfg,pfr,pfi,pfz,pfy]
- •
-
awe pc.starlib=(starlib)[0]
- •
-
awe pc.name=’PanSTARRS1_MDF04’
- •
-
awe pc.make()
We now ingest the PanSTARRS1 photometric catalogue into the SourceLists sg, sr, si, sz, sy and generate the photometric redshifts with the commands:
- •
-
awe pr = PhotRedCatalog()
- •
-
awe pr.config=pc
- •
-
awe pr.master=sg
- •
-
awe pr.sourcelists=[sg,sr,si,sz,sy]
- •
-
awe pr.name=’PanSTARRS1_MDF04’
- •
-
awe pr.make()
The results are stored in the pr.associate_list AssociateList and can be examined through the Oracle database tools and/or the Python awe prompt. For example, the command
- •
-
awe pr.plot( 23 )
plots the best-fitting SED, the best-fitting stellar SED, the datapoints and the redshift probability distribution for the objects with identification number 23 in the associate_list.
The derivation of photometric redshifts for the entries in the MDF04 photometric catalogue down to the magnitude takes 3.3 sec if our full PanSTARRS cluster (700 CPUs) is available (i.e. objects per second per node). Through the federation mechanism the results can be seen from each Astro-WISE federated node that has the relevant permissions to access the data. We are in the process of optimizing the SEDs and validating the photometric redshifts through available spectroscopic data for the PanSTARRS1 filter set. First results are discussed in Saglia11 , where a precision of for red luminous galaxies up to redshift is achieved.
3.3 The Photometric Classification Server for PanSTARRS1
The Photometric Classification Server (PCS) for PanSTARRS1 provides software tools to perform a photometric star/QSO/galaxy classification, compute photometric redshifts for galaxies and (a subset of) best-fitting temperature, metallicity, gravity and interstellar extinction parameters for stars. A detailed description of the system can be found in Saglia08 , Snigula09 and Saglia11 . The code is interfaced to the Published Science Products System (PSPS) database of PanSTARRS1 (see Heasley08 ), based on Microsoft SQL and inspired in its structure by the SDSS database. The “manual mode” of operations is similar to the one described in Sect. 3.1. The user can query the database and run the code off-line through SQL commands and calls to shell scripts, or also through a web interface. This mode is useful when optimizing the SEDs using available datasets with spectroscopic redshifts. The normal mode of operation, however, is fully automatized. The interface to PSPS triggers the analysis of newly produced object catalogues of the static sky on a regular basis. When new entries are found, CAS-like jobs extract them from the database in Hawaii, format them on our PanSTARRS cluster and submit multiple runs of the C++ version of PhotoZ with sub-blocks of data to parallelize the processing. Finally, the resulting photometric redshifts are stored in a local MySQL database and the corresponding table is pulled by the central one in Hawaii. The process to download from the PSPS database the MDF04 catalogue ( minutes), measure the photometric redshifts on our PanSTARRS cluster ( sec if 700 nodes are available) and provide the results for pulling by the PSPS database ( minutes) takes at most 5 minutes. Therefore we expect to sustain the expected regular flow of new photometric data of PanSTARRS1 without problems. The system is open for the implementation of further different approaches to photometric redshifts (see Sect. 2).
4 Conclusions
PhotoZ under Astro-WISE and PCS for PanSTARRS1, the systems to compute accurate photometric redshifts for large datasets described in this paper, are up and running. They are ready to analyse and archive the photometric catalogues with millions of entries that the wide area surveys started recently or starting in the near future will provide. They can be considered as prototypes for the future development of the data analysis schemes of EUCLID Laureijs09 .
References
- (1) Abazajian, K. N. et al. “The Seventh Data Release of the Sloan Digital Sky Survey” ApJS, 182, 543 (2009)
- (2) Kaiser, N., “Pan-STARRS: a wide-field optical survey telescope array”, SPIE, 5489, 11-12 (2004)
- (3) Csabai, I. et al. “The Application of Photometric Redshifts to the SDSS Early Data Release”, AJ, 125, 580 (2003)
- (4) Collister, A.A., Lahav, O., “ANNz: Estimating Photometric Redshifts Using Artificial Neural Networks”, PASP, 116, 345 (2004)
- (5) Padmanabhan, N. et al., “Calibrating photometric redshifts of luminous red galaxies”, MNRAS, 359, 237 (2005)
- (6) Ilbert, O. et al., “Accurate photometric redshifts for the CFHT legacy survey calibrated using the VIMOS VLT deep survey”, A&A, 457, 841 (2006)
- (7) Mobasher, B. et al., “Photometric Redshifts of Galaxies in COSMOS”, ApJS, 172, 117
- (8) Pello, R. et al., “Photometric redshifts and cluster tomography in the ESO Distant Cluster Survey”, A&A, 508, 1173 (2009)
- (9) Bender, R. et al., “The FORS Deep Field: Photometric Data and Photometric Redshifts”, in Deep Fields, edited by S. Cristiani, A. Renzini, and R.E. Williams, Springer-Verlag, Berlin/Heidelberg, p. 96-101 (2001)
- (10) Saglia, R.P. et al., “The Photometric Classification Server for Pan-STARRS1”, ApJ, in press (2011), arXiv:1109.5080
- (11) Gabasch, A. et al., “The evolution of the luminosity functions in the FORS Deep Field from low to high redshift: I. The blue bands”, A&A, 421, 41-58 (2004)
- (12) Feulner, G., et al., “Specific Star Formation Rates to Redshift 5 from the FORS Deep Field and the GOODS-S Field”, ApJ, 633, L9-L12 (2005)
- (13) Gabasch, A. et al., “A deep i-selected multiwaveband galaxy catalogue in the COSMOS field”, MNRAS, 383, 1319-1335 (2008)
- (14) Greisel, N., “Elliptical galaxies as traces of large scale structure”, Master Thesis, Ludwig Maximilian University, Munich (2010)
- (15) Hildebrandt, et al., “PHAT: PHoto-z Accuracy Testing”, A&A, 523, A31 (2010)
- (16) Saglia, R.P., “The Photometric Classification Server of PanSTARRS1”, Proc. of the Conference “Classification and Discovery in Large Astronomical Surveys”, Ringberg Castle, 14-17 October 2008, Ed. C.A.L. Bailer-Jones, AIP Conference Proceedings vol. 1082, AIP (Melville, New York), p. 366-372 (2008)
- (17) Snigula, J.M., Bender, R. Saglia, R., Drory, N., “The Photometric Classification Client for Pan-STARRS-1”, ASP Conference Series, J. Lewis, R. Argyle, P. Bunclarck, D. Evans, E. Gonzales-Solares Eds., 421, 268-271 (2009)
- (18) Heasley, J.N., “The Pan-STARRS Data Processing and Science Analysis Software Systems”, Proc. of the Conference “Classification and Discovery in Large Astronomical Surveys”, Ringberg Castle, 14-17 October 2008, Ed. C.A.L. Bailer-Jones, AIP Conference Proceedings vol. 1082, AIP (Melville, New York), p. 352-358 (2008)
- (19) Laureijs, R., “Euclid Assessment Study Report for the ESA Cosmic Visions”, astro-ph/0912.0914 (2009).