Measurement of the top pair invariant mass distribution at 7 TeV and search for new physics
Abstract
An overview of searches for new physics in the sample from the CMS Collaboration is presented with data collected at the Large Hadron Collider at TeV. There are several searches presented, including same-sign dilepton signatures, semileptonic signatures, and all-hadronic signatures, the latter of which uses advanced jet reconstruction techniques.
I Introduction
A number of scenarios for physics beyond the Standard Model (BSM) feature new gauge interactions with favorable couplings to the third-generation quarks (for instance, see References Dimopoulos and Georgi (1981); Weinberg (1976); Susskind (1979); Hill and Parke (1994); Chivukula et al. (1999); Arkani-Hamed et al. (2001, 1998); Randall and Sundrum (1999a, b)). These couplings result in new heavy states which could appear as resonances in top pair production at the LHC. For example, Reference Agashe et al. (2008) shows an example of these heavy states expressed as Kaluza-Klein gluons with concrete predictions of cross sections and branching ratios. Also of note are models that have recently been proposed to solve the discrepancy in the top pair production forward-backward asymmetry from the Tevatron (Reference Aaltonen et al. (2008a); Abazov et al. (2008); Aaltonen et al. (2011); top (2010, 2011)). For instance, one recent model-independent study of the implications of the forward-backward asymmetry is presented in Reference Delaunay et al. (2011), which argues that a strong enhancement of the production cross section of pairs must be seen at the LHC for invariant masses above 1.5 or 2.0 TeV/ if the deviation is due to new physics at a heavy mass scale .
Searches for new physics in top pair production have been performed by the Tevatron experiments Aaltonen et al. (2008b, c); d0t (2009). The Tevatron measurements provide the most stringent lower mass limits for a narrow resonance, where a narrow topcolor leptophobic resonance is excluded for masses below about 800 GeV/.
II All Hadronic Decay Channel
The all-hadronic analysis in Reference EXO (2011a) utilizes 0.8 fb-1 of data, and exploits the highly-boosted nature of the top quarks from the high-mass resonances, namely the fact that the top quark’s decay products often fall inside a single jet. If the boost is not too large, the decay products are distinguishable in this jet (in particular, the boson decay products), and this information can be used to reduce the large generic QCD dijet production. These decay products within the jet are referred to as “subjets”.
A top tagging algorithm Kaplan et al. (2008); cat (2009) is used to identify merged top jets by analyzing their substructure. This is accomplished by examining the clustering sequence of the jets, and the application of specialized selection criteria. The behavior of jets from heavy particles such as top quarks is different from generic QCD jets. For instance, QCD jets tend to have very few subjets within them, whereas the jets that originate from hadronic top decays have three or four subjets. Furthermore, the kinematics of these subjets is different. While the subjets of generic QCD jets tend to be close together and one often dominates the jet energy (due to gluon emission in the final state), the top quark decay products share the jet energy more equally and emerge at wider angles.
The masses involved in the process (the top mass and the mass) also give strong handles for such discrimination. The mass of a typical QCD jet exhibits a falling spectrum after a quick initial rise (Reference Ellis et al. (2008)), whereas the mass of a fully merged jet from a top quark is very close to the top mass (170-175 GeV/c2). It is often possible to identify two of the subjets within the top jet as coming from the decay of the . Similarly to the mass of the entire jet, for generic QCD jets the mass of this candidate has a falling spectrum in the region of interest, whereas the decay products from the sequential top decay are very close to the mass.
For situations where the decay products of the top quark are not contained entirely in one jet, a technique has also been developed to discriminate against QCD backgrounds using similar techniques as described for the fully-merged case. However, for this purpose a tool is deployed that is able to handle more general topologies than the “top jet tagger” targeted specifically at the hadronic top decays.
The jet pruning algorithm, presented in Reference Ellis et al. (2009, 2010), can be used to identify substructure from general topologies. While this tool has been shown to be slightly less performant on fully boosted top jets than the targeted top jet tagger, it is of more general utility for arbitrary topologies. Reference Abdesselam et al. (2011) has detailed algorithmic comparisons of the taggers for fully boosted top systems, and for instance, for the same efficiency to identify true top quarks, the probability to misidentify a generic QCD jet with the jet pruning algorithm is larger by 20-30% than the targeted top jet tagger.
On the other hand, the targeted top tagging tool is not immediately applicable to moderately boosted top quark systems where not all of the decay products are merged, and as such, the jet pruning tool is used to develop an algorithm that identifies boosted hadronically-decaying -bosons into one jet (referred to as a jet). In this case, the fact that the decay products from generic QCD jets are radiated fairly asymmetrically is exploited, whereas the decay products from the are more symmetric because they arise from a two-body decay of boson. Top quark candidates are then constructed by combining this jet with another jet that is close to it, and form a full top-quark candidate.
Figure 1 shows an event display of a “golden” triply-tagged all-hadronic candidate. The event contains a top-tagged jet, a -tagged jet, and a bottom-tagged jet. This is a sample that has an enhanced contribution.
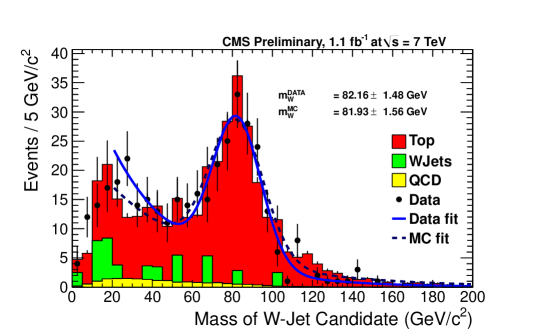
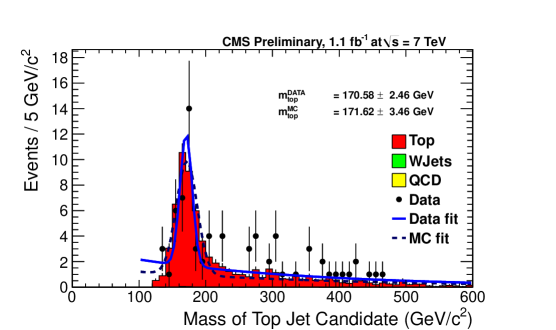
A demonstration of the ability to extract boosted jets in a well-controlled high purity subsample of the data is shown in Figures 2 and 3. In these figures, a sample of moderately boosted top quarks is extracted from the semileptonic decay channel by requiring strong transverse momentum cuts to hemispherically separate the top quark decay products. The mass of the highest mass jet in the “hadronic” hemisphere is shown (corresponding to the mass), as well as the invariant mass of the candidate with the nearest jet, which is the mass of the top quark candidate. This is a very pure sample with negligible backgrounds, and the data are well-reproduced by the Monte Carlo expectations. The peak is quite pronounced, and demonstrates the efficacy of the methodology in extracting massive boosted hadronic final states using substructure techniques.
From this sample, the subjet jet energy scale can be determined from the difference in the mass peaks in data and Monte Carlo. The subjet energy scale is measured to be 1.01 0.04 given this sample. In addition, the efficiency to select candidate jets can be measured in the same sample by comparing the event selection efficiency in data and Monte Carlo, and assuming that the same ratio (or “scale factor”) applies to other samples. The data-to-Monte-Carlo scale factor is determined to be 0.93 0.13.

In Reference EXO (2011a) there are actually two analyses, one in the dijet topology (utilizing two top tags), and one in the trijet topology (utilizing one top tag and one -tag). The results are combined for a final limit.
The background estimates for both analyses are taken primarily from data. The small contribution from Standard Model decays is taken from Monte Carlo, correcting for trigger efficiency, the efficiency of the top- and -tagging algorithms, and jet energy scale. The largest background, however, is generic QCD production which has been mis-identified as having substructure (“mistags”). This background is estimated by weighting jets in a sample before applying the final top-jet tag, where the weighting factor is derived from generic dijet data that has been signal depleted.
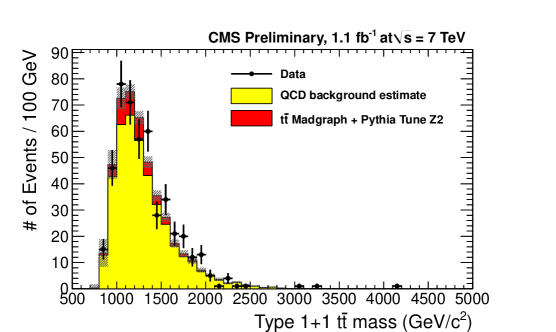
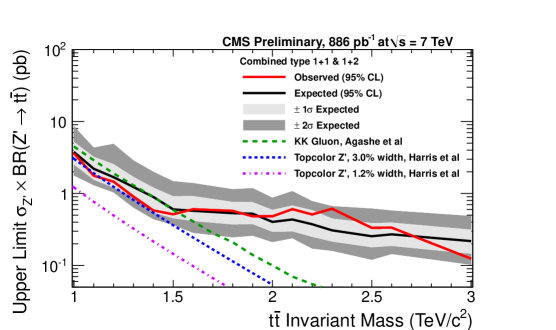
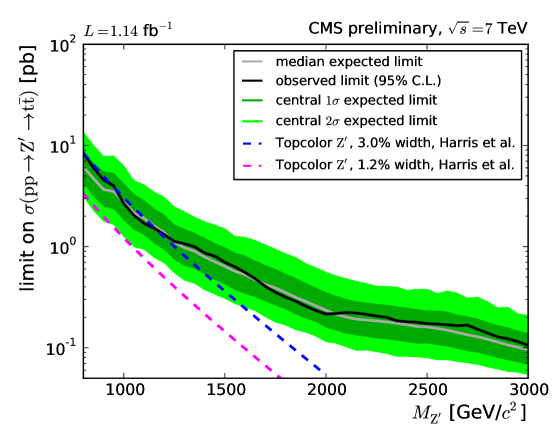
Figure 4 shows the results of the event selection in the dijet topology (similar plots for the trijet topology can be seen in the original reference). Extremely good agreement is observed with the prediction, and hence a limit on new physics models is formulated. The technique chosen is to hypothesize a counting experiment in a signal window (chosen by the expected size of a narrow resonance in the invariant mass spectrum). A Bayesian technique is chosen to represent the limits on new physics models, with Jeffreys priors on the cross section of new physics, and log-normal priors on the nuisance parameters. The dijet and trijet topologies are combined in a final exclusion calculation shown in Figure 5, which shows the 68% and 95% credible intervals for observing a resonance at a given mass with a given cross section times branching ratio. Several theoretical models are also included for comparison.
III Semileptonic Decay Channel
There are two analyses from CMS in the semileptonic decay channel. The first analysis (Reference TOP (2010), with 0.036 fb-1) utilizes standard event reconstruction techniques assuming that the top quark’s decay products are isotropically distributed (i.e. close to production threshold). The events are required to have at least three jets, one well-isolated muon or electron, and significant missing transverse energy. The events are categorized according to the lepton type (muon or electron), the number of jets, and the number of tags in the event, which are then linked by the expected jet energy scale and bottom-quark tagging efficiency. This technique is similar to that in the recent measurement of the top pair production cross section in Reference Chatrchyan et al. (2011b) (recently updated to 1 fb-1 in Reference TOP (2011)).
The candidate is constructed by assigning jets to partons with a sorting method. The combination with the smallest is selected as the best candidate. The top-quark and -boson masses are used in the constraints of the sorting method, and to solve the quadratic ambiguity of the -component of the neutrino’s four-vector.
The backgrounds are primarily taken from Monte Carlo simulations comparably to that described in Reference Chatrchyan et al. (2011b). The non-prompt- backgrounds are taken from data, in sidebands of the missing transverse energy and isolation selection criteria with a two-dimensional extrapolation.
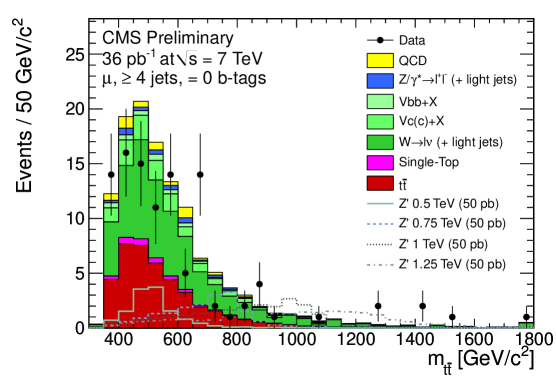
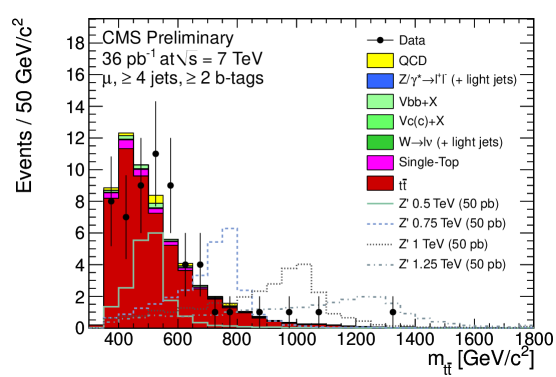
Figures 6 and 7 show the results of the event selection for two of the eight subsamples of the data. Here are shown the muon subsample with at least four jets and exactly zero bottom-quark-tagged jets, and the muon subsample with exactly three jets and at least two bottom-quark-tagged jets. Good agreement between the data and expectation is observed, and hence a limit is set on possible new physics models.
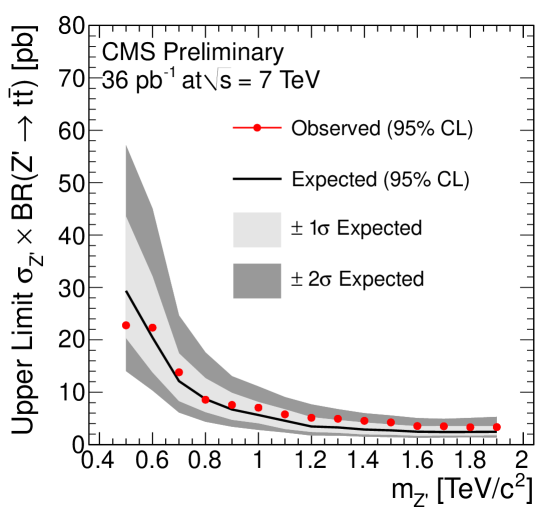
In order to evaluate the statistical limits, a shape analysis is performed on the invariant mass spectrum. A fully Bayesian approach is taken, as in the all-hadronic case. The same prior distributions are chosen as well. Figure 8 shows the limits on the production cross section times branching ratio of a resonance at a given mass. Good agreement with the data is observed.
The second analysis (Reference EXO (2011b), with 1.1 fb-1) assumes a boosted topology and modifies the event selection criteria in order to efficiently reconstruct the top quarks in this regime. The number of required jets must be reduced because there is significant jet merging. The isolation criteria on the muon must also be modified because the boost of the top quark merges the muon with the nearby bottom-quark jet.
Instead of the traditional isolation criterion, a new criterion is applied in this analysis, which selects events with a two-dimensional distribution. The first dimension is the angular separation between the muon and the nearest jet (). The second dimension is the transverse momentum of the leading jet relative to the muon (). Events fail the selection if they have and GeV/c. Furthermore, non-prompt--boson backgrounds are suppressed by requiring that the scalar sum of the lepton transverse momentum and the missing transverse energy () be larger than 150 GeV/c2. The region with smaller than 150 GeV/c2 is used to normalize the residual non-prompt--boson backgrounds.
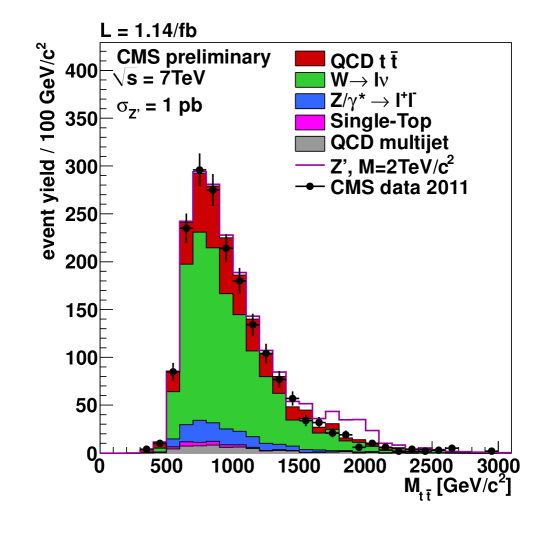
The remaining backgrounds are taken from Monte Carlo as in the case of the first semileptonic analysis. However, in this analysis no bottom-quark-tagging information is used. Figure 9 shows the results of the event selection in this boosted analysis, and Figure 10 shows the 68% and 95% credible intervals for observing a resonance at a given mass with a given cross section times branching ratio. Several theoretical models are also included for comparison. The same mathematical formalism is used as in the first semileptonic analysis.
IV Fully Leptonic Decay Channel
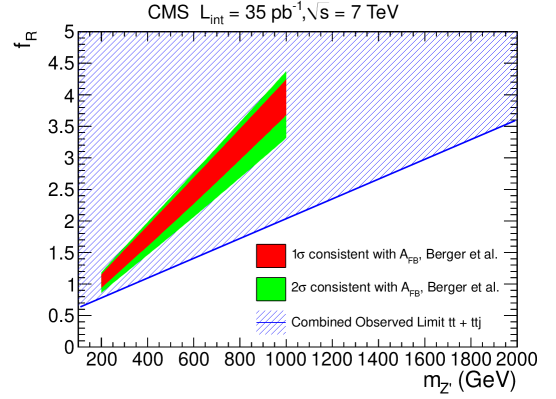
The fully leptonic analysis is a search for anomalous same-sign dilepton events with 0.036 fb-1. It is a reinterpretation of a SUSY search (Reference Chatrchyan et al. (2011c)). This search is reinterpreted as a search in the top sector to examine the hypothesis put forward in Reference Berger et al. (2011) to explain the top forward-backward asymmetry observed at the Tevatron. In that paper, the forward-backward asymmetry of top-pair production is enhanced by the presence of a flavor-changing-neutral-current interaction which can then produce same-sign top events.
To test this model, the analysis in the dilepton channel requires two positive leptons, two or more jets, and missing transverse energy. The analysis is a counting experiment, with 0.9 0.6 events expected from the Standard Model, and 2 events observed. With this data, limits on the FCNC models can be placed based on the mass of the boson and the right-handed coupling ().
Figure 11 shows the 95% confidence level limit on the model, with varied boson masses and right-handed couplings. The model proposed by Reference Berger et al. (2011) is disfavored.
IV.1 Conclusions
In conclusion, new physics in the top sector is being rigorously pursued at CMS with a variety of reconstruction techniques, including recent advances in boosted jet reconstruction. The plausible new physics scenarios to explain the top forward-backward asymmetry anomaly at the Tevatron are beginning to be eliminated, and future studies will help to further elucidate the situation.
References
- Dimopoulos and Georgi (1981) S. Dimopoulos and H. Georgi, Nucl. Phys. B193, 150 (1981).
- Weinberg (1976) S. Weinberg, Phys. Rev. D13, 974 (1976).
- Susskind (1979) L. Susskind, Phys. Rev. D20, 2619 (1979).
- Hill and Parke (1994) C. T. Hill and S. J. Parke, Phys. Rev. D49, 4454 (1994), eprint hep-ph/9312324.
- Chivukula et al. (1999) R. S. Chivukula, B. A. Dobrescu, H. Georgi, and C. T. Hill, Phys. Rev. D59, 075003 (1999), eprint hep-ph/9809470.
- Arkani-Hamed et al. (2001) N. Arkani-Hamed, A. G. Cohen, and H. Georgi, Phys. Lett. B513, 232 (2001), eprint hep-ph/0105239.
- Arkani-Hamed et al. (1998) N. Arkani-Hamed, S. Dimopoulos, and G. R. Dvali, Phys. Lett. B429, 263 (1998), eprint hep-ph/9803315.
- Randall and Sundrum (1999a) L. Randall and R. Sundrum, Phys. Rev. Lett. 83, 3370 (1999a), eprint hep-ph/9905221.
- Randall and Sundrum (1999b) L. Randall and R. Sundrum, Phys. Rev. Lett. 83, 4690 (1999b), eprint hep-th/9906064.
- Agashe et al. (2008) K. Agashe, A. Belyaev, T. Krupovnickas, G. Perez, and J. Virzi, Phys. Rev. D77, 015003 (2008), eprint hep-ph/0612015.
- Aaltonen et al. (2008a) T. Aaltonen et al. (CDF), Phys. Rev. Lett. 101, 202001 (2008a), eprint 0806.2472.
- Abazov et al. (2008) V. M. Abazov et al. (D0), Phys. Rev. Lett. 100, 142002 (2008), eprint 0712.0851.
- Aaltonen et al. (2011) T. Aaltonen et al. (CDF), Phys. Rev. D83, 112003 (2011), eprint 1101.0034.
- top (2010) D0 Note 6062-CONF (2010).
- top (2011) CDF Note 10436 (2011).
- Delaunay et al. (2011) C. Delaunay, O. Gedalia, Y. Hochberg, G. Perez, and Y. Soreq, JHEP 1108, 031 (2011), eprint 1103.2297.
- Aaltonen et al. (2008b) T. Aaltonen et al. (CDF), Phys. Rev. D77, 051102 (2008b), eprint 0710.5335.
- Aaltonen et al. (2008c) T. Aaltonen et al. (CDF), Phys. Rev. Lett. 100, 231801 (2008c), eprint 0709.0705.
- d0t (2009) D0 Note 5882-CONF (2009).
- EXO (2011a) CMS PAS EXO-11-006 (2011a), URL http://cdsweb.cern.ch/record/1370237/.
- TOP (2010) CMS PAS TOP-10-007 (2010), URL http://cdsweb.cern.ch/record/1335720.
- EXO (2011b) CMS PAS EXO-11-055 (2011b), URL http://cdsweb.cern.ch/record/1376673/.
- Chatrchyan et al. (2011a) S. Chatrchyan et al. (CMS Collaboration), JHEP 1108, 005 (2011a), * Temporary entry *, eprint 1106.2142.
- Kaplan et al. (2008) D. E. Kaplan, K. Rehermann, M. D. Schwartz, and B. Tweedie, Phys. Rev. Lett. 101, 142001 (2008), eprint 0806.0848.
- cat (2009) CMS PAS JME-009-01 (2009), URL http://cdsweb.cern.ch/record/1194489.
- Ellis et al. (2008) S. D. Ellis, J. Huston, K. Hatakeyama, P. Loch, and M. Tonnesmann, Prog. Part. Nucl. Phys. 60, 484 (2008), eprint 0712.2447.
- Ellis et al. (2009) S. D. Ellis, C. K. Vermilion, and J. R. Walsh, Phys.Rev. D80, 051501 (2009), eprint 0903.5081.
- Ellis et al. (2010) S. D. Ellis, C. K. Vermilion, and J. R. Walsh, Phys.Rev. D81, 094023 (2010), eprint 0912.0033.
- Abdesselam et al. (2011) A. Abdesselam, E. Kuutmann, U. Bitenc, G. Brooijmans, J. Butterworth, et al., Eur.Phys.J. C71, 1661 (2011), eprint 1012.5412.
- Harris et al. (1999) R. M. Harris, C. T. Hill, and S. J. Parke (1999), eprint hep-ph/9911288.
- Chatrchyan et al. (2011b) S. Chatrchyan et al. (CMS Collaboration) (2011b), eprint 1108.3773.
- TOP (2011) CMS PAS TOP-11-003 (2011).
- Chatrchyan et al. (2011c) S. Chatrchyan et al. (CMS Collaboration), JHEP 1106, 077 (2011c), eprint 1104.3168.
- Berger et al. (2011) E. L. Berger, Q.-H. Cao, C.-R. Chen, C. S. Li, and H. Zhang, Phys.Rev.Lett. 106, 201801 (2011), eprint 1101.5625.