Performance of the MAGIC Stereo System
Abstract
MAGIC is a system of two Imaging Atmospheric Cherenkov Telescopes sensitive above 60 GeV, and located on the Canary Island of La Palma at the height of 2200 m.a.s.l. Since Autumn 2009 both telescopes are working together in stereoscopic mode. We use both Crab Nebula observations and Monte Carlo simulations to evaluate the performance of the system. Advanced stereo analysis allows MAGIC to achieve a sensitivity better than 0.8% of the Crab Nebula flux in 50 h of observations in the medium energy range (around a few hundred GeV). At those energies the angular resolution is better than 0.07∘, and the energy resolution is as good as 16%. We perform also a detailed study of possible systematics effects for the MAGIC telescopes.
1 The MAGIC Telescopes
The MAGIC experiment is located at a height of 2200 m.a.s.l. on the Canary island of La Palma. The system is composed of two 17 m Imaging Atmospheric Cherenkov Telescopes (IACTs) devoted to the observation of very high energy (VHE, 30 GeV) gamma rays. The first of the MAGIC telescopes (MAGIC I) started operations in 2004. MAGIC II was built some years later allowing stereo observations since the autumn of 2009.
MAGIC II was constructed like a copy of MAGIC I with a few improvements. Both telescopes are built using the same light-weight carbon-fibre structure. The size of the mirror dish (17 m diameter) and the camera field of view (3.5∘) are the same in both telescopes. The main difference between the telescopes are their cameras. MAGIC I camera is composed of 577 hexagonal pixels with an angular size of in the inner part of the camera and in the outer part. On the contrary, the MAGIC II camera is composed of 1039 hexagonal pixels.
In both telescopes the signals from the PMTs in each pixel are optically transmitted to the counting house where trigger and digitisation of the signals take place. The trigger area of the MAGIC II camera has a radius of . This is an improvement with respect to MAGIC I that has a radius of only . The signals of both telescopes are digitised using a frequency of 2 GSamples/s. In the case of MAGIC I a system based on multiplexed FADCs is used [1]. For MAGIC II the readout system is based on the Domino Ring Sampler 2 (DRS2) chip [2].
Regular observations are performed in stereoscopic mode. Only events that trigger both telescopes are recorded. The trigger condition for the individual telescope is the so-called 3NN trigger. Each telescope must have 3 pixels above their pixel threshold (level-0 trigger) in a next-neighbour (NN) topology in order to be a telescope trigger (level-1 trigger). The stereo trigger makes a tight time coincidence between both telescopes taking into account the delay due to the relative position of the telescopes and their pointing direction. Although the individual telescope trigger rates are high (several kHz), the stereo trigger rate is in the range of 150-200 Hz with just a few Hz being accidental triggers.
2 Data Sample
In order to study the performance of the MAGIC telescopes, we have used a sample of Crab Nebula data. The Crab Nebula is considered the standard candle for VHE gamma-ray astronomy since it is the brightest steady, point-like VHE source in the sky. Although the source seems to be variable in the GeV energy range (ATel #2855, [3], [4]) neither MAGIC nor VERITAS (ATel #2967, ATel #2968) have observed variability in the VHE flux [5].
The data used in this study was taken between November 2009 and January 2010. After data quality selection, 9 hours of good quality data were used. These data were taken at low zenith angle () in wobble mode [6] with the source located at a distance of from the camera centre. The position of the source in the camera is rotated around the camera centre every 20 minutes to decrease the systematic errors that could come from camera inhomogeneities.
The performance of the MAGIC system have also been studied using Monte Carlo (MC) data. MC gamma rays with an energy range from 30 GeV to 30 TeV have been used to study the response of MAGIC to signal events. In addition, MC protons (30 GeV to 30 TeV), helium (70 GeV to 20 TeV), and electrons (70 GeV to 7 TeV) where used to compare the cosmic background rates in data with MC predictions.
3 Stereo Analysis
The data analysis is done using the MAGIC standard analysis framework (MARS) [7]. The first steps in the stereo data analysis are done independently for each telescope (calibration, image cleaning, image parametrisation), as described in [8][9]. After the relevant parameters of each image are obtained, the stereo analysis is applied, combining the information obtained from both telescopes. A summary of the recent advancements introduced in the stereoscopic analysis can be found in [10]. The new stereo parameters Impact (reconstructed distance from each telescope to the shower axis in the plane perpendicular to the shower axis) and MaxHeight (reconstructed height of the shower maximum above the telescopes) are introduced in the data analysis. The stereoscopic observations allow us to easily obtain these geometrical parameters that improve the energy reconstruction (mainly due to the Impact parameter) and increase the background rejection (mainly due to the MaxHeight parameter). At low energies, background rejection is significantly enhanced by the MaxHeight because a large fraction of background events are reconstructed with MaxHeight below 4 km above the telescopes. These are muon events that now can be efficiently rejected with the stereo system.
The reconstructed direction of the primary particle is another parameter that can be obtained geometrically in stereo events. The crossing point of the main axes of the ellipses that the event forms in each camera gives the direction of the incoming primary particle [11]. In MAGIC, however, we combine this information with the timing information to improve the angular resolution. For each individual image, the DISP parameter (distance from the shower image centre to the estimated source position) is estimated using the multidimensional classification method Random Forest [12] (RF). We call this method DISP-RF and it is applied to the images of each telescope. Later, the geometrical information from the axes crossing point plus the two estimations from the DISP-RF method are combined to provide a unique source position estimation or to reject the event if the individual positions do not agree, which provides additional background rejection (more details are given in [10] [13]).
The RF method is also used for gamma-hadron separation in the stereo data. In this case, the information from some selected individual telescope parameters like Size (sum of charge in all pixels surviving the image cleaning), Width (angular distance along the minor axis of the image ellipse in the camera) or Length (angular distance along the major axis of the image ellipse) are combined with the stereo parameters and timing information. The result of this process is a single parameter called Hadronness which is distributed between 0 (gamma-like event) and 1 (hadron-like event) and it is used in the analysis to select the gamma-like events. The parameters used to build Hadronness are source-independent, so Hadronness is not biased by the position of the source in the camera.
Finally the energy of the events is reconstructed using lookup tables where the size of the image, Impact and MaxHeight are used to obtain an energy estimation of the event with the parameters from each telescope (more details are given in [13]). A weighted mean is calculated with the energy estimation from each telescope to produce the estimated energy of the event. The tables are filled with the information of MC gamma rays with the same zenith angle as the data being analysed.
4 Performance of the MAGIC Stereo System
The energy threshold of the MAGIC stereo system (defined as the peak of the distribution of gamma-ray events after trigger) has been estimated as 50 GeV for a differential spectral index of -2.6. For the measured Crab Nebula spectrum the threshold is 60 GeV (see [13] for more details). After image cleaning, the rate of cosmic ray events obtained from MC simulations at low sizes agrees with data within 20%. It shows a larger discrepancy at higher energies that could come from systematic errors in both the measurement by BESS [14], which the MC is normalised with, and/or MAGIC as well as the limited acceptance of the MC simulations.
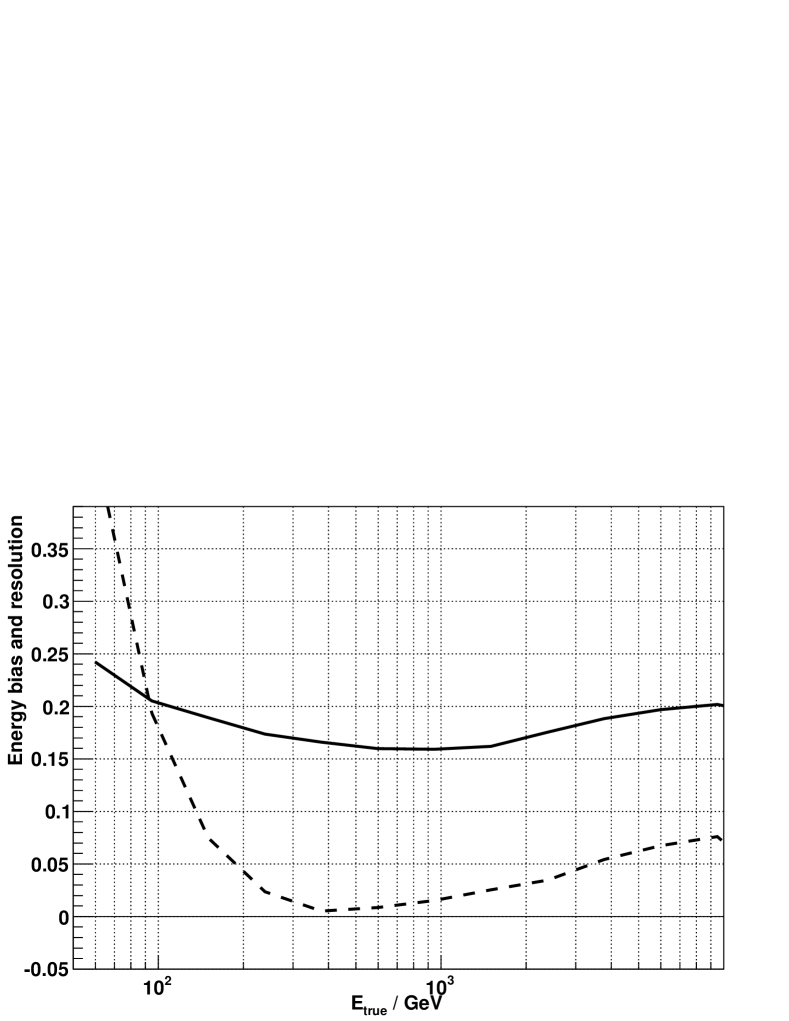
The energy resolution and energy bias obtained with the MAGIC stereo system are shown in Figure 1. The best value reached is 16% at a few hundred GeV. At higher energies it is slightly worse due to limited statistics and events being truncated at the edge of the camera.
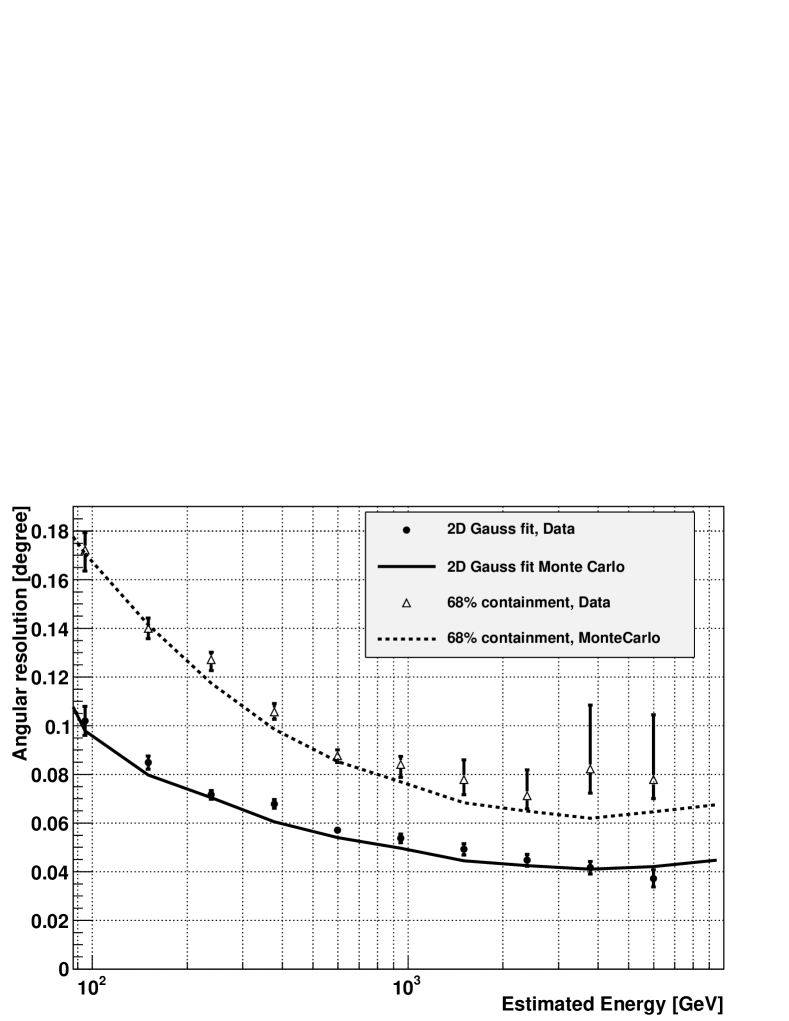
The angular resolution obtained from data events and MC simulations is shown in Figure 2. With the use of DISP-RF, an angular resolution of 0.07∘ is reached at 300 GeV. MC simulations agree well with the data and only a small discrepancy is seen at high energies coming from small imperfections not included in MC simulations that is visible when the angular resolution is very small.
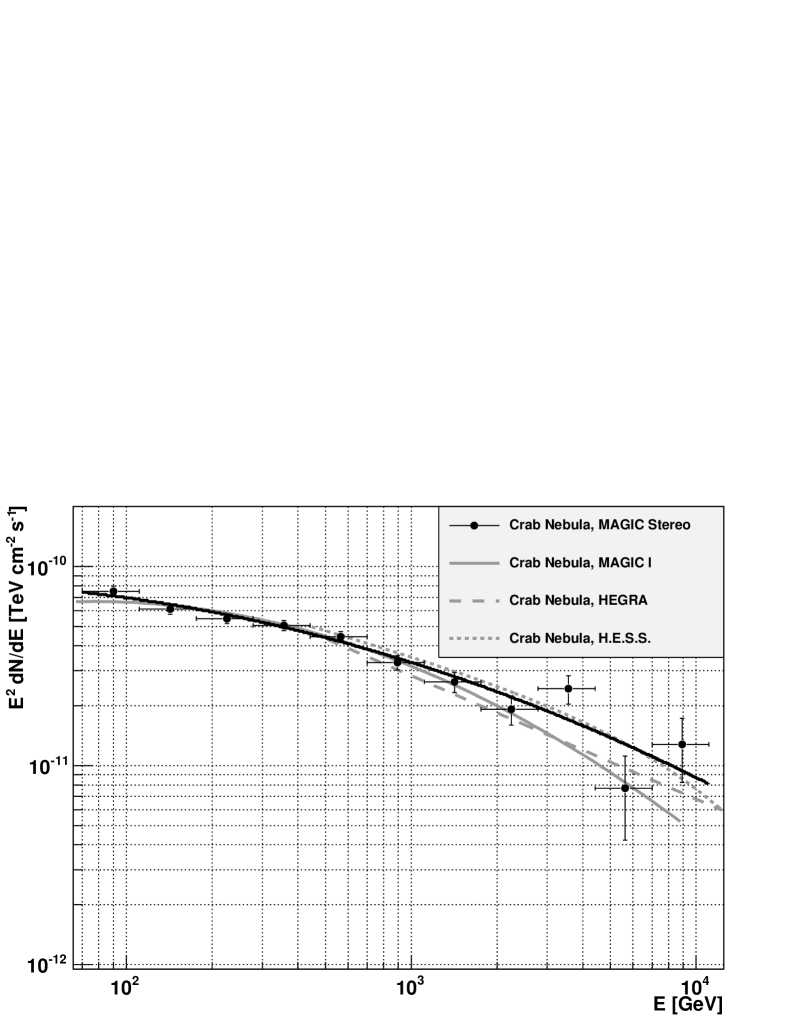
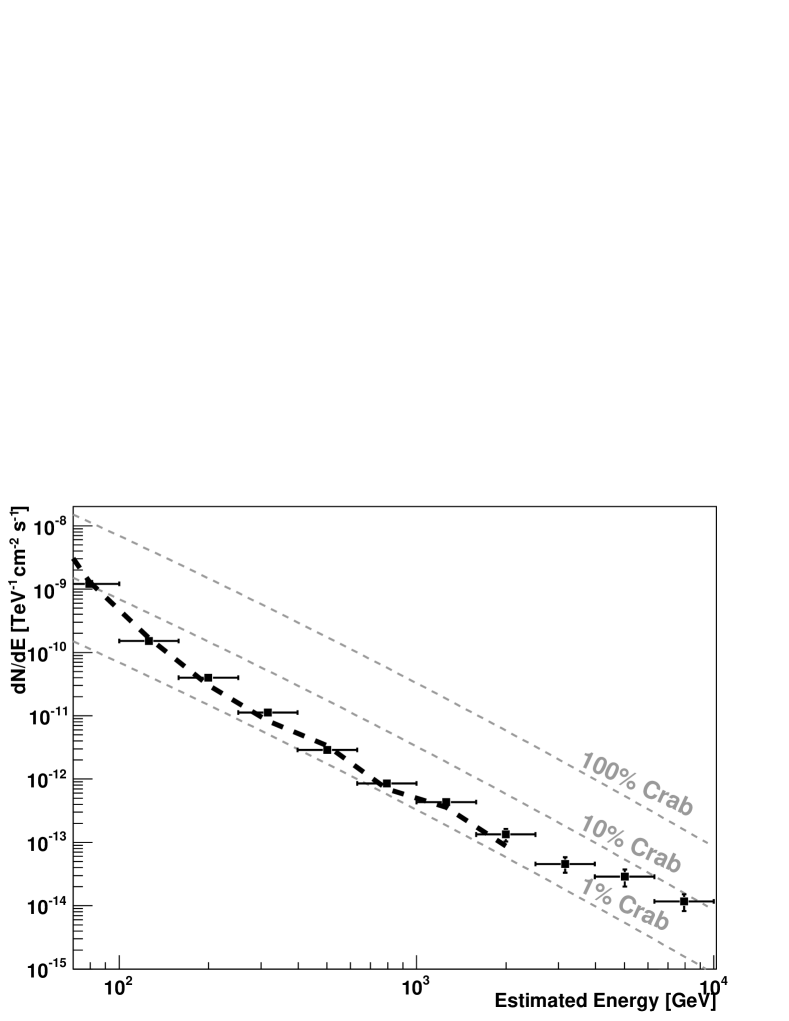
The SED obtained from the Crab Nebula data sample is shown in Figure 3. In the energy range 70 GeV-11 TeV the Crab Nebula spectrum can be fitted by:
where , , and . A detailed study of the Crab Nebula is presented in [15].
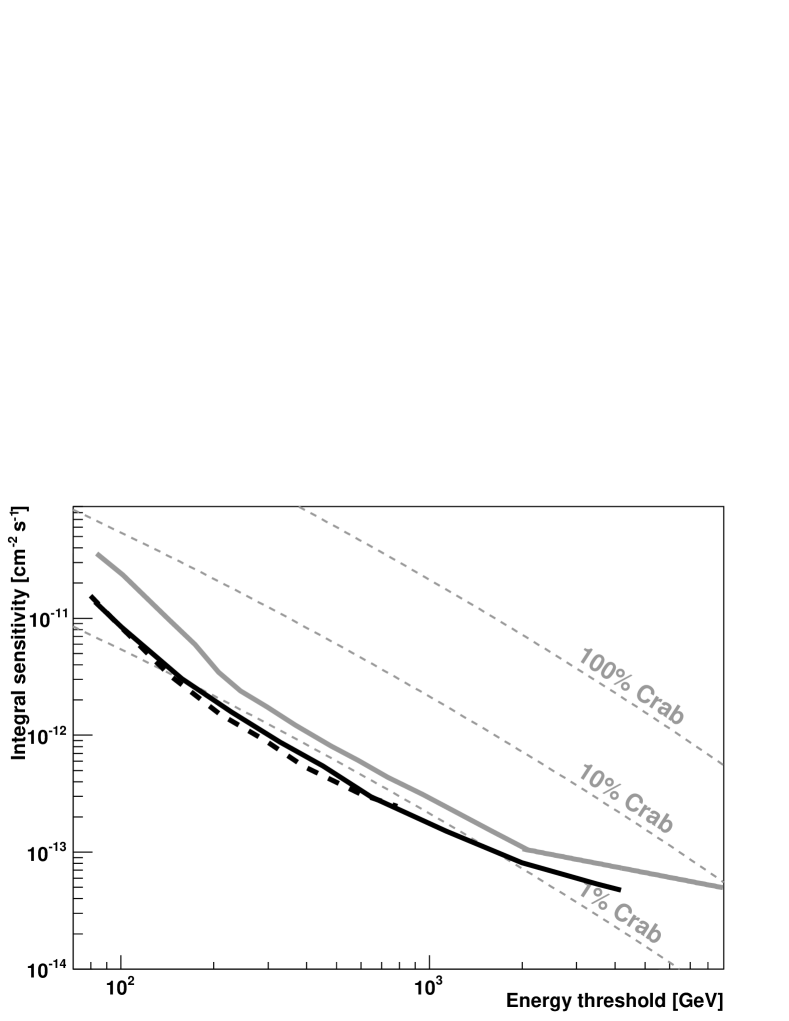
The integral sensitivity of the instrument as a function of the energy is shown in Figure 4, while the differential sensitivity is shown in Figure 5. In both cases there is a good agreement between the sensitivity estimations from MC and the actual sensitivity reached with the Crab data sample. The second telescope and the use of stereo data analysis provide a significant sensitivity improvement in comparison to MAGIC I alone. A factor 2 improvement in significance is achieved at a few hundred GeV and up to a factor 3 at lower energies. Values for the integral sensitivity reached by MAGIC for a Crab Nebula spectrum as a function of the threshold energy can be found in table 1.
| [GeV] | [%C.U.] | [%C.U.] | [%C.U.] | [%C.U.] | [ ] |
|---|---|---|---|---|---|
| 82.5 | |||||
| 100 | |||||
| 158 | |||||
| 229 | |||||
| 328 | |||||
| 452 | |||||
| 646 | |||||
| 1130 | |||||
| 2000 | |||||
| 2730 | |||||
| 3490 | |||||
| 4180 |
Finally, the sensitivity for a source located at different distances from the camera centre has also been investigated. Dedicated observations of the Crab Nebula were carried out with the source located at different offset angles between 0.2∘ and 1.4∘. The results show that the integral sensitivity obtained above 290 GeV for Crab is almost constant up to an offset angle of . For higher distances from the camera centre, the sensitivity degrades significantly. For a source located at 1∘ from the camera centre, the integral sensitivity above 290 GeV degrades by a factor 2.
5 Systematic Uncertainties
We have also performed a study of the uncertainties that contribute to the systematic errors of MAGIC. Different aspects of the imaging air Cherenkov technique have been considered to estimate their effect on the absolute energy scale, the gamma-ray efficiency and the reconstructed spectra. The list of elements contributing to the final systematic errors is long and the details will be available in [13]. The overall effect is estimated to be an uncertainty in the energy scale of 17% at low energies and of 15% at medium energies. The systematic error on the slope of the measured Crab spectrum is estimated to be 0.15, much higher than the statistical error of the analysed data sample. The additional error on the flux normalisation is estimated to be 19% at low energies and 11% at medium energies. These errors are in agreement with the differences in the range of 20-30% observed between the MAGIC Crab Nebula spectrum and the spectra measured by other experiments.
References
- [1] Goebel, F., et al., 30th ICRC proceeding, Merida, 2007
- [2] Tescaro, D. et al., 31st ICRC proceeding, Lodz, 2009
- [3] Tavani, M., et al. 2011, Science, 331, 736
- [4] Abdo, A. A., et al. 2011, Science, 331, 739
- [5] Zanin, R. et al., these proceedings
- [6] Fomin, V. P., et al. 1994, Astropart. Phys., 2, 137
- [7] Moralejo A. et al., 31st ICRC proceeding, Lodz, 2009
- [8] Albert, J., et al. 2008b, ApJ, 674, 1037
- [9] Aliu, E., et al. 2009, Astropart. Phys., 30, 293
- [10] S. Lombardi, K. Berger, P. Colin, A.-D. Ortega, S. Klepser et al., these proceedings
- [11] Aharonian, F. A., Hofmann, W., Konopelko, A. K., Völk, H. J. 1997, Astropart. Phys., 6, 343
- [12] Albert, J., et al. 2008c, NIM A, 588, 424
- [13] Aleksić, J., et al. Performance of the MAGIC Stereo system obtained with the Crab Nebula data, 2011, In preparation
- [14] Yamamoto, A., et al. 2007, Nucl. Phys. B Proc. Sup., 166, 62
- [15] R. Zanin, et al., these proceedings
- [16] Aharonian, F., et al. 2004, ApJ, 614, 897
- [17] Aharonian, F., et al. 2006, A&A, 457, 899