Polarization properties of OH masers in AGB and post-AGB stars ††thanks: Appendices (Table A.1) and (Figure B.1) are only available in the electronic edition of the journal at http://www.aanda.org
Abstract
Context. Ground-state OH maser emission from late-type stars is usually polarized and remains a powerful probe of the magnetic field structure in the outer regions of circumstellar envelopes if observed with high angular and spectral resolutions. Observations in all four Stokes parameters are quite sparse and this is the most thorough, systematic study published to date.
Aims. We aim to determine polarization properties of OH masers in an extensive sample of stars that show copious mass loss and search for candidate objects that are well-suited for high angular resolution studies.
Methods. Full-polarization observations of the OH 1612 and 1667 MHz maser transitions were carried out for a sample of 117 AGB and post-AGB stars. Several targets were also observed in the 1665 MHz line.
Results. A complete set of full-polarization spectra together with the basic polarization parameters are presented. Polarized features occur in more than 75% of the sources in the complete sample and there is no intrinsic difference in the occurrence of polarized emission between the three classes of objects of different infrared characteristics. The highest fractional polarization occurs for the post-AGB+PN and the Mira+SR classes at 1612 and 1667 MHz, respectively. Differences in the fractional polarization between the sources at different evolutionary stages appear to be related to depolarization caused by blending. The alignment of the polarization angles at the extreme sides of the shell implies a regular structure of the magnetic field of a strength of 0.3-2.3 mG.
Conclusions. Polarized OH maser features are widespread in AGB and post-AGB stars. The relationship between the circular and linear fractional polarizations for a representative sample are consistent with the standard models of polarization for the Zeeman splitting higher than the Doppler line width, whereas the polarized features are the components.
Key Words.:
masers polarization circumstellar matter stars: AGB and post-AGB1 Introduction
The ground-state OH maser lines at 1612, 1665 and 1667 MHz are frequently detected in late-type stars that show mass loss at high rates. A recent compilation by Engels & Bunzel (engels08 (2008)) gives 2297 circumstellar masers of which 1945 show the classical double-peak profile at 1612 MHz. The polarization information is not available or neglected in the interferometric surveys of the Galactic plane (Sevenster et al. 1997a ; 1997b ; sevenster01 (2001)) in numerous single-dish studies of IRAS colour-selected objects (e.g. Eder et al. eder88 (1988); Le Squeren et al. lesqueren91 (1991); te Lintel Hekkert et al. telintel91 (1991)) and in earlier blind surveys (e.g. Bowers bowers78 (1978); Baud et al. 1979a ; 1979b ). Earlier studies (e.g. Wilson et al. wilson70 (1970); Wilson & Barrett wilson72 (1972)) suggested that the 1612 MHz circumstellar emission is essentially unpolarized but the observations with a spectral resolution better than 0.1 km s-1 revealed several circularly polarized features (Cohen et al. cohen87 (1987); Zell & Fix zell91 (1991)). The OH emission in the 1665 and 1667 MHz lines shows a substantial degree of circular polarization up to 5080% (Wilson et al. wilsonetal72 (1972); Claussen & Fix claussen82 (1982)) but linear polarization occurs in only 10% of sources (Olnon et al. olnon80 (1980)). Highly polarized OH maser features are observed in flaring Miras (Reid et al. reid77 (1977); Fix fix79 (1979); Etoka & Le Squeren etoka97 (1997)), hypergiant IRC+10420 (Benson et al. benson79 (1979)) and post-AGB star OH17.7-2.0 (Szymczak & Gérard szymczak05 (2005)). There is a general consensus that the polarization measurements of OH maser emission can be properly explained with the classic model of Goldreich et al. (goldreich73 (1973)) in which the magnetic field plays a key role (e.g. Gray & Field gray95 (1996); Elitzur elitzur96 (1996)).
The presence of circular polarization is itself evidence for Zeeman splitting (Deguchi & Watson deguchi86 (1986)) and, despite the difficulties in identifying classical Zeeman patterns, provides a direct estimate of the strength and direction of the magnetic field. From observations of the linear polarization we can draw conclusions about the orientation of the circumstellar magnetic field.
For some OH stellar sources, high-sensitivity observations with 0.1 km s-1 spectral resolution have shown an amount of circularly and linearly polarized features large enough to measure the strength of circumstellar magnetic fields and to map their structure with high accuracy using the interferometric technique (e.g. Chapman & Cohen chapman86 (1986); Szymczak et al. szymczak98 (1998, 2001); Bains et al. bains03 (2003); Amiri et al. amiri10 (2010)). These case studies revealed the presence of highly ordered magnetic fields of a strength of a few mG at distances of a few thousands stellar radii. Full-polarization measurements of OH circumstellar masers with high sensitivity and spectral resolution are scarce. A small sample of Miras (Claussen & Fix claussen82 (1982)) and a moderate sample of proto-planetary nebula candidates (Szymczak & Gérard szymczak04 (2004)) only were studied up to date and no comprehensive picture of the polarization properties of circumstellar OH masers was obtained. We hereby extend those studies for a sample containing oxygen-rich objects that evenly populate the whole evolutionary sequence in the IRAS two-colour diagram (van der Veen & Habing vanderveen88 (1988)). There is evidence that the IRAS colours increase through the sequence from the semi-regular variables (SRs), long period variables of Mira types, OH/IR objects, proto-planetary nebulae (PPN) and planetary nebulae (PN). The colours probably reflect the evolution of the circumstellar shell from optically thin to optically thick and the location of an object in the diagram could be also related to the age, initial mass and possibly metallicity (e.g. Bedijn bedijn87 (1987); van der Veen & Habing vanderveen88 (1988); Likkel likkel89 (1989)). The observations of a representative sample reported here attempt to examine whether the OH maser polarization depends on the properties of the central star and its envelope or whether it is caused by propagation effects.
2 Data
2.1 The sample
The initial source list consisted of 152 late-type stars at ° of which 147 objects were taken from Benson et al.’s catalogue (benson90 (1990)), the rest from te Lintel Hekkert et al.’s survey (telintel91 (1991)). Several sources were discarded after the initial test observations because their total peak fluxes were lower than 0.15 Jy at both frequencies. The final sample consisted of 117 stellar OH sources that clearly exhibit either the 1612 MHz satellite line or/and the 1665/1667 MHz main lines. Targets with different infrared characteristics were chosen to probe the whole evolutionary sequence of oxygen-rich objects in the IRAS two-colour diagram (van der Veen & Habing vanderveen88 (1988)). The location of an object in this diagram depends on the circumstellar envelope thickness, age and initial mass. It is assumed that the visible semi-regular and Mira variables with relatively thin envelopes evolve towards OH/IR objects with thick envelopes, and when their pulsations cease, they leave the tip of the asymptotic giant branch and become post-AGB objects and eventually young planetary nebulae (Habing habing96 (1996), for review). Alternatively, OH/IR stars have higher progenitor masses than Miras (Likkel likkel89 (1989)) and may come from an intrinsically more massive population (Whitelock et al. whitelock94 (1994)). These categories of objects differ in pulsational and mass-loss properties and can be accompanied by OH maser emission.
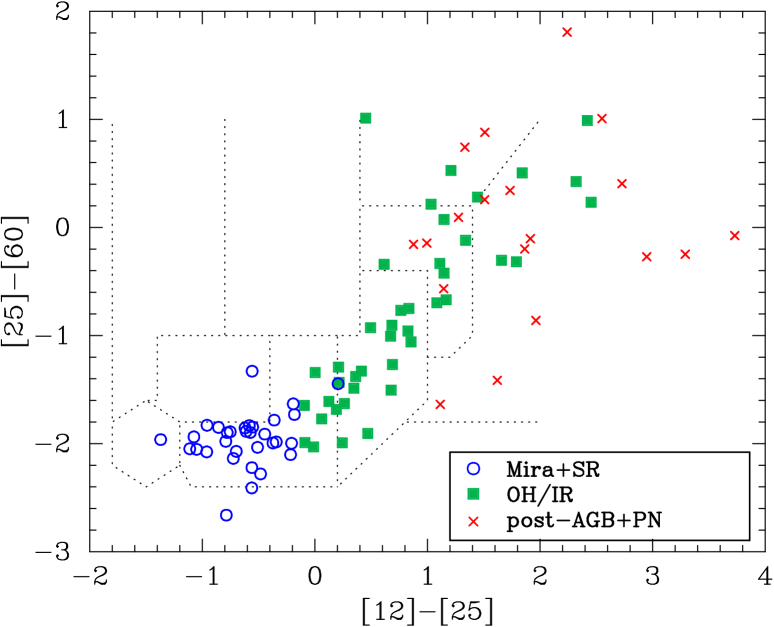
There are 36 SRs and Miras, 57 OH/IR objects and 24 post-AGB and PN candidates in the sample (Table A.1). We are concerned here only with these three groups of objects. Note that the latter group was included in a sample studied by Szymczak & Gérard (szymczak04 (2004)) but the spectra used there were generally taken at other epochs. One hundred and five out of 117 targets have good flux quality at the 12, 25 and 60m IRAS bands, and we show their two-colour diagram in Figure 1. The colour is defined as log(S()/S()), where S() is the uncorrected flux in the IRAS band. The colours of OH/IR and post-AGB objects overlap, partly because of inaccurate classification criteria of the transition objects between AGB and post-AGB phases. Figure 1 shows that our targets sample all types of oxygen-rich stars with a circumstellar envelope associated with OH maser emission. The sample is therefore appropriate to properly address whether the polarization parameters of OH masers depend on the characteristics of the central stars/envelopes or are dominated by propagation effects.
A comparison of the 1612 MHz peak flux density for 105 detected sources in the sample with that for 808 objects in the te Lintel Hekkert et al. (telintel91 (1991)) catalogue indicates that our sample probes the brightest sources; the median values are 8.32 and 0.86 Jy, respectively (Table 1). We note, however, that the older observations may underestimate the peak flux because of frequency dilution.
2.2 The observations
The data were obtained with the Nançay Radio Telescope (NRT) during several runs between February 2002 and December 2008. This transit instrument is the equivalent of a dish of 93 m in diameter and the half-power beam-width is (RA)(Dec) at 1.6 GHz. At Dec = 0°, the beam efficiency is 0.65 and the point-source efficiency is 1.4 K Jy-1, the system temperature is about 35 K. More technical details on the radio telescope and its upgrade are given in van Driel et al. (vandriel96 (1996)).
Initially, we observed 152 sources in the 1612.231 and 1667.359 MHz OH lines, 38 of which were also observed at 1665.402 MHz (including 31 sources that were not detected at 1612.231 MHz). We used a correlator configuration providing eight banks of 1024 channels. To cover all OH maser profiles easily, we used two spectral resolutions, 0.14 km s-1 for about two thirds of the targets and 0.07 km s-1 for the rest.
Two transitions were simultaneously observed and we registered the two orthogonal linear polarizations and two opposite circular polarizations for each transition. The system directly provided three of the four Stokes parameters, namely I, Q and V, while the fourth parameter U was extracted by a horn rotation of 45°. The linearly polarized flux density, , fractional linear polarization, , fractional circular polarization, and polarization position angle, tan, were derived from the Stokes parameters. The methods of observation, polarization calibrations, data reduction and estimation of uncertainties on the Stokes parameters were the same as described in Szymczak & Gérard (szymczak04 (2004), Sect. 2). Briefly, we observed in frequency switching mode, using a noise diode to measure the gain of each polarization bank at the start of each scan. The absolute and relative accuracies of gain were 5% and 1%, respectively. The instrumental polarization was regularly checked with observations of W12 and W3OH and the absolute flux density scale was accurate to within 78%. The error in the polarized intensity caused by the polarization leakage between the orthogonal feeds was about 2%. The typical integration time for each horn position was about 20 min. This resulted in a rms noise level in the Stokes of about 35 mJy for 0.14 km s-1 spectral resolution. The median 3 rms noise levels of the Stokes and spectra were 0.15 Jy. In those features that showed polarization, the polarization was only considered believable if either or both of the linearly or circularly polarized fluxes were higher than 0.15 Jy.
The data for our sample have been collected over nearly seven years. Each target was observed at least three times on an irregular basis but there are several sources that were observed over a 37 years period so that the light curves could be easily obtained. Here we only report data for the epoch during which the maximum flux density occurred. Results of the whole long-term observations will be published in a separate paper.
3 Results and analysis
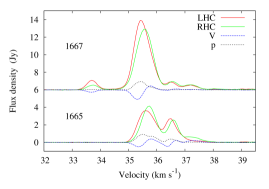
Table A.1 contains a list of the 117 detected sources and their polarization parameters. Full-polarization spectra are shown in Figure B.1.
3.1 Effect of spectral resolution
We tested whether the fractional polarization decreases as the spectral resolution is degraded by observing a few targets at both spectral resolutions. For the two sources OH17.72.0 and OH138.07.2 the maximum values of and at 1612 and 1667 MHz decreased by less than 0.2% and 0.5%, respectively, when the resolution was lowered from 0.07 to 0.14 km s-1. Additionally, the 1612 and 1667 MHz spectra of 0.07 km s-1 resolution with detected polarized features were smoothed to a resolution of 0.14 km s-1. The average and median values of the fractional polarizations for the strongest features before and after the smoothing are given in Table 2. No significant difference in the fractional polarizations is found for both observed lines. These two tests clearly indicate that our data taken with the two different spectral resolutions can be treated together in the subsequent analysis.
| sample | number | frequency | mean(SDa) | median |
|---|---|---|---|---|
| of sources | (MHz) | (Jy) | (Jy) | |
| this paper | 105 | 1612 | 31.70 (8.12) | 8.32 |
| 85 | 1667 | 3.59 (0.74) | 1.21 | |
| te Lintel Hekkert | 808 | 1612 | 4.37 (0.84) | 0.86 |
| Line | Fractional | Number | Mean(SD)o | Mediano | Mean(SD)s | Medians |
|---|---|---|---|---|---|---|
| (MHz) | polzn. | of sources | (%) | (%) | (%) | (%) |
| 1612 | 11 | 7.5(1.8) | 5.8 | 8.2(2.3) | 5.5 | |
| 12 | 4.5(0.6) | 4.0 | 4.2(0.6) | 3.9 | ||
| 1667 | 12 | 27.0(9.4) | 10.1 | 27.0(9.0) | 10.2 | |
| 6 | 7.1(2.6) | 4.2 | 7.5(2.6) | 5.6 |
Spectral resolution: 0.07 km s-1; 0.14 km s-1
| Line | Number of | Number of sources with features | ||
|---|---|---|---|---|
| (MHz) | detection | elliptical | circular | linear |
| 1612 only | 32 | 10 | 4 | 3 |
| 1667 only | 12 | 3 | 7 | 0 |
| 1612/1667 | 73 | 52 | 16 | 7 |
| 1667/1612 | 73 | 15 | 8 | 4 |
| total | ||||
| 1612 | 105 | 58 | 20 | 10 |
| 1667 | 85 | 18 | 15 | 4 |
3.2 Occurrence of polarized emission
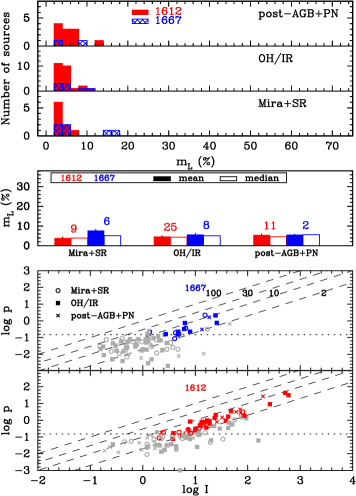
The detection of polarization is limited by the noise level of 0.15 Jy in any Stokes parameter and the minimum believable fractional polarization of 2%. Thus, our sample is complete for objects that are higher than 2% polarized and whose total intensity exceeds 7.5 Jy. The weaker sources only have detectable polarization if they are more strongly polarized. Table 3 summarizes the detection statistics for elliptical, circular and linear polarizations towards the sources divided into three groups depending on the occurrence of the 1612 MHz or/and 1667 MHz lines. Column 2 gives the number of detected sources and columns 3-5 list the number of sources with features of given types of polarization. The emission at 1612 and 1667 MHz was detected in 105 and 85 targets, respectively. Polarized features were detected in 75% (79/105) and 46% (39/85) of the sources at 1612 MHz and 1667 MHz, respectively. This is because the 1612 MHz emission is generally stronger than the 1667 MHz emission. The study indicates that elliptical polarization dominates at 1612 MHz. There is also a high detection rate of linearly polarized emission ( 58% at 1612 MHz and 26% at 1667 MHz) in the sample, never reported previously (Cohen cohen89 (1989), for review). Surprisingly, we detected 14 sources with linearly polarized features without apparent circular polarization (see Sect.3.5).
3.3 Fractional polarization
The polarization properties of maser spectra are commonly determined relative to the peak flux density of Stokes parameter. However, we found that the velocities of the Stokes peak do not coincide with those of the Stokes and peaks for 62% and 65% of the sources, respectively.
The median velocity differences between the peaks of Stokes and Stokes and are 0.14 and 0.27 km s-1, respectively. Generally, the most strongly polarized features coincide with the Stokes peaks within 2-3 spectral channels. However, for a few sources these velocity differences are as large as 5.2 km s-1 in IRAS191140002, 1.7 km s-1 in OH12.81.9 and 0.9 km s-1 in RR Aql, then the and peaks are distinct features. Velocity separations could be caused by Zeeman splitting (see Sect. 3.6). Blending of differently polarized components along the line of sight would also cause depolarization relative to the total intensity. In the following sections, we perform separate statistical analyses for the fractional polarization at the Stokes , Stokes and peaks. We compare the results for the three classes of objects defined in Table A.1.
3.3.1 Measurements relative to the Stokes peak
| Class | Line | number | (%) | number | (%) | ||
|---|---|---|---|---|---|---|---|
| (MHz) | of sources | mean (SD) | median | of sources | mean (SD) | median | |
| Mira+SR | 1612 | 9 | 8.70(1.14) | 4.62 | 9 | 3.89(0.66) | 3.89 |
| 1667 | 14 | 24.98(4.95) | 10.13 | 6 | 7.70(0.66) | 5.14 | |
| OH/IR | 1612 | 33 | 5.81(0.48) | 4.28 | 25 | 4.70(0.29) | 4.34 |
| 1667 | 11 | 8.28(1.36) | 4.55 | 8 | 5.71(0.59) | 5.05 | |
| post-AGB+PN | 1612 | 10 | 24.71(1.17) | 14.14 | 11 | 5.50(0.44) | 4.52 |
| 1667 | 3 | 11.30(0.82) | 3.87 | 2 | 5.60(0.24) | 5.60 | |
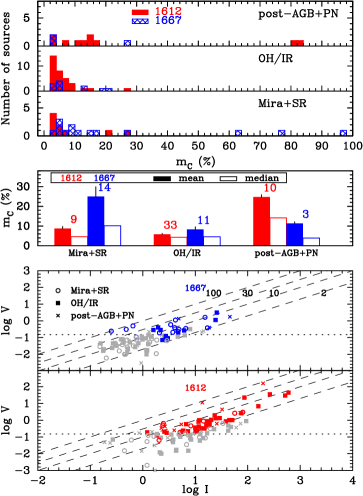
Figure 2 summarizes the polarization properties of OH emission for the three classes of objects in the sample, and Table 4 gives the mean and median values of circular and linear fractional polarization. The fractional circular polarization in the OH sources is commonly lower than 20% and is as high as 60100% in a few objects. In contrast, the fractional linear polarization is usually lower than 10% and reaches a slightly higher value in a few sources. The differences in the fractional polarization distributions between the three classes and the two lines were investigated using a Kolmogorov-Smirnov test. In the post-AGBPN objects the mean value of at 1612 MHz is higher () than that for the other two classes. The mean degree of circular polarization at 1667 MHz of the MiraSR objects is higher () than that of the OH/IR and post-AGBPN objects. There is no significant difference in the distribution of between the three classes of objects. There are 10 Mira+SR stars, 21 OH/IR objects and 8 post-AGB+PN sources with 10 Jy without detectable polarization (Fig. 2).
3.3.2 Measurements relative to the Stokes and
| Class | Line | number | (%) | number | (%) | ||
|---|---|---|---|---|---|---|---|
| (MHz) | of sources | mean (SD) | median | of sources | mean (SD) | median | |
| Mira+SR | 1612 | 14 | 12.62(1.68) | 5.57 | 12 | 7.13(1.15) | 4.07 |
| 1667 | 18 | 39.31(8.76) | 26.53 | 8 | 11.34(0.93) | 8.56 | |
| OH/IR | 1612 | 38 | 7.37(0.68) | 6.13 | 37 | 5.46(0.40) | 4.75 |
| 1667 | 12 | 11.54(1.71) | 8.70 | 9 | 11.32(1.41) | 8.77 | |
| post-AGB+PN | 1612 | 18 | 23.41(3.47) | 13.47 | 11 | 6.79(0.44) | 5.19 |
| 1667 | 6 | 24.51(3.42) | 26.28 | 4 | 4.23(0.24) | 2.96 | |
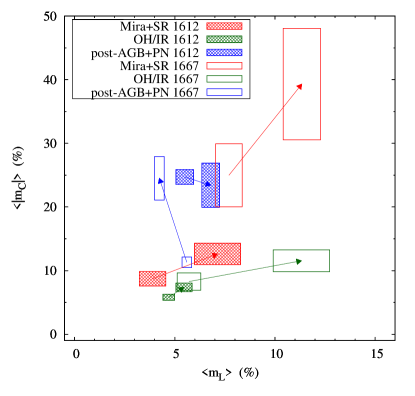
The velocity offset of the Stokes and peaks from the Stokes peaks, as noted in Sect. 3.3, is most pronounced for the Mira+SR stars where it is observed in 70–75% of the objects. The result of the analysis of the fractional polarization based on the measurements concerning the peak fluxes in the and parameters is summarized in Table 5. Generally, the mean and median values of and are 23 times higher than the values measured at the Stokes peak (Table 4). The increase in is greater at 1667 than at 1612 MHz. There is a remarkable increase of both and for the 1667 MHz MiraSR objects (Fig. 3). The trends described in Sect. 3.3.1 remain valid. We also measured the dispersion of and in consecutive spectral channels with polarized signal. It appears that at 1612 MHz the dispersion of for the Miras+SR and post-AGB+PN stars is nearly twice higher than in the OH/IR objects. The Mira+SR variables also show the highest dispersion of at 1667 MHz. The present analysis clearly shows that for the majority of sources the most highly polarized features are weaker than the line peaks. In the following analysis of the polarization properties, the measurements relative to the Stokes and are used because they are the best estimates of the maximum values of the polarization parameters in the sources (Tables 4 and 5).
3.3.3 Ratios of the integrated flux densities
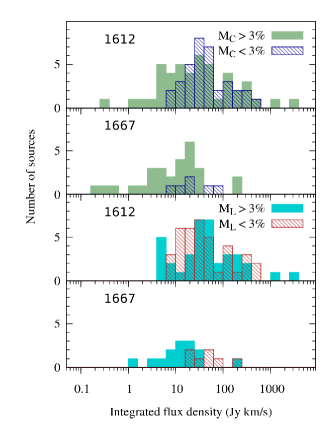
There are several sources in the sample that exhibit complex profiles in the Stokes and so that their polarization properties can only be properly determined using the integrated flux densities of the Stokes parameters. The number of sources versus the integrated Stokes flux density for both OH lines are shown in Fig. 4. Here and , where , and are the integrated Stokes , and flux densities, respectively. A distinction is made between weakly (, 3%) and more strongly (3%) polarized sources. There is evidence for higher circular and linear polarization in the 1667 MHz sources with 10-20 Jy km s-1. Less polarized 1667 MHz sources are usually the brightest in the sample. For the 1612 MHz line there is a slight excess of weak (10 Jy km s-1) sources with 3%. For the majority of the 1612 MHz sources and do not depend on the integrated Stokes flux density. Here the defined ratios estimate the net circular and linear polarizations. The net polarization would be zero for a uniformly filled maser shell with symmetric magnetic and velocity fields and density gradient. Hence, the trend to higher integrated fractional circular polarization at lower integrated total intensity may suggest that these objects have less homogeneous velocity and/or density distributions.
3.4 Highly polarized sources
Fractional polarizations referred to in this section as and are determined at the velocities of the and peaks. Table 6 lists the sources with fractional circular and linear polarizations greater than 20% and/or 10%, respectively. There are 26 sources with 20% and 17 sources with 10%.
| Name | Line | ||||
|---|---|---|---|---|---|
| (MHz) | (%) | ||||
| V CVn | 1667 | 96.4 | |||
| RT Vir | 1665 | 14.9 | 10.4 | 14.5 | 14.5 |
| 1667 | 90.7 | 76.7 | |||
| R Cnc | 1665 | 83.8 | 17.2 | 47.8 | 41.3 |
| 1667 | 90.2 | ||||
| Z Pup | 1665 | 89.9 | |||
| 1667 | 77.2 | ||||
| IRAS171503754 | 1612 | 89.8 | |||
| V778 Cyg | 1665 | 58.1 | 58.1 | 49.1 | 34.9 |
| 1667 | 83.6 | 63.8 | |||
| IRAS163423814 | 1612 | 82.7 | 82.7 | 15.7 | 6.5 |
| OH 17.72.0 | 1612 | 81.5 | 81.5 | 13.7 | 13.7 |
| 1665 | 67.2 | 67.2 | 11.5 | 11.5 | |
| 1667 | 39.8 | 2.1 | 8.9 | 8.9 | |
| GY Aql | 1665 | 25.5 | 12.5 | 12.2 | 6.2 |
| 1667 | 50.4 | 28.4 | 16.2 | ||
| UX Cyg | 1612 | 44.9 | 31.7 | ||
| R Cas | 1665 | 43.9 | 39.2 | ||
| U Her | 1665 | 43.6 | 2.4 | 7.6 | 3.4 |
| 1667 | 28.3 | 5.3 | 9.3 | 5.6 | |
| V524 Cas | 1612 | 42.9 | 21.3 | ||
| R LMi | 1665 | 40.1 | 25.3 | ||
| OH 1.2+1.3 | 1667 | 35.4 | 18.1 | 15.0 | |
| W Hya | 1665 | 35.0 | 9.4 | 30.4 | 19.2 |
| 1667 | 24.8 | 10.6 | 15.0 | 14.3 | |
| IRAS171153322 | 1612 | 30.5 | 26.3 | 7.7 | |
| 1667 | 33.1 | 14.1 | |||
| OH31.0+0.0 | 1667 | 27.9 | 27.9 | ||
| R Crt | 1665 | 27.3 | 22.1 | 28.3 | |
| 1667 | 24.0 | 17.6 | 17.0 | ||
| U Ori | 1667 | 26.2 | |||
| V1300 Aql | 1667 | 26.9 | 26.9 | 4.7 | 4.7 |
| OH 31.00.2 | 1612 | 26.1 | 26.1 | 12.6 | 2.1 |
| OH 0.9+1.3 | 1667 | 24.7 | |||
| OH 12.81.9 | 1612 | 21.9 | 5.3 | 8.5 | 8.5 |
| RR Aql | 1667 | 21.6 | 9.7 | 7.9 | |
| OH 138.0+7.2 | 1667 | 20.6 | 20.6 | 19.7 | |
| OH 55.0+0.7 | 1667 | 19.4 | 3.3 | ||
| OH 26.5+0.6 | 1667 | 16.3 | 2.8 | ||
| OH 53.60.2 | 1667 | 5.2 | 5.2 | 13.1 | 11.8 |
| IW Hya | 1612 | 11.3 | 2.5 | ||
| OH 25.10.3 | 1612 | 10.4 | 10.4 | ||
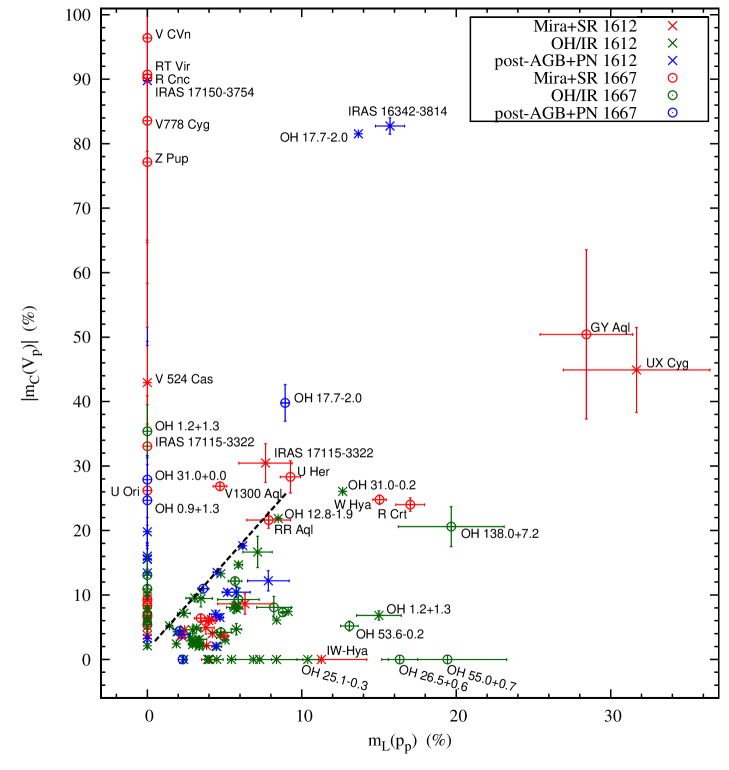
This subsample contains 10 and 21 objects with the 1612 and 1667 MHz lines, respectively. About two thirds of the 1667 MHz highly polarized sources are the MiraSR variables. Fig. 5 shows the relation between the circular and linear fractional polarizations for the whole sample. The majority of moderately polarized sources, i.e. with well-determined 25% and 10% lies below the line of form . There are a few groups of outliers; the group of MiraSR objects with strongly (75%) polarized 1667 MHz features without measurable linear polarization, the two OH/IR objects (OH17.72.0 and IRAS163423814) with features of 80% and 15%, the two Miras (GY Aql and UX Cyg) with features of high linear and circular polarization, the group mainly of OH/IR objects with features of 10% and low or marginal circular polarization. We notice that the sources with highly polarized features are usually the MiraSR objects and a few OH/IR objects showing outburst activity in OH maser lines (e.g. UX Cyg - Etoka & Le Squeren (etoka00 (2000)), OH17.7-2.0 - Szymczak & Gerard (szymczak05 (2005))).
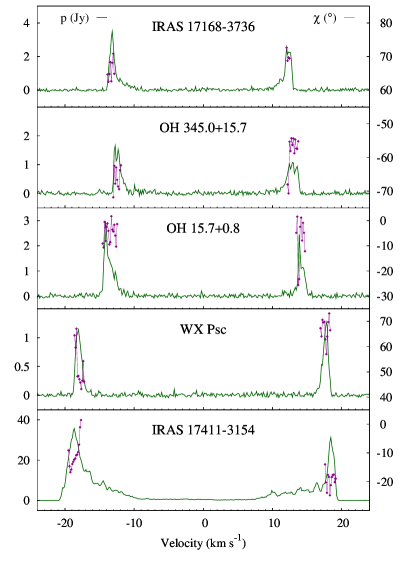
3.5 Polarization angle arrangement
There are 29 1612 MHz sources with linearly polarized emission in both parts of the double peaked profile. Several exemplary spectra with the superimposed position angle of linear polarization are shown in Fig. 6. Most of the sources show only weak (15°) variations of the polarization angle from channel to channel. Table 7 gives the average polarization angles for the four most blue- and red-shifted channels in the 1612 MHz profiles (, ) and the difference (). We found that is lower than 20°for two thirds (20/29) of the sources and is only higher than 70° in two sources. For the whole subsample the absolute average and median values of are 1934.0 and 116, respectively. For a few sources observed at several epochs spanning 6-8 years, no systematic variations of higher than 10° were found.
In the standard circumstellar shell model (Reid et al. reid77 (1977)) the 1612 MHz double peaks come from two very compact regions of opposite sides of the shell. VLBI observations of the archetypal OH/IR object OH127.80.0 proved that the 1612 MHz emission of 0.5 km s-1 width from the near and far sides of the circumstellar shell is not resolved with a 003 beam (Norris et al. norris84 (1984)). Because the diameter of the OH shell is 38 (Bowers & Johnston bowers90 (1990)), the size of the compact area unresolved with the VLBI is less than 0.8% of the shell size. Therefore it is very likely that the emission from both extreme sides of the shell is not depolarized if observed with the NRT and it reliably probes a local magnetic field. Small differences in the polarization angles at the near and far edges of the OH shells in our subsample suggest a regular magnetic field geometry in the 1612 MHz maser regions. However, it is hard to explain this homogeneous magnetic field over OH shells of large diameters (e.g. Habing habing96 (1996)). A plausible explanation for the low values of is that the origin of the field is intrinsic and the same field orientation is carried away (frozen in) by the stellar wind flowing towards the front and back of the envelope. Alternatively, the magnetic field could be of galactic origin and be amplified and/or distorted by the stellar wind. High values of in a minority of sources suggest a deviation from globally ordered magnetic field caused by local outflows or outbursts. The latter possibility is likely for OH17.72.0 where is only 37 (Tab. 7) but the polarization angle of the eruptive feature near 73 km s-1 (Szymczak & Gérard szymczak05 (2005)) is about 15° and differs by about 64° from the mean value for the extreme blue- and red-shifted velocities (Tab. 7).
Nine sources in the sample have linearly polarized emission at the two frequencies from the same usually red-shifted side of the shell (Tab. A.1, Fig. B.1). The scatters of angles within the OH mainline channels are on average 2.7 times larger than those within 1612 MHz lines. This may suggest that the 1667 MHz masers come from more turbulent regions and/or the magnetic fields are less ordered. For seven sources the velocities of the extreme emission at both frequencies overlap within less than 0.1 km s-1. In the two objects OH127.80.0 and OH53.60.2 the difference in the average polarization angle for four neighbouring channels of the 1612 and 1667 MHz lines is less than 18° while for the remaining sources it ranges from 36 to 80°. The mean difference for nine sources is 448° and the median is 47°. This result suggests that the magnetic fields probed by the two lines are generally not aligned.
| Name | (SD) | (SD) | (SD) |
|---|---|---|---|
| WX Psc | 52.7(4.8) | 63.4(2.6) | 10.8(5.4) |
| OH127.80.0 | 20.5(4.4) | 33.6(3.3) | 13.1(5.4) |
| OH138.07.2 | 47.3(2.5) | 34.2(2.3) | 13.1(3.4) |
| IK Tau | 15.8(2.1)3 | 30.7(5.2)3 | 14.8(5.6) |
| OH345.015.7 | 65.0(1.3) | 56.1(0.7) | 8.8(1.5) |
| IRAS171683736 | 66.6(1.8) | 68.2(1.7) | 1.6(2.5) |
| IRAS171773627 | 32.7(1.6) | 9.2(1.7) | 41.8(2.3) |
| IRAS172713425 | 80.6(3.2) | 74.1(2.7) | 6.5(4.2) |
| OH1.2+1.3 | 79.3(1.0)3 | 80.3(2.5) | 1.0(2.7) |
| IRAS174113154 | 13.7(0.7) | 18.7(0.8) | 4.9(1.1) |
| OH1.10.8 | 59.8(2.3) | 83.9(6.4) | 24.1(6.8) |
| IRAS175793121 | 74.2(6.3) | 66.1(8.1) | 8.1(10.3) |
| OH15.41.9 | 74.3(4.3) | 89.3(3.9) | 15.0(5.8) |
| OH15.70.8 | 4.0(1.5) | 3.1(2.0) | 0.8(2.5) |
| OH12.81.9 | 19.5(2.3) | 9.4(1.1) | 10.2(2.5) |
| OH16.10.3 | 76.5(3.5) | 90.6(2.4) | 14.1(4.2) |
| OH17.72.0 | 76.8(6.0)3 | 80.4(7.8) | 3.7(9.8) |
| OH25.10.3 | 44.0(4.8) | 72.6(6.7) | 28.6(8.2) |
| IRAS184450238 | 54.3(4.0) | 46.2(2.7) | 8.1(4.8) |
| OH32.80.3 | 15.6(3.2) | 15.4(10.3)3 | 31.0(10.8) |
| OH39.71.5 | 57.5(3.3) | 73.0(3.4)3 | 15.5(4.7) |
| OH37.10.8 | 2.3(3.1) | 13.9(19.2)2 | 11.6(19.4) |
| IRAS190592219 | 47.3(3.1) | 44.2(7.3) | 3.1(7.9) |
| OH42.30.1 | 38.8(21.9)3 | 58.3(4.1) | 82.9(22.3) |
| OH45.50.0 | 32.4(7.8) | 17.4(10.1) | 49.8(12.8) |
| OH55.00.7 | 24.8(1.4) | 20.9(5.4) | 3.9(5.6) |
| OH77.90.2 | 4.0(4.0) | 67.5(7.5)3 | 71.4(8.5) |
| OH75.31.8 | 2.4(2.6) | 13.1(1.6) | 10.7(3.0) |
| OH104.92.4 | 107.7(7.6) | 78.0(2.6) | 29.7(8.0) |
3 three, 2 two averaged channels
3.6 Possible Zeeman pairs
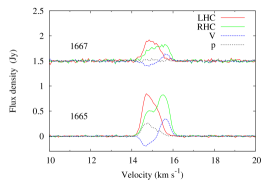
The main line Stokes spectra of R Cnc and W Hya contain S-shaped features possibly caused by the Zeeman effect (Figs. 7 and 8). Although this assumption needs to be verified by VLBI observations one, can roughly estimate the strength of the magnetic field assuming that the ratio of the Zeeman splitting to the Doppler linewidth is higher or equal to unity. In this regime the separation between the peaks of profile is a direct measure of the field strength (Elitzur elitzur96 (1996)). We used the Zeeman splitting coefficient of 0.5886 km s-1 mG-1 and 0.3524 km s-1 mG-1 for the 1665 and 1667 MHz lines, respectively. For the 1665 and 1667 MHz features of R Cnc near 15.2 km s-1 the field strength estimates along the line of sight are 0.07 mG and 0.11 mG, respectively. For the strongest feature of W Hya near 35.6 km s-1 the field strength is 0.03 mG and 0.04 mG at the 1665 and 1667 MHz lines, respectively. A negative sign means a field pointed towards the observer. These estimates should be treated with caution because the Zeeman patterns are far from perfect. Nevertheless, in both sources the field estimates are quite similar at both frequencies and moreover they are consistent with the high angular resolution measurements of other AGB and post-AGB stars (e.g. Szymczak et al. szymczak98 (1998); Bains et al. bains03 (2003, 2009)). The presence of polarized features in lots of our sources suggests that many Zeeman pairs will be found in high angular resolution studies.
3.7 OH 1667 MHz overshoot
There are 63 objects in the sample for which the spectral extent of 1667 MHz emission is higher by at least 0.2 km s-1 than that of 1612 MHz emission. This overshoot effect is seen either at the blue- or red-shifted or at both edges. A summary of the mean and median expansion velocities and overshoots for the three classes of objects is given in Table 8. Here, the expansion velocity is determined as a half of the peak-to-peak velocity width of the 1612 MHz profile. The class of MiraSR stars has expansion velocities significantly lower than in the two other classes. The lowest mean and median overshoots of 0.780.16 km s-1 and 0.47 km s-1, respectively, belong to the Miras and SR objects. The highest median value of overshoot of 2.08 km s-1) is determined for the post-AGBPN class. The phenomenon is most frequent (63%) in the OH/IR objects.
The overshoot effect was broadly discussed by Sivagnanam & David (siva99 (1999)) for a sample of 21 AGB and post-AGB objects who proposed several mechanisms. Deacon et al. (deacon04 (2004)) suggested the existence of some acceleration in the outer parts of the shell where the 1612 and 1667 MHz maser originate and that the 1667 MHz masers are located farther than the 1612 MHz ones. The trend in overshoot found in our sample suggests that the phenomenon can be related to the evolutionary sequence. We did not find any obvious relationships between overshoot and the polarization parameters.
| Class | Line | Number | Expansion velocity (km s-1) | Number | Overshoot (km s-1) | ||
|---|---|---|---|---|---|---|---|
| (MHz) | Mean(SD) | Median | Mean(SD) | Median | |||
| Mira+SR | 1612 | 23 | 10.68(1.08) | 12.16 | |||
| 1667 | 26 | 8.36(0.98) | 6.12 | 16 | 0.78(0.16) | 0.47 | |
| OH/IR | 1612 | 56 | 15.15(0.57) | 14.38 | |||
| 1667 | 37 | 15.36(0.54) | 15.09 | 37 | 1.18(0.14) | 0.93 | |
| post-AGB+PN | 1612 | 14 | 12.08(1.14) | 12.36 | |||
| 1667 | 8 | 13.34(0.74) | 13.51 | 10 | 2.25(0.62) | 2.08 | |
4 Discussion
4.1 Occurence of polarization
The present full-polarization data for a substantial sample of AGB and post-AGB objects have allowed us to give a comprehensive picture of the polarization properties of OH circumstellar masers. First of all, our high sensitivity and spectral resolution study shows that the polarized OH maser emission is widespread. This finding is at odds with early reports, which demonstrated a paucity of polarized features in the 1612 MHz spectra and only occasional detections of linear polarization at 1667 MHz (Cohen cohen89 (1989), for review). Thus, spectral resolution appears to be a crucial factor (Cohen et al. cohen87 (1987); Zell & Fix zell91 (1991)).
The study allowed us to extract a complete subsample of 1612 MHz emitters, composed of 8 Miras+SR stars, 38 OH/IR objects and 10 post-AGB+PN sources, which is not biased by the sensitivity limit and the minimum believable fractional polarization (see Sect. 3.2 for definition). In this subsample the detection rate of polarized features is 75-90% and there is no intrinsic difference in the occurrence of polarized emission between the three classes of studied objects. A complete subsample of 1667 MHz sources contains only 2 Miras+SRs, 3 OH/IR objects and 4 post-AGB+PN stars. All but one of these targets show polarized emission. It seems that the occurrence of polarized features at 1667 MHz does not differ between the three classes of stars.
4.2 Effect of depolarization
For 1612 MHz sources the mean and median degrees of circular polarization in the post-AGB+PN objects are significantly higher that those in the two other classes of studied stars. We notice that in the sample are at least two bursting post-AGB stars; IRAS16342-3814 and OH17.7-2.0 with 80%. These objects sometimes experience OH bursts of highly polarized emission at 1612 MHz usually not associated with bursts at 1665 and 1667 MHz (Szymczak & Gérard szymczak05 (2005)). In many post-AGB objects there is a disruption of detached AGB 1612 MHz shells that are no longer spherically symmetric and the appearance of a well-defined bipolar morphology at 1667 MHz is observed (Zijlstra et al. zijlstra01 (2001)). In these partially-filled 1612-MHz structures, observed at high angular resolution, Zeeman components are much less spatial blended than in dense (M☉, Habing habing96 (1996)), more fully filled shells that are observed around OH/IR objects (e.g. Bowers & Johnston bowers90 (1990)). Therefore, the enhancement of the circular polarization degree at 1612 MHz in the post-AGB+PN objects compared to the two other classes of objects could be caused by negligible depolarization in the first class of objects. However, the post-AGB+PN group may be heterogeneous because of the lack of accurate criteria for selection (Sect. 2.1) and significant depolarization cannot be excluded in some objects (Szymczak & Gérard szymczak04 (2004)).
The mean degree of circular polarization at 1667 MHz is significantly higher in the Mira+SR stars than in the other classes of objects. The mass loss rates for Mira and SR variables are about M☉ (Habing habing96 (1996)) while the 1667 MHz maser originates in the inner parts of the shell at a distance of about 50-150 AU from the central star (Chapman et al. chapman94 (1994); Szymczak et al. szymczak98 (1998)). This implies that regardless of the magnetic field type, its strength in the 1667 MHz maser regions should be higher than in the 1612 MHz OH maser outer shells. High angular resolution images revealed a highly fragmentary distribution of the 1667 MHz emission (Chapman et al. chapman94 (1994); Szymczak et al. szymczak98 (1998)), indicating a low filling factor for the OH molecule. In this shell the spatial overlapping of Zeeman components is weak, if there is any at all. Furthermore, Miras and SR variables often exhibit erratic variability of OH emission, which usually is highly polarized (Etoka & Le Squeren etoka97 (1997)). We conclude that the higher degree of circular polarization in the Mira+SR stars compared to the other classes of objects is because of negligible depolarization in the envelopes that are partially filled by the gas clouds sustaining OH maser emission.
4.3 Zeeman splitting
The interpretation of OH maser polarization data strongly depends on the assumed value of the ratio of Zeeman splitting to Doppler linewidth, , (Elitzur elitzur96 (1996)). For the separation of the components of the Zeeman pair scales directly to the strength of the magnetic field along the line of sight. If only the Doppler width can be estimated from the separation of the two peaks of Stokes profile. High angular resolution observations of OH lines in some AGB and post-AGB stars (Szymczak et al. szymczak98 (1998); Bains et al. bains03 (2003, 2004, 2009); Amiri et al. amiri10 (2010)) revealed a magnetic field strength of 13 mG. This value agrees well with our tentative estimates of magnetic fields of 0.32.3 mG in two Miras. The kinematic temperature in regions of circumstellar 1612 and 1667 MHz masers is 50-100 K (Goldreich & Scoville goldreich76 (1976); Fong et al. fong02 (2002)), hence for OH molecule the thermal linewidth is 0.360.51 km s-1. It implies that is fulfilled for most sources in the sample. We note that the Zeeman pairs are of unequal strength, and in several cases likely only one sense of circularly polarized emission is seen. This can occur when the maser radiation is amplified in the region where the gradients of the velocity match the magnetic field (Cook cook66 (1966)). A simpler explanation for uneven circular polarization is the overlap of different Zeeman components caused by a velocity gradient within the maser region (Deguchi & Watson deguchi86 (1986)).
In the case of the polarization of the components is described by the equations =2cos/(1+cos and =sin/(1+cos (Goldreich et al. goldreich73 (1973); Elitzur elitzur96 (1996)), where is the angle between the magnetic field direction and the line of sight. We used these equations to model the diagram. It is easy to show that the ratio integrated and averaged over the solid angle builds up rapidly between ° and ° while the has barely started growing. This means that the ratio is very high until ° and that may explain the void in Fig. 5 even with a spherically symmetric distribution of the angle. Although our study was of insufficient angular resolution to determine polarization properties of individual maser spots and the strongest polarized features were used to construct the diagram, the appearance of the void (Fig. 5) may be the proof that the polarized features are the components and that the condition is fulfilled for unsaturated OH masers.
Fig. 5 shows a distinct group of 1612/1667 Mira+SR sources with only circularly polarized emission (the first six objects in Tab. 6), indicating that the magnetic field is parallel to the line of sight. Another small group of mainly OH/IR objects (the five last objects in Tab. 6) with predominant linear polarization at 1612 or 1667 MHz represents the case where the magnetic field is perpendicular to the line of sight. These objects appear to be good candidates for high angular resolution studies to determine their properties better and to examine if significant differences in polarization parameters could be caused by different states of saturation as predicted in the standard model of maser polarization (Goldreich et al. goldreich73 (1973); Vlemmings vlemmings06 (2006)).
5 Conclusions
We have presented the results of full-polarization observations of the 1612 and 1667 MHz OH maser lines towards a sample of 117 AGB and post-AGB stars. A complete set of full-polarization spectra and the basic polarization parameters was given.
The polarized features occur in more than 75% of the sources in the sample complete to the total flux density higher than 7.5 Jy and the minimum fractional polarization of 2%. There is no intrinsic difference in the occurrence of polarized emission between the three classes of objects. The highest fractional polarization occurs for the post-AGB+PN and the Mira+SR classes at 1612 and 1667 MHz, respectively. Differences in the fractional polarizations are likely caused by depolarization caused by blending of polarized emission.
The relationship between the circular and linear fractional polarizations for extreme red- and blue-shifted features, which are less likely to be blended, was interpreted within the frame of the standard models of polarization for the regime of the Zeeman splitting higher than the Doppler line width. The strength of the magnetic field derived from the tentative Zeeman pairs for a few Miras of 0.3-2.3 mG is consistent with the results of high angular resolution observations of other AGB stars. The front and back caps show only small differences in polarization angle (20°) at 1612 MHz, which suggests a regular geometry of the magnetic field in the outer parts of the shells. The observed relation between the circular and linear fractional polarizations suggests that the polarized features are the components and the Zeeman splitting is higher than the Doppler line width.
The study has provided many targets for future investigations. VLBI + e-MERLIN mapping of polarized OH maser emission will be essential to measure the magnetic field strength and its structure and to refine the present results.
Acknowledgements.
P.W. acknowledges support by the UE PhD Scholarship Programme (ZPORR). The Nancay Radio Observatory is the Unité Scientifique de Nancay of the Observatoire de Paris, associated with the CNRS. The Nancay Observatory acknowledges the financial support of the Region Centre in France.References
- (1) Amiri, N., Vlemmings, W., & van Langevelde, H.J., 2010, A&A, 509, 26
- (2) Bains, I., Gledhill, T.M., Yates, J.A., & Richards, A.M.S. 2003, MNRAS, 338, 287
- (3) Bains, I., Gledhill, T.M., Richards, A.M.S., & Yates, J.A. 2004, MNRAS, 354, 529
- (4) Bains, I., Richards, A.M.S., & Szymczak, M. 2009, ASPC, 404, 368
- (5) Baud, B., Habing, H.J., Matthews, H.E., & Winnberg, A. 1979a, A&AS, 35, 179
- (6) Baud, B., Habing, H.J., Matthews, H.E., & Winnberg, A. 1979b, A&AS, 36, 193
- (7) Benson, J.M., Mutel, R.L., Fix, J.D., & Claussen, M.J. 1979, ApJ, 229, 87
- (8) Benson, P.J., Little-Marenin, I.R., Woods, T.C., et al. 1990, ApJS, 74, 911
- (9) Bedijn, P. 1987, A&A, 186, 136
- (10) Bowers, P.F., & Johnston, K.J. 1990, ApJ, 354, 676
- (11) Bowers, P.F., 1978, A&AS, 31, 127
- (12) Chapman, J.M., & Cohen. R.J. 1986, MNRAS, 220, 513
- (13) Chapman, J.M., Sivagnanam, P., Cohen, R.J., & Le Squeren, A.M. 1994, MNRAS, 268, 475
- (14) Claussen, M.J., & Fix, J.D. 1982, ApJ, 263, 153
- (15) Cohen, R.J. 1989, RPPh, 52, 881
- (16) Cohen, R.J., Downs, G., Emerson, R., et al. 1987, MNRAS, 225, 491
- (17) Cook, A.H. 1996, Nature, 211, 503
- (18) Deguchi, S., & Watson, W.D. 1986, ApJ, 300, L15
- (19) Deacon, R.M., Chapman, J.M., & Green, A.J. 2004, ApJS, 155, 595
- (20) Eder, J., Lewis, B.M., & Terzian, Y. 1988, ApJS, 66, 183
- (21) Elitzur, M. 1996, ApJ, 457, 415
- (22) Engels, D., & Bunzel, F. 2008, Database of Circumstellar Masers v1.2 (http://www.hs.uni-hamburg.de/maserdb)
- (23) Etoka, S., & Le Squeren, A.M. 1997, A&A, 321, 877
- (24) Etoka, S., & Le Squeren, A.M. 2000, A&AS, 146, 179
- (25) Fix, J. D. 1979, ApJ, 232, 39
- (26) Fong, D., Justtanont, K., Meixner, M., & Campbell, M.T. 2002, 396, 581
- (27) Gray, M.D., & Field, D. 1995, A&A, 298, 243
- (28) Goldreich, P., Keeley, D., & Kwan, J.Y. 1973, ApJ, 179, 111
- (29) Goldreich, P., Scoville, N.Z. 1976, ApJ, 205, 144
- (30) Habing, H.J. 1996, A&A Rev., 7, 97
- (31) Jewell, P.R., Webber, J.C., & Snyder, L.E. 1981, ApJ, 249, 118
- (32) Le Squeren, A.M., Sivagnanam, P., Dennefeld, M., & David, P. 1991, A&A, 254, 133
- (33) Likkel, L. 1989, ApJ, 344, 350
- (34) Norris, R.P., Booth, R.S., Diamond, P.J., et al. 1984, MNRAS, 208, 435
- (35) Olnon, F. M., Winnberg, A., Matthews, H. E., & Schultz, G. V. 1980, A&AS, 42, 1190
- (36) Reid, M.J., Muhleman, D.O., Moran, J.M., Johnston, K.J., & Schwartz, P.R. 1977, ApJ, 214, 60
- (37) Sevenster, M.N., Chapman, J.M., Habing, H.J., Killeen, N.E.B., & Lindqvist, M. 1997a, A&AS, 122, 79
- (38) Sevenster, M.N., Chapman, J.M., Habing, H.J., Killeen, N.E.B., & Lindqvist, M. 1997b, A&AS, 124, 509
- (39) Sevenster, M.N., van Langevelde, H.J., Moody, R.A., et al. 2001, A&A, 366, 481
- (40) Sivagnanam, P., & David, P. 1999, MNRAS, 304, 622
- (41) Szymczak, M., Cohen, R.J., & Richards, A.M.S. 1998, MNRAS, 297, 1151
- (42) Szymczak, M., Cohen, R.J., & Richards, A.M.S. 2001, A&A, 371, 1012
- (43) Szymczak, M., & Gérard, E. 2004, A&A, 423, 209
- (44) Szymczak, M., & Gérard, E. 2005, A&A, 433, L29
- (45) te Lintel Hekkert, P. Caswell, J.L., Habing, H.J., Haynes, R.F., & Norris, R.P. 1991, A&AS, 90, 327
- (46) van der Veen, W.E.C.J., & Habing, H.J. 1988, A&A, 194, 125
- (47) van Driel W., Pezzani J., Gérard E. 1996, in High Sensitivity Radio Astronomy, ed. N. Jackson, & R. J. Davis (Cambridge Univ. Press), 229
- (48) Vlemmings, W.H.T. 2006, A&A, 445, 1031
- (49) Whitelock, P., Menzies, J., Feast, M., et al. 1994, MNRAS, 267, 711
- (50) Wilson, W.J., Barrett, A.H., & Moran, J.M. 1970, ApJ, 160, 545
- (51) Wilson, W.J., & Barrett, A.H. 1972, ApJ, 17, 385
- (52) Wilson, W.J., Schwartz, P.R., Neugebauer, G., Harvey, P.M., & Becklin, E.E. 1972, ApJ, 177, 523
- (53) Zijlstra, A.A., Chapman, J.M., te Lintel Hekkert, P., et al. 2001, MNRAS, 322, 280
- (54) Zell, P.J.,& Fix, J.D. 1991, ApJ, 369, 506