Non-random walks in monkeys and humans
Abstract
Principles of self-organization play an increasingly central role in models of human activity. Notably, individual human displacements exhibit strongly recurrent patterns that are characterized by scaling laws and can be mechanistically modelled as self-attracting walks. Recurrence is not, however, unique to human displacements. Here we report that the mobility patterns of wild capuchin monkeys are not random walks and exhibit recurrence properties similar to those of cell phone users, suggesting spatial cognition mechanisms shared with humans. We also show that the highly uneven visitation patterns within monkey home ranges are not entirely self-generated but are forced by spatio-temporal habitat heterogeneities. If models of human mobility are to become useful tools for predictive purposes, they will need to consider the interaction between memory and environmental heterogeneities.
Instituto de Física, Universidad Nacional Autónoma de
México, 04510 D.F., Mexico
Centro de Ciencias de la Complejidad,
Universidad Nacional Autónoma de México, 04510 D.F., Mexico
Smithsonian Tropical Research Institute,
Apartado Postal 0843-03092, Panamá, República de Panamá
Max Planck Institute for Ornithology, Department of Migration
and Immuno-ecology, 78315 Radolfzell, Germany
Department of Ecology and Evolutionary Biology,
Princeton University, Princeton, NJ 08544, USA
VaccinApe, 5301 Westbard Circle, Bethesda, MD 20816, USA
Keywords: movement ecology, home range, memory, human mobility, capuchin monkeys, scaling laws.
Short title: Non-random walks in monkeys and humans
1 Introduction
Individual human displacements have a strong impact on many collective social phenomena, such as the spread of epidemics [1, 2, 3] or cultural traits [4]. The availability of quantitative mobility data has increased in recent years through the widespread use of global positioning systems [5] and the ability to track cell phones [6, 7, 8]. These new data show that human displacements do not follow memoryless processes, like the well-known Markovian random walk [9], rather, they exhibit ultra-slow diffusion and unusual, long lasting recurrence properties due to the tendency of individuals to frequently revisit a small number of familiar locations [7, 8].
Whether unifying principles that govern the movements of humans [8] and, more generally, of living organisms [10] exist is a hotly debated issue. As with the distribution of city sizes [11] or the dynamics of individual tasks [12], scaling laws prevail in human mobility data [5, 8, 13]. In physical systems, scaling laws are often the outcome of self-organization principles. Self-attracting or reinforced walks [14, 15] are non-Markovian stochastic walks that tend to revisit with higher probability locations visited in the past. Recently, a new reinforced walk model with preferential return to previously visited sites, in analogy with preferential attachment rules used in network science [16], could reproduce many empirical human visitation patterns [8]. However, it is also important to quantify the dependence of individual displacements on more complex external factors, for instance, transportation [1] and social networks [17], or the spatial distribution of facilities or resources [18].
In this contribution, we show that the scaling laws characterizing recurrence in human movements are similar to those exhibited by some foraging animals, which suggests that these patterns are not unique to humans and may be generated by a more generalized set of cognitive mechanisms. We present evidence that, like humans, other animals also live in heterogeneous habitats where some areas are more valuable to them than others. Recurrent patterns of movement, in particular home range behavior, actually characterize the ranging of a very large number of animal species [19, 20]. Here, we use radio telemetry data to show that the mobility and visitation patterns of capuchin monkeys (Cebus capucinus) foraging for fruit in a tropical forest are not only comparable to human cell phone users qualitatively, but exhibit scaling laws that are strikingly similar in both the short and long time regimes. In addition, monkeys movements are not entirely self-organized but also strongly driven by spatio-temporal variations in resource distribution.
2 Results
The data for our analyses come from a study on Barro Colorado Island, Panama, in which the movements of four radio-collared capuchin monkeys belonging to different social groups were tracked using an automated telemetry system over the course of a six month period, from November 2004 to April 2005 (see [21] for details). The locations for each individual were estimated every minutes and discretized into square cells of size 5050 m, a scale that corresponds roughly to the measurement error and was taken as the spatial resolution. Unless indicated, we considered all available positions (night and day) in the analyses.
2.1 Basic movement properties
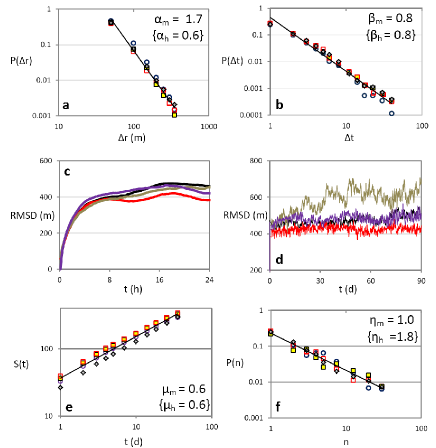
Short time-scale properties of monkey movement paths followed similar scaling forms as those of human cell phone users Ref. [8] (see Figure 1a,b). For example, the distributions of the displacement between consecutive telemetry fixes are good fits to a power-law, with in the range 50 m 350 m, for all four individuals (sample sizes1619, 1998, 3072 and 2097). This exponent, as well as and below, were obtained by using a Bayesian Markov chain Monte Carlo simulation with uniform priors and the Metropolis-Hastings algorithm. For each measure we evaluated the likelihood of a given value of the exponent of the bounded power-law given the data. The exponent value is the average obtained from the posterior support distribution. We also calculated the maximum likelihood estimate (MLE), obtaining practically the same value.
Similarly, the waiting time , defined as the number of consecutive fixes found in the same 5050 m cell multiplied by the temporal resolution , follows a power-law distribution, with , the same value as reported for humans [8, 13] and other primates [22]. The exponents and play central roles in continuous time random walk (CTRW) models of anomalous transport [13, 23] and of biological Lévy flights [22, 24, 25].
Like humans, monkeys trajectories are however incompatible with a random Lévy walk description at large time-scales, as they exhibit strongly recurrent patterns of movement. For example, the root mean squared displacement (RMSD) virtually asymptotes within one day, rather than following a classical power-law growth with time (Fig. 1c,d). This arrested or ultra-slow diffusion is a manifestation of home range behavior [19, 20]. Likewise, the average number of distinct cells visited during a time interval (Fig. 1e) increases through time as with smaller than the waiting time exponent , which is what would have been expected for a CTRW [8, 23]. One finds , remarkably close to what measured by Song et al. for humans [8]. Another intriguing aspect of recurrence is the highly uneven visitation pattern among cells, see Fig. 1f. Within the six-month data collection period, the probability of finding a cell that has received visits by the same individual (i.e., has been entered times) cannot be described by a Poisson distribution or a bell-curve centered around a characteristic value. Instead, it can be fitted by a power-law, with ( in humans [8]). Whereas most sites were visited once or twice, it is not rare to find popular activity “hotspots” or “hubs”, with 30 or more visits. In contrast, a random walker bounded in a closed domain would visit all sites more or less equally frequently. For all the properties described above, the four individual monkeys showed very similar exponent estimates. The number of distinct cells visited by the animals during the six-month period was 568, 488, 606 and 531, respectively.
2.2 Recurrence and environmental forcings
Like humans, many animals have sophisticated memory skills [26] and home ranges can emerge from frequent returns to previously visited locations [27]. In principle, home ranges could even be completely self-organized, arising as a result of the walker’s history. Random walks biased towards the center of mass of all previously visited sites, or such that, at each step, there is a finite probability of returning to a randomly selected site visited in the past, exhibit arrested or very slow diffusion [20, 28]. In the context of human mobility, the results of Figure 1 have been reproduced assuming that the probability of choosing a given site is proportional to the number of previous visits to that site (“preferential attachment”), and assuming that the probability of taking a random step (to a unvisited site) decays algebraically with the number of sites already visited, [8]. An advantage of this latter approach is that it builds up uneven visits and power-laws for the distribution .
What these models and those belonging to a much broader class based on preferential attachment mechanisms ignore is environmental heterogeneity. A mobile agent may be inclined to visit a place not because it is familiar but because of some intrinsic quality of the location, (e.g., food content). Heterogeneity is implied in the relationship between the quality of habitat cells and the probability of cell revisit. Capuchin monkeys home ranges typically contain millions of tree stems which belong to more than 200 species [29], vary in size by 2 orders of magnitude [30] and only episodically produce fruit [31]. Consequently, the cells in our analyses varied widely in the content of monkeys’ primary food, ripe fruit. During the day (from 04:00 to 20:00 hrs), animals are awake and active [21], and their primary activities are feeding and foraging with relatively rare periods of prolonged resting [29]. During the day, a waiting time of min (one fix, the minimum observable value) is assumed to correspond to a “transit” through a cell. Given a series of consecutive fixes in a same cell, the time elapsed between the first and the last fixes, , can be taken as a proxy of the ripe fruit content within the corresponding cell. An individual will tend to spend more time feeding in a tree that has more fruit and we consider as the threshold above which one can tell that a feeding event occurred. Figure 2 shows a positive correlation between the number of day-time visits received by a cell and the average duration of a visit at that cell, (the average being taken over all visits among cells with visits). The latter quantity can be approximated by a scaling law:
| (1) |
with . Although other functional relations may fit the data, the crucial point is that large cells have, on average, longer waiting times and, most likely, higher food content. A similar, and even clearer, relationship is observed if all night and day positions are taken into account ( in this case). Sleeping trees also represent resources, as not all trees are suitable for sleep at night.


Similarly, the time elapsed between two consecutive day-time visits to a site depends on the results of the initial visit. We denote MFRTΔt as the mean first return time to a cell where the waiting time was at the last visit. As shown by Figure 2b, the MFRT tends to decrease with increasing patch quality (). For min, it approximately follows the scaling law:
| (2) |
with . Note that the unaveraged first return time is a variable known to fluctuate widely in simple models like the random walk [32]. Similarly here, error bars in Figure 2b increase with , which may be due to the fewer available observations at larger (Fig. 1b). Averages obtained from less than 5 observations were discarded.
These results show evidence that, in addition to being non-random, movement choices are driven by resource availability, with larger food patches visited more often. Eq. (2) also holds if night and day positions are aggregated (). Hence, a new waiting time is not randomly drawn at each cell visit, as assumed in CTRW models. Rather, the situation here is analogous to systems with quenched site disorder [32]. In trap models, though, the frequency of visits to a site by a memoryless random walker is independent of the waiting time ().
Unlike supermarkets, gas stations or other human facilities, resources in natural ecosystems tend to be ephemeral. Trees produce fruit transiently and often asynchronously, with the fruiting periods of individual trees lasting from a few weeks to a couple of months [31]. Capuchin monkeys hotspots, in particular, are not permanent. Figure 3a shows the positions of the most visited sites by a single individual during the day in successive non-overlapping time periods (of about 2 weeks) with visited sites each. These cells are rarely the same from one time window to the other. The fluctuating cloud formed by the visited cells suggests a flexible use of space, despite the stability of the overall home range. Defining hotspots as the most frequently visited of sites, the probability that a cell which is a hotspot during a time window is also a hotspot during time window decays rapidly with (Figure 3b). The average number of visits received by a cell in time window , given that this cell was a hotspot in time window , also decays with (Figure 3c). Very similar curves are obtained if night and day data are aggregated.
3 Conclusions
We have shown that the individual movement patterns of humans are similar to those of capuchin monkeys. Most notably these patterns exhibit ultra-slow diffusion (the presence of a home range) and history dependent recurrence properties obeying scaling laws. In monkeys, we have presented evidence that these nonrandom walks are caused by the use of memory, a behavior which is not unique to humans nor evolutionary novel. These results suggest, but do not prove, that similar cognitive mechanisms may govern the movements of many animals. Testing such hypothesis would require data analysis for a variety of species.
Our analyses also indicate that monkey movements are driven by environmental heterogeneities. Monkey ranging patterns are thus not “self-quenched” into a routine emerging from initially random movements that would be re-inforced and dominated at large time by frequent revisits to a small number of known locations, a mechanism proposed for human mobility [8]. Similarly, it is likely that human movements are not entirely self-organized, as this would imply that the locations of activity hotspots would be uncorrelated with environmental factors. In the real world, many hotspots would clearly be shared because of some intrinsic property of the location: e.g., schools, transit hubs or office buildings. A difference is that many human resources last over long time scales, like homes and workplaces [6]. Yet, others are transient, like restaurants, trendy night-clubs or fashionable shops, or seasonal, like swimming pools and ski-resorts. A place can be also abandoned for another not because it is depleted but because the appetite for that resource has been temporarily sated.
Despite the similarities between human and monkey movements, there are important differences. In humans, the home range size fluctuates widely from one individual to another, ranging between 1 km and 1000 km approximately [6, 8]. In contrast, the nearly identical home range sizes found for the four monkeys (Fig.1c,d) suggest a narrow size distribution, probably due to comparable habitats, energetic needs and locomotor capacities. This is consistent with the fact that the home range of a capuchin group overlaps with a relatively small number of other home ranges [21], which probably limits intergroup interactions to nearest neighbors or next-nearest neighbors. This property is not shared by all animal species, though. Territorial prides of Serengeti lions occasionally make long-range contacts with other prides as well as with nomadic individuals, producing a denser network of contacts with the “small world” property that characterizes many human social networks [33].
Similar to random diffusion models of animal movements with intermittent central attraction [34], several models of human mobility with preferential return to home have been introduced recently, showing that recurrence can have dramatic effects on spreading processes in large populations [1, 2, 3]. These latter models typically assume a known set of locations that can be visited and Markovian, individual-dependent transition rates between locations. Developing parallel modeling frameworks that adequately represent both self-organization and environmental forcing will be critical to the success of human movement models for purposes such as of controlling the spread of infectious diseases. These alternate models should incorporate cognitive mechanisms that many vertebrates use, e.g. spatial representation mechanisms (cognitive maps or travel cost discounting) and temporal mechanisms (episodic memory) [35]. How scaling laws emerge from the interplay between memory and landscape features remains elusive.
Acknowledgements
This work was conducted as a part of the “Efficient Wildlife Disease Control: from Social Network Self-organization to Optimal Vaccination” Working Group supported by the National Center for Ecological Analysis and Synthesis, a centre funded by the NSF (grant DEB-0553768), the University of California, Santa Barbara, and the State of California. Funding for the data collection was provided to MCC by the Smithsonian Tropical Research Institute and the Frederik Sheldon Travelling Fellowship from the Harvard University. Required permits were obtained from the Autoridad Nacional del Ambiente, Panama and the Smithsonian Tropical Research Institute Institutional Animal Care and Use Committee. All research complied with the laws of the Republic of Panama and the United States.
References
- [1] Balcan, D. Vespignani, A. 2011 Phase transitions in contagion processes mediated by recurrent mobility patterns. Nature Phys. 7, 581–586. (doi:10.1038/NPHYS1944)
- [2] Skufca, J. D. ben-Avraham, D. 2010 A model of human population motion. arXiv:1006.1301v1 [physics.soc-ph].
- [3] Belik, V., Geisel, T. Dirk Brockmann, D. 2011 Natural human mobility patterns and spatial spread of infectious diseases. Phys. Rev. X 1, 011001. (doi:10.1103/PhysRevX.1.011001)
- [4] Lizana, L., Mitarai, N., Nakanishi, H. Sneppen, K. 2011 Modelling the spatial dynamics of culture spreading in the presence of cultural strongholds. Phys. Rev. E 83, 066116. (doi:10.1103/PhysRevE.83.066116)
- [5] Rhee, I., Shin, M., Hong, S., Lee, K. Chong, S. 2008 On the Lévy-walk nature of human mobility. In Proceedings of IEEE INFOCOM. 2008, pp. 924–932.
- [6] González, M. C., Hidalgo, C. A. Barabási, A.-L. 2008 Understanding individual human mobility patterns, Nature 453, 779–782. (doi:10.1038/nature06958)
- [7] Song, C., Qu, Z., Blumm, N. Barabási, A.-L. 2010 Limits of predictability in human mobility. Science 327, 1018–1021. (doi:10.1126/science.1177170)
- [8] Song, C., Koren, T., Wang, P. Barabási, A.-L. 2010 Modelling the scaling properties of human mobility. Nature Phys. 6, 818–823. (doi:10.1038/nphys1760)
- [9] Codling, E. A., Plank, M. J. Benhamou S. 2008 Random walk models in biology. J. R. Soc. Interface 5, 813–834. (doi:10.1098/rsif.2008.0014)
- [10] Nathan, R., Getz, W. M., Revilla, E., Holyoak, M., Kadmon, R., Saltz, D. Smouse, P. E. 2008 A movement ecology paradigm for unifying organismal movement research. Proc. Natl. Acad. Sci. USA 105, 19052–19059. (doi:10.1073/pnas.0800375105)
- [11] Newman, M. E. J. 2005 Power laws, Pareto distributions and Zipf’s law. Contemp. Phys. 46, 323–351. (doi:10.1080/00107510500052444)
- [12] Barabási, A.-L. 2005 The origin of bursts and heavy tails in human dynamics. Nature 435, 207–211. (doi:10.1038/nature03459)
- [13] Brockmann, D., Hufnagel, L. Geisel, T. 2006 The scaling laws of human travel. Nature 439, 462–465. (doi:10.1038/nature04292)
- [14] Davis, B. 1990 Reinforced random walk. Probab. Theor. Related Fields 84, 203–229. (doi:10.1007/BF01197845)
- [15] Foster, J. G., Grassberger, P. Paczuski, M. 2009 Reinforced walks in two and three dimensions. New J. Phys. 11, 023009. (doi:10.1088/1367-2630/11/2/023009)
- [16] Barabási, A.-L. Albert, R. 1999 Emergence of Scaling in Random Networks. Science 286, 509–512. (doi:10.1126/science.286.5439.509)
- [17] Lee, K., Hong, S., Kim, S. J., Rhee, I. Chong, S. 2009 SLAW: A Mobility Model for Human Walks. In Proceedings of IEEE INFOCOM. 2009, pp. 855–863.
- [18] Gastner, M. T. Newman, M. E. J. 2006 Optimal design of spatial distribution networks. Phys. Rev. E 74, 016117. (doi:10.1103/PhysRevE.74.016117)
- [19] Moorcroft, P. R. Lewis, M. A. 2006 Mechanistic home range analysis. Princeton: Princeton University Press.
- [20] Brger, L., Dalziel, B. D. Fryxell, J. M. 2008 Are there general mechanisms of animal home range behaviour? A review and prospects for future research. Ecol. Lett. 11, 637–650. (doi:10.1111/j.1461-0248.2008.01182.x)
- [21] Crofoot, M. C., Gilby, I. C., Wikelski, M. C. and Kays, R. W. 2008 Interaction location outweighs the competitive advantage of numerical superiority in Cebus capucinus intergroup contests. Proc. Natl. Acad. Sci. USA 105, 577–581. (doi:10.1073/pnas.0707749105)
- [22] Ramos-Fernández, G., Mateos, J. L., Miramontes, O., Cocho, G., Larralde, H. Ayala-Orozco, B. 2004 Behav. Ecol. Sociobiol. 55, 223–230. (doi:10.1007/s00265-003-0700-6)
- [23] Metzler, R. Klafter, J. 2000 The random walk’s guide to anomalous diffusion: a fractional dynamics approach. Phys. Rep. 339, 1–77. (doi:10.1016/S0370-1573(00)00070-3)
- [24] Shlesinger, M. F. Klafter, J. 1986 Lévy walks versus Lévy flights. In: Stanley, H. E. Ostrowsky, N. (Eds.) On Growth and form. Boston: Martinus Nijhoff Pub., pp. 279–283.
- [25] Viswanathan, G. M., Raposo, E. P. da Luz, M. G. E. 2008 Lévy flights and superdiffusion in the context of biological encounters and random searches. Phys. Life Rev. 5, 133–150. (doi:10.1016/j.plrev.2008.03.002)
- [26] Janson, C. H. Byrne, R. 2007 What wild primates know about resources: opening up the black box. Anim. Cogn. 10, 357–367. (doi:10.1007/s10071-007-0080-9)
- [27] van Moorter, B., Visscher, D., Benhamou, S., Brger, L., Boyce, M. S. Gaillard, J.-M. 2009 Memory keeps you at home: a mechanistic model for home range emergence Oikos 118, 641–652. (doi:10.1111/j.1600-0706.2008.17003.x)
- [28] Gautestad, A. O. and Mysterud, I. 2005 Intrinsic scaling complexity in animal dispersion and adundance. Am. Nat. 165, 44–55.
- [29] Crofoot, M. C., unpublished data.
- [30] Enquist, B. J. Niklas, K. J. 2001 Invariant scaling relations across tree-dominated communities. Nature 410, 655–660. (doi:10.1038/35070500)
- [31] Caillaud, D., Crofoot, M. C., Scarpino, S. V., Jansen, P. A., Garzon-Lopez, C. X., Winkelhagen, A. J. S., Bohlman, S. A. Walsh, P. D. 2010 Modeling the Spatial Distribution and Fruiting Pattern of a Key Tree Species in a Neotropical Forest: Methodology and Potential Applications. PLoS ONE 5, e15002. (doi:10.1371/journal.pone.0015002)
- [32] Bouchaud, J.-P. Georges, A. 1990 Anomalous diffusion in disordered media: Statistical mechanisms, models and physical applications. Phys. Rep. 195, 127–293. (doi:10.1016/0370-1573(90)90099-N)
- [33] Craft, M. E., Volz, E., Packer, C. Meyers, L. A. 2011 Disease transmission in territorial populations: the small-world network of Serengeti lions. J. R. Soc. Interface 8, 776–786. (doi:10.1098/rsif.2010.0511)
- [34] Blackwell, P. G. 1997 Random diffusion models for animal movements. Ecol. Model. 100, 87–102. (doi:10.1016/S0304-3800(97)00153-1)
- [35] Boyer, D. Walsh, P. D. 2010 Modelling the mobility of living organisms in heterogeneous landscapes: does memory improve foraging success? Phil. Trans. R. Soc. A 368, 5645–5659. (doi: 10.1098/rsta.2010.0275)