Associative detachment of
Abstract
Using a merged beams apparatus we have measured the associative detachment (AD) reaction of for relative collision energies up to E eV. These data extend above the 1 eV limit of our earlier results. We have also updated our previous theoretical work to account for AD via the repulsive H potential energy surface and for the effects at eV on the experimental results due to the formation of H2 resonances lying above the separated atoms limit. Merging both experimental data sets, our results are in good agreement with our new theoretical calculations and confirm the prediction that this reaction essentially turns off for eV. Similar behavior has been predicted for the formation of protonium from collisions of antiprotons and hydrogen atoms.
pacs:
34.50.Lf, 52.20.Hv, 95.30.Ft, 97.10.BtI Introduction
One of the simplest molecular formation reactions is associative detachment (AD) via
| (1) |
This reaction is of interest for fundamental atomic and molecular physics and also because it plays an important role in protogalactic and first star formation in the early universe Glover1 ; Glover2 ; Holger . Two groups have recently reported measurements of this reaction. Martinez et al. Martinez measured the thermal rate coefficient at 300 K using a flowing afterglow technique. Our group has measured this reaction over a collision energy range from 4 meV to 1 eV using a merged-beams method Holger ; Bruhns1 ; Bruhns2 . Our results lie times above those of Martinez . The quoted uncertainty represents the quadrature sum of the estimated total experimental 1 confidence level for each measurement; and we have also taken into account minor corrections to our earlier data which are described below.
In Bruhns2 we hypothesized that this discrepancy is due to an error in the measured rate coefficient of Howard for
| (2) |
which Martinez used to determine their neutral H number density and thereby normalize their results. Our apparatus is not configured to study reaction (2) and test this hypothesis, but we have been able to extend our measurements of reaction (1) to higher energies and thereby provide additional benchmarks for theory. We have also investigated and ruled out several possible sources of systematic errors in our previous experimental results. Additionally we have more carefully considered the pressure dependence of our detection method. Lastly, we have updated our previous theoretical results of Holger ; Cizek to account for AD via the repulsive H state and for the effects at eV on the experimental results due to the formation of long-lived H2 resonances lying above the separated atoms limit.
The rest of the paper is organized as follows: Section II describes the experimental method and the various modifications performed for this work. Section III discusses the experimental uncertainties. Our new theoretical calculations are briefly described in Sec. IV. In Sec. V we present our results and compare them to theory. A discussion of our results is given in Sec. VI and a short summary in Sec. VII.
II Experiment
Here we briefly describe the experiment and the changes relevant to our new results. Further details about the apparatus and experimental method can be found in Holger ; Bruhns1 ; Bruhns2 .
II.1 Method
We begin by extracting H- from a duoplasmatron source and forming a beam with an energy of . Here is the unit charge, kV is the nominal source voltage, and is a small correction voltage defined below. Using standard ion optical elements, we shape, steer, and direct the beam into a photodetachment chamber which houses a floating cell biased to a potential . The anion energy inside the floating cell is . Near the center of the floating cell, we cross the anions with an infrared laser and convert a portion of the H- beam into a beam of ground state H atoms of energy . The resulting merged beams exit the floating cell, whereupon the H- beam returns to its initial energy while the H beam energy remains unchanged. The beam-beam interaction energy is controlled by varying .
Shortly after leaving the photodetachment chamber, the two beams enter an interaction region of length . Two beam profile monitors (BPMs) are used to determine the beam-beam overlap within the interaction region, where the axis is defined by the bulk velocity vectors of the co-propagating beams. We also use the BPMs to verify the alignment of the beam axes. The relative energy between the beams depends, in part, on this alignment and is given by Phaneuf as
| (3) |
Here is the reduced mass of the colliding system; and are the masses of the H- and H, respectively; and is the angle of intersection. is controlled by varying . This merged beams approach allows us to reach collision energies on the order of a few meV, limited only by the alignment of the beams, the spread in collision angles between the two beams, and the energy spread of each beam. We used geometrical simulations Holger ; Bruhns1 ; Bruhns2 to determine the average collision energy versus , taking into account the spreads in beam energies and angles.
Both beams are chopped out of phase in order to extract the signal H2 generated in the interaction region from various backgrounds. Any H2 formed in the interaction region has an energy of keV, neglecting the eV kinetic energy of the detached electron. At the end of this region, an electrostatic quadrupole deflector is used to direct the H- into a Faraday cup where the current I is read and recorded. The parent H and daughter H2 beams continue on into a gas cell kept at a helium pressure of Torr for most measurements. Inside the cell a fraction of the H2 is ionized by the stripping collisions forming keV H. Additionally, stripping of the H beam and dissociative ionization of the H2 can produce keV H+.
After the gas cell, the neutrals and resulting ions enter the analyzer region involving two double-focusing, electrostatic cylindrical deflectors in series Holger2 and a channel electron multiplier (CEM). A hole in the outer plate of the first or lower cylindrical deflector (LCD) allows neutrals to pass through and travel into a neutral detector. The neutral particle current , as measured in amperes, is monitored by measuring the secondary negative particle emission from the target inside the neutral detector. The voltages on the LCD and upper cylindrical deflector (UCD) are selected to transmit the 20 keV H signal ions into the CEM while rejecting any of the 10 keV H+ formed in the gas cell.
We study reaction (1) from the number of H ions detected in the CEM. Experimentally, we measure the cross section times the relative velocity between the H- and H beams convolved with the velocity spread of the experiment. This gives the rate coefficient Bruhns2
| (4) |
The left hand side average is over the experimental energy spread. On the right side, is the stripping cross section for H2 on He forming H; is the gas cell helium column density; is the background subtracted, pressure corrected H signal; is the transmittance of the combined LCD-UCD analyzer; is the transmittance of the grid in front of the CEM; is the CEM efficiency; and and are the velocities of the H- and H beams, respectively.
II.2 Modifications
The present work uses a current meter with a fast response time which enables us to directly measure the H- current at each phase in the chopping pattern, which is on the millisecond scale, and monitor it throughout each data run. Thus we are able to measure the anion current when the laser is on, , over the course of a data run. This is used for in Eq. (4). We were also able to monitor the anion current with the laser off, , and determine the attenuation factor
| (5) |
which is needed to extract the background corrected Bruhns2 . This situation is to be contrasted with our previous results Holger ; Bruhns2 where, due to equipment limitations, the H- current was averaged over the H- chopping cycle and the resulting was recorded using a slow current meter. As a result, for that work was not measured during data collection but under simulated data collection conditions and an average value was used. Additionally this factor was used to extract and from .
For the present work we are also using a new calibrated neutral detector in combination with a fast current amplifier to record the H particle current at each phase in the chopping pattern and to monitor it throughout each data run. This modification is described in Bruhns2 . Thus, during a data run, we are now able to directly measure which is needed in Eq. (4). In our previous work, the H particle current was also monitored with a fast current amplifier; however, the neutral detector was not designed for absolute measurements. So to analyze those results, using the new detector we measured the H particle current due to photodetachment (PD), , to determine the neutral-to-anion (nta) ratio
| (6) |
under simulated data collection conditions. This factor, combined with the extracted discussed above, was then used in Bruhns2 to determine for Eq. (4).
We have also installed a BPM immediately before the neutral detector, at a distance of 2055 mm from the first BPM in the interaction region. Turning off the voltage of the LCD, allows the H- beam to pass through the hole in the outer plate of the LCD. We used this additional BPM to measure the position of both the H and H- beams and verified the alignment of the beams over a much longer lever arm than was previously possible using only the two BPMs in the interaction region. We find that the full angle between the beam axes measured here is in good agreement with that reported in Bruhns2 .
II.3 Pressure corrections
Any H formed in the gas cell can be destroyed by subsequent collisions with He in either the gas cell or the analyzer region. The resulting products are not transmitted by the electrostatic deflectors into the CEM, thereby reducing the apparent signal and rate coefficient. This small systematic shift to our data was overlooked in our previous work Bruhns2 ; Holger . Here we quantified this minor correction for both our previous and present results.
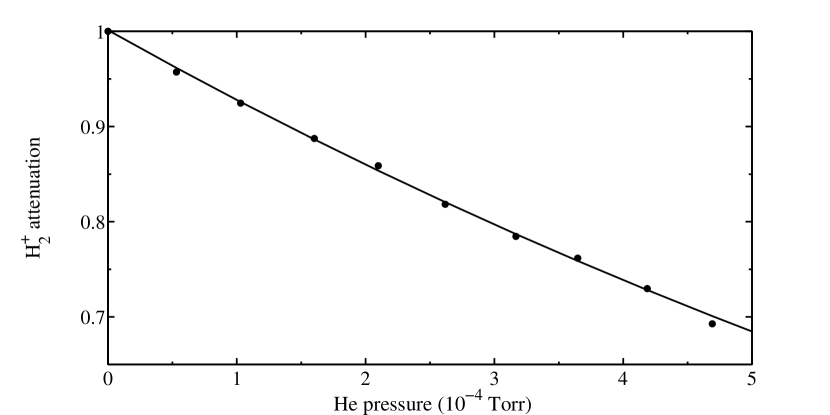
We measured the H attenuation using an approach similar to the one we used to determine the He gas cell column density in Bruhns2 ; Holger . Reconfiguring the ion source to produce H and the apparatus to transmit H beams, we used the electrostatic quadrupole after the interaction region to direct the beam into a Faraday cup where we measured the unattenuated H current, . We then guided the beam through the gas cell and measured the transmitted current, , on the outer plate of the UCD. With no He in the gas cell, the UCD reading was over 95% of that in the Faraday cup. The measured attenuated data were corrected for this slight difference in the unattenuated current readings.
The H attenuation as a function of gas density is given by
| (7) |
where is the total H destruction cross section and is the helium column density. Following the methodology of Bruhns2 , the column density can be expressed as
| (8) |
Here is the helium density and the infinitesimal path length. Using the same model as Bruhns2 , we take the pressure to be constant in each of these regions and re-express Eq. 8 as
| (9) |
The He density in the quadrupole is and the path length cm. In the gas cell the He density is and the path length cm. The He density in the analyzer region is and the path length cm is the distance that the ions travel before striking the UCD. All uncertainties here and throughout the paper are given at an estimated 1 statistical confidence level. The respective densities were calculated from the measured pressures using the ideal gas law at the laboratory temperature which was stabilized at 293 K for both the work of Holger ; Bruhns2 and our new results here. The ratio of the measured pressures in each section were and . The uncertainties in these ratios are due to the manufacturer-quoted accuracies of the pressure gauges (10% for and and 30% for ).
Attenuation data were collected for pressures up to Torr and are shown in Fig. 1. From a fit to these data we extracted a cross section of cm2 at an energy of 10 keV amu-1. This estimated uncertainty is due to the error in the attenuated and unattenuated current readings (3% each) and the uncertainty in the He column density (10%). The error in this latter quantity was estimated by adding the uncertainties from each segment of the total column density. The errors in the path lengths and gas densities (i.e., pressures) have been given above.
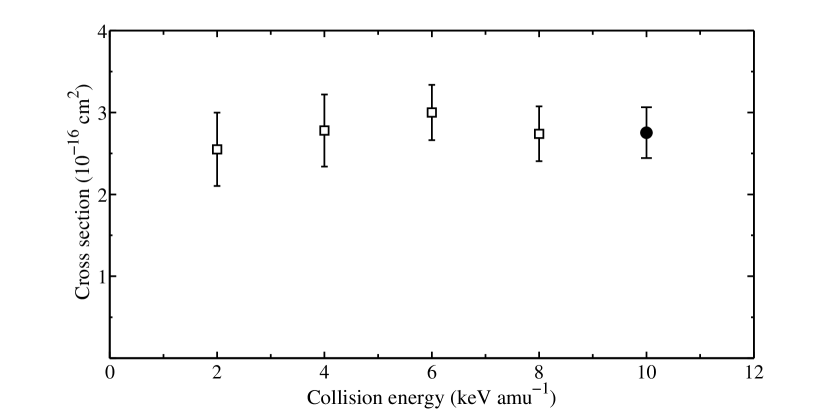
Collisional destruction of H has also been studied by Suzuki who reported cross sections of various outgoing channels for ion energies from 2 - 8 keV amu-1. We have derived a total destruction cross section by summing the relevant channels in Suzuki . Those results, shown in Fig. 2, indicate that the cross section is essentially constant between 2 and 8 keV amu-1. Our result at 10 keV amu-1, also shown in Fig. 2, is in good agreement with this trend.
To determine the expected signal attenuation factor and correct for the H signal loss we use our measured H destruction cross section combined with Eq. (7). The appropriate He column density is given by
| (10) |
where the factor of takes into account that on average the H ions will be formed in the center of the gas cell and cm is the distance from the end of the gas cell to the CEM mouth. Using these values we calculate from Eq. 7 that the signal attenuation with Torr He in the gas cell is . The signal must be divided by this factor to correct for the attenuation. This corresponds to an ()% upward shift in the data. The uncertainty in this correction is estimated by propagating through Eq. 7 the quadrature sum of the uncertainties from both in Eq. (10) and .
III Uncertainties
The various systematic uncertainties for the measurement are given in Table LABEL:tab:errors. Values are listed at an estimated statistical confidence level. We have grouped them into two sets. The errors listed in the top half of the table add in quadrature to % for each data point. This represents the relative uncertainty between our old and new data sets and also at different energies within each set. Adding this in quadrature with the remaining uncertainties in the bottom half of the table yields the total systematic error of . A detailed discussion is given in Holger ; Bruhns2 for the various uncertainties not already discussed here.
IV Theory
IV.1 Earlier calculations
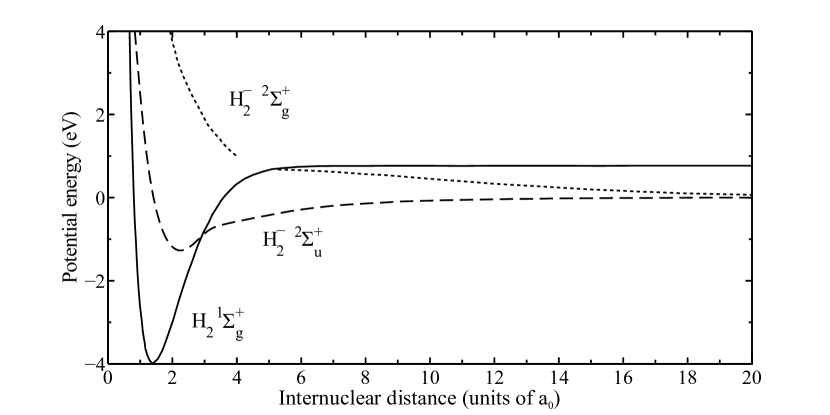
In our previous work, the AD cross section was calculated using non-local resonance theory and considering only the coupling of the and channels through the lowest metastable H state of symmetry (see Holger ; Cizek for details). This state is one of two connected to the asymptote (not counting the spin degeneracy). Potential energy curves for both states are shown in Fig. 3. The second state of the symmetry is repulsive and usually neglected in the calculations. The validity of this approximation is supported by the very good agreement between our experimental results Holger ; Bruhns2 and our non-local calculations Holger ; Cizek below 1 eV, even after the pressure correction of the H signal described in Sec. II.3 which was not accounted for in Holger ; Bruhns2 .
IV.2 New calculations
We have extended our experimental results to eV, entering a regime where AD via the state becomes possible. Figure 3 shows that for sufficiently large energies the colliding can penetrate into the autodetachment region along the repulsive state. This region is defined as the range of internuclear separations where an electron can escape the anionic system, i.e., the potential energy curves of the H system are above those for neutral H2. This occurs for the state at , where is the Bohr radius. Particles colliding along this state can penetrate into the autodetachment region for energies eV motivating calculations for AD via this state.
Due to the different symmetry of the molecular orbitals, the and contributions to the AD cross section can be calculated separately. Thus we need only carry out new calculations for the state. A brief description of our approach is presented below, using atomic units. A more detailed discussion will be given in a future publication.
Non-local resonance theory is explained in detail by d91 . The main idea is as follows. The electronic state , describing the colliding partners in the channel, is diabatically prolonged to small . It is also assumed to be coupled to the electronic continum states through the matrix element
where is the electronic Hamiltonian. The non-local resonance model is parametrized by three functions: , , and . The potential energy curve for the neutral molecule and for the anion , are functions only of . The coupling element , however, depends on both and the momentum of the detached electron .
Once , , and are known, the electronic dynamics of the system is fully parametrized and the nuclear dynamics can be treated as a motion in the non-local energy-dependent effective potential
is the kinetic energy operator for the nuclei, is the differential solid angle for the outgoing electron, and is the usual positive infinitesimal of scattering theory. We solve the nuclear dynamics and calculate the cross sections using the method of Cizek .
In order to include for the state, we have to fix the parameters of the non-local resonance model for this state. The proper procedure for calculating these parameters involves extracting the discrete state from the continuum , employing the projection-operator technique. This procedure was followed in mbd85 for the state and we used it as an input for our calculation Cizek . But it is also possible to fix the model parameters by fitting the fixed nuclei scattering data. We follow this latter procedure here.
To fix the coupling amplitude, we assume the separable form , where the dependence is determined by the Wigner threshold law Wigner with an exponential cut-off
| (11) |
where is the cut-off parameter. The angular momentum value in Eq. (11) is given by the lowest electron partial wave allowed by symmetry (discussed below). The dependence is determined from the calculated local decay widths of Stibbe1 . The potential energy curve for the anion is constructed from Stibbe1 ; Stibbe2 and extended to larger using the data of Bardsley . The data for the potential near the crossing of the neutral and anion potential energy curves are missing. Nevertheless the analytic behavior near the crossing has been discussed in detail by d91 . With this knowledge, the potential energy curve can be interpolated through the crossing as has been done before for hydrogen halides hx . The actual shape of the and crossing is modified by the interaction of the electron scattering continuum with the threshold behavior given by the Eq. (11). is from Wolniewicz .
The decay of the odd symmetry anion state to the even neutral state is possible only through release of an electron with odd angular momentum. In Holger ; Cizek we considered only (-wave scattering) since the calculations of Berm85a show that the next allowed contribution is suppressed by almost two orders of magnitude for the energy range of interest. For the anion state decaying to the neutral state, the symmetry remains unchanged, requiring release of an electron with even angular momentum. Here we considered only (-wave scattering). In each case, as Eq. 11 shows, is strongly suppressed for higher angular momenta at the values in our experimental results.
The anion state can also decay to the first excited state of H2. These states are both repulsive and lie very close together. This decay, however, requires an odd value for . With and , , and hence , is strongly suppressed compared to the to decay channel with . The effect from the transition between repulsive states is thus expected to be small at low energies and was not included here.
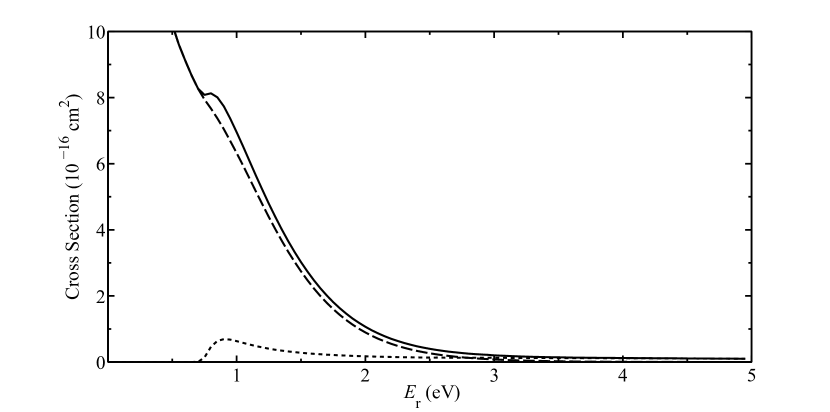
Once the model parameters are fixed, can be calculated using the methods described in Cizek . Figure 4 shows our results. As expected from the previous good agreement of our experimental and theoretical results, the new contribution is small and notable only for eV. This is the threshold where the colliding particles overcome the barrier in the repulsive interaction potential and penetrate into the autodetachment region.
Both the and contributions decay rapidly to zero for energies above eV. This is due to the competing process of collisional detachment
| (12) |
which opens up for eV and wins at higher energies. This is discussed in Sec. VI from the point of view of general energy conservation arguments.
IV.3 Contributions from quasi-bound H2 states
At high angular momentum (), the colliding H- and H systems can autodetach into quasi-bound H2. These states, sometimes referred to as orbiting or shape resonances, lie above the separated atoms limit for . Such high levels, temporarily stabilized by the centrifugal barrier, will eventually dissociate spontaneously and are therefore generally not considered in AD cross section calculations. However, the lifetime for all but a few of these resonances well exceeds the flight time from the interaction region to the gas cell and so most are expected to contribute to the experimental signal.
The H2 flight time from the interaction region to the gas cell is ns. The mean is the center-to-center distance, the upper limit is from the start of the interaction region to the end of the gas cell, and the lower limit from the end of the interaction region to the start of the gas cell. Quasi-bound H2 (i.e., in high levels) can strip in the He gas cell and will form H in similarly high levels. As the H potential supports stable ro-vibrational levels up to , we assume that any such H formed will be stable and will reach the detector.
In order to compare to our measured results, we have added the contribution of these quasi-bound H2 states to our calculations for AD via the state. So as to mimic the range of experimental lifetimes, we have investigated the effect of cutting out states with lifetimes less than 100, 700, and 1400 ns and found no significant differences. In the end we included contributions from all resonances with lifetimes longer than 700 ns. The contribution of these states is of comparable size to the state contribution. The effect of these resonances for AD via the state has not been considered as that would be a small correction to an already small contribution. Lastly, we note that the significance of these resonances for molecular hydrogen formation in plasma environments will depend on whether the states can relax to stable states of H2 before they dissociate by tunnelling.
V Results
Relative energies are controlled by varying the potential of the floating cell . In Holger ; Bruhns2 data were collected for V). Here we have extended the energy range to eV V). Data are collected by stepping in voltage. The present work uses voltage ranges smaller than our earlier measurements. For V, was scanned across 60 V ranges in 10 V steps and for V the scanning was across 120 V ranges in 20 V steps.
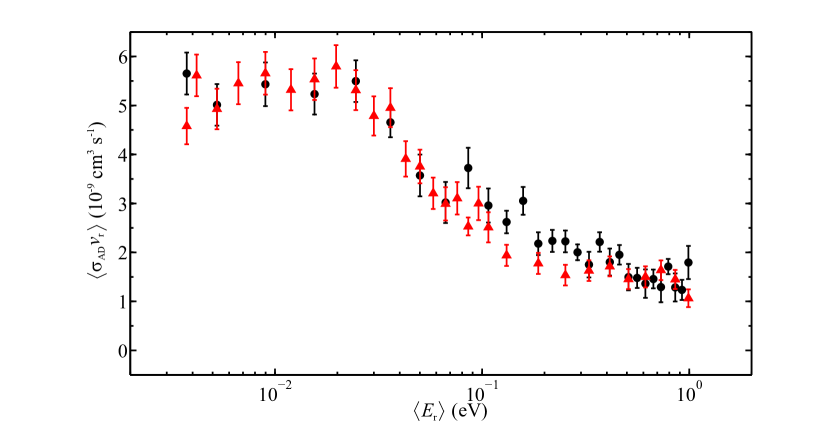
Our measured rate coefficients for reaction (1) are plotted in Fig. 5 as a function of average collision energy . The black circles represent our new results and the red triangles our previous work. Both have been corrected for the attenuation of the H ions. The error bars on each data point display the 1 statistical uncertainty. There is an additional relative systematic error on each data point which is not shown. The good agreement between our new and previous results indicates that there were no hidden systematic errors due to our previous inability to measure and monitor and during data acquisition.
A final potential source of systematic error which we investigated was to verify the linearity of the gas stripping method used to convert the product H2 molecules into the measured H signal. Here we measured the AD rate coefficient as a function of helium gas cell pressure for Torr. Table LABEL:tab:pressure shows the results of these AD measurements at meV versus pressure. Taking into account the attenuation of the H signal ions, to within the uncertainties the data show no dependence on gas cell pressure.
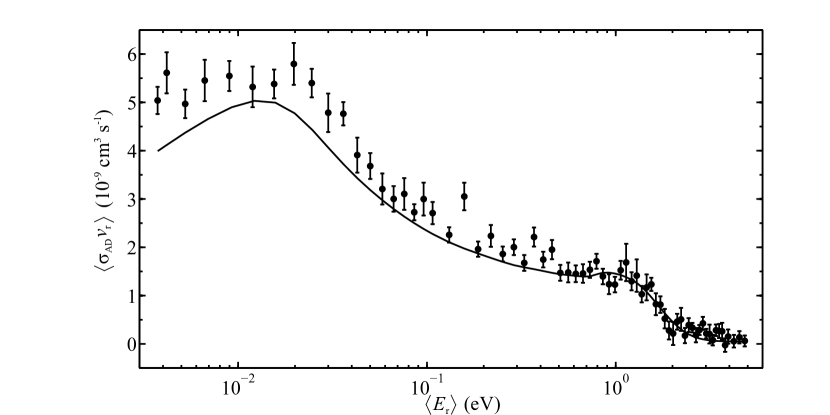
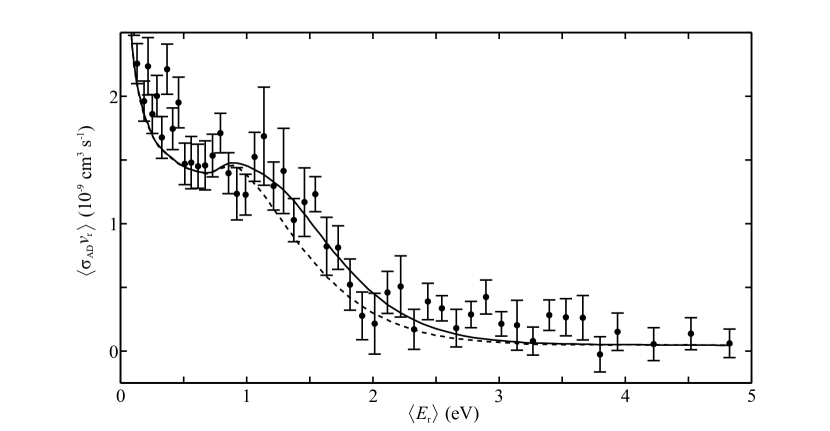
Given the good agreement between our results in Holger ; Bruhns2 and our new data, we have merged them together using a statistically-weighted averaging method. We also included our pressure test results in this average. The 1 counting statistics of each data point were used for the weighting. All data sets were also measured on the same relative energy grid. Figures 6 and 7 show the averaged data for eV plus the new data we have collected for . Also shown are the cross section calculations of Holger ; Cizek , supplemented by our new theoretical work here, multiplied by , and convolved with the experimental energy spread. Figure 7 shows the theoretical results with and without the effects of the H2 orbiting resonances included. As is clear from the figures, we find good agreement with theory throughout the measured energy range. The contribution due to orbiting resonances of H2 can also be seen in Fig. 7, as the experimental data are shifted to slightly higher energy compared to calculations which do not include these resonances.
VI Discussion
The good agreement that we find here both with our previous results and with our updated theory strengthens our confidence that theory and experiment have finally converged for reaction (1). Including AD via the repulsive state increases the cross section by an amount smaller than we are currently able to measure experimentally. The resulting theoretical thermal rate coefficient is only 1.3% larger than that for only the attractive state at temperatures of 4,000 K, 3.5% at 8,000 K and 4.4% larger at 10,000 K. These are significantly smaller than the experimental accuracy with which we have been able to benchmark theory. Hence, we continue to recommend the thermal rate coefficient of Holger for modeling plasma temperatures below K.
Additionally, our results continue to imply that the reason for the discrepancy seen with the results of Martinez lies in the data of Howard used for normalization. This is further supported by the theoretical AD work on hydrogen halides of Houf02a . They used the same theoretical approach as we do here and found systematically higher AD rate coefficients than the experimental work of Howard . It appears to us that a re-measurement of reaction (2) using a technique different from that of Howard is clearly called for to resolve this dilemma.
Our results also verify the predictions of Cizek and our new work here that the AD cross section for reaction (1) should decrease to essentially insignificant values for eV, as shown in Fig. 6. A simplified adiabatic description of the AD reaction can provide good insight into the physics behind this prediction. We consider here only the symmetry. Similar arguments can also be given for the state.
Initially the H- and H approach one another along the attractive electronic state. This state crosses into the autodetachment region at . Adiabatic theory dictates that the system remains electronically in the ground state. Inside the autodetachment region the ground state is the state of neutral H2 plus a free electron with zero kinetic energy. Conservation of energy requires that the final state energy equals that initially available
| (13) |
Here is the excitation energy of the vibrational level formed in the process; is the 4.48 eV dissociation energy gained by formation of H2 in the vibrational and rotational level Zhan ; and eV is the electron affinity required to neutralize the H- and form H Horacek . For , the system lies in the dissociation continuum (), resulting in the formation of and not .
In reality the AD process is not exactly adiabatic. This is manifested by the release of an electron with a nonzero kinetic energy and we can rewrite (13) as
| (14) |
The nonadiabatic exchange of energy between the electron and protons is weak though; detached electrons do not have a large kinetic energy. Our full calculations for the state Cizek show that only a negligible amount of electrons can have energy above eV. Taking into account that the largest possible value of will occur for , this leads to the prediction that the AD process will cease for eV. For reaction (1), this corresponds to eV. A similar argument has been suggested for the decrease in the cross section for protonium formation in collisions of antiprotons with hydrogen atoms (see Cohen for a review). Note that we have ignored the insignificant kinetic energy of the final H2 molecule , as conservation of momentum gives .
Continuing the protonium analogy, one would expect a sharp decrease in immediately after the collisional detachment threshold at eV. In the H- + H collision, the drop in the cross section occurs at higher energies. This is related to the threshold law given by Eq. (11) with for the dominant ungerade channel. As a result, the coupling vanishes for zero detached electron energy and rises smoothly as the energy increases. The electron energy in Eq. (14) thus can not be exactly zero, but remains relatively small. The smooth decrease in above 1 eV, confirmed by the present experiment, thus provides a good test of the theoretical description of the electron release amplitude.
VII Summary
We have modified the experimental methods used in Holger ; Bruhns1 ; Bruhns2 to measure reaction (1) up to Er 4.83 eV. Additionally, we have performed several modifications to better control potential systematic errors. We find good agreement between our previous and new data sets. To within the experimental uncertainties, we also continue to find good agreement with the calculations of Holger ; Cizek which have been extended here to include contributions from the repulsive H state and for the effects on the experimental results due to orbiting resonances of H2 for eV. In particular, we confirm the predictions of Cizek that this reaction turns off for eV. Similar behavior has been predicted for the formation of protonium from collisions of antiprotons and hydrogen atoms Cohen .
Acknowledgements.
The authors thank M. Lestinsky and S. A. Marino for stimulating discussions, and D. Thomas for his skilled machining work. This work was supported in part by NSF Grant Nos. CHE-0520660, AST-0606960, AST-0807436, and AST-0905832. H. Bruhns was supported in part by the German academic exchange service DAAD. M. Čížek and J. Eliášek were supported in part by Grant No. GACR 208/10/1281 from the Czeck Republic. X.U. acknowledges support from the Fund for Scientific Research (FNRS)References
- (1) S. C. Glover, D. W. Savin, and A. -K. Jappsen, Astrophys. J. 640, 2 (2006).
- (2) S. C. O. Glover and T. Abel, Mon. Not. R. Astron. Soc. 388, 4 (2008).
- (3) H. Kreckel, H. Bruhns, M. Čížek, S. C. O. Glover, K. A. Miller, X. Urbain, and D. W. Savin, Science 329, 69 (2010)
- (4) O. Martinez Jr., Z. Yang, N. B. Bettes, T. P. Snow, and V. M. Bierbaum, Astrophys. J. 705, L172 (2009).
- (5) H. Bruhns, H. Kreckel, K. Miller, M. Lestinsky, B. Seredyuk, W. Mitthumsiri, B. L. Schmitt, M. Schnell, X. Urbain, M. L. Rappaport, C. C. Havener, and D. W. Savin, Rev. Sci. Instrum. 81, 013112 (2010).
- (6) H. Bruhns, H. Kreckel, K. A. Miller, X. Urbain, and D. W. Savin, Phys. Rev. A 82, 042708 (2010).
- (7) C. J. Howard, F. C. Fehsenfeld, and M. McFarland, J. Chem. Phys. 60, 5086 (1974).
- (8) M. Čížek, J. Horáček, and W. Domcke, J. Phys. B 31, 2571 (1998).
- (9) R. A. Phaneuf, C. C. Havener, G. H. Dunn, and A. Müller, Rep. Prog. Phys. 62, 1143 (1999).
- (10) H. Kreckel, H. Bruhns, K. A. Miller, E. Wåhlin, A. Davis, S. Höckh, and D. W. Savin, Rev. Sci. Instrum. 81, 063304 (2010).
- (11) R. Browning, C. J. Latimer, and H. B. Gilbody J. Phys. B 3, 667 (1970).
- (12) T. J. Kvale, J. S. Allen, X. D. Fang, A. Sen, and R. Matulioniene, Phys. Rev. A 51, 1351 (1995).
- (13) Y. Suzuki, T. Kaneko, M. Tomita, and M. Sakisaka, Phys. Soc. Japan 55, 3037 (1986).
- (14) J. Senekowitsch, P. Rosmus, W. Domcke, and H.-J. Werner, Chem. Phys. Lett. 111, 211 (1984).
- (15) D. T. Stibbe and J. Tennyson, J. Phys. B 31, 815 (1998).
- (16) D. T. Stibbe and J. Tennyson, Chem. Phys. Lett. 308, 532 (1999).
- (17) J. N. Bardsley and J. M. Wadhera, Phys. Rev. A 20, 1398 (1979).
- (18) L. Wolniewicz, J. Chem. Phys. 103, 1792 (1995).
- (19) J. Horáček, M. Čížek, K. Houfek, P. Kolorenč, and W. Domcke, Phys. Rev. A 70, 052712 (2004).
- (20) W. Domcke, Phys. Rep. 208, 97 (1991).
- (21) M. Berman, C. Mundel, and W. Domcke, Phys. Rev. A 31, 641 (1985).
- (22) E. P. Wigner, Phys. Rev. 73, 1002 (1948).
- (23) M. Čížek, J. Horáček, and W. Domcke, Phys. Rev. A 60, 2873 (1999).
- (24) M. Berman, C. Mündel, and W. Domcke, Phys. Rev. A 31, 641 (1985).
- (25) K. Houfek, M. Čížek, and J. Horáček, Phys. Rev. A 66, 062702 (2002).
- (26) Y. P. Zhang, C. H. Cheng, J. T. Kim, J. Stanojevic, and E. E. Eyler, Phys. Rev. Lett. 92, 203003 (2004).
- (27) J. S. Cohen, Rep. Prog. Phys. 67, 1769 (2004).
| Source | Error (%) |
|---|---|
| Background subtraction | 5 |
| Anion current | 3 |
| Neutral current | 10 |
| Beam overlap | 3 |
| Total relative errors from above | 12 |
| Stripping cross section | 16 |
| Effects of unknown rovibrational population | 10 |
| Analyzer transmittance | 1 |
| Grid transmittance | 1 |
| CEM detection efficiency | 2 |
| Overlap length | 1 |
| Helium gas cell column density | 7 |
| H Attenuation | 1 |
| Total systematic uncertainty | 24 |
| Pressure (10-4 Torr) | Rate Coefficient (10cm3 s-1) | ||
|---|---|---|---|
| Value | Statistical Uncertainty | Relative Uncertainty | |
| 1.0 | 5.6 | 0.5 | 0.7 |
| 2.0 | 5.2 | 0.4 | 0.6 |
| 3.0 | 5.2 | 0.4 | 0.6 |
| Theory | 5.0 | - | - |