Laboratory for Astroparticle Physics, University of Nova Gorica,
Vipavska 13, SI-5000 Nova Gorica, Slovenia
Observatorio Pierre Auger, Av. San Martin Norte 304, 5613 Malargüe,
Argentina
Full author list: http://www.auger.org/archive/authors_2011_05.html
Email: auger_spokespersons@fnal.gov
\PACSes
\PACSit96.50.S-Cosmic rays
\PACSit96.50.sdExtensive air showers
\PACSit96.50.VgEnergetic particles
\PACSit13.85.TpCosmic rays (high-energy interactions)
The end of the cosmic ray spectrum
Abstract
Recent results from the Pierre Auger Observatory are presented, focusing on a measurement of the cosmic-ray energy spectrum above eV, cosmic-ray composition, and the anisotropy in the cosmic ray arrival directions.
The flux of cosmic rays can be well described by a broken power-law, with a flattening of the spectrum above eV and a softening of the spectrum beginning at about eV. The flux suppression at highest energies is consistent with the predictions of Greisen, and Zatsepin and Kuzmin. Longitudinal development of cosmic-ray air showers provides information on the mass of the primary particle. When compared to model predictions, our measurements of the mean and spread of the longitudinal position of the shower maximum are indicating a composition transition from light to heavier with increasing energy. For highest energies in our data-set we observe evidence for a correlation between the cosmic-ray arrival directions and the nearby extragalactic objects.
1 Introduction
The Pierre Auger Observatory [1] was designed to measure properties of the extensive air showers produced by cosmic rays with ultra-high energies above . Since the occurrence of these rare events is of the order of magnitude of 1 per per century, the Observatory has a large aperture in order to gather a statistically significant sample. The Observatory is featuring complementary detection techniques to lessen some of the systematic uncertainties associated with deducing properties of cosmic rays from air shower observables.
The Observatory is located in the vicinity of the small city Malargüe in Mendoza Province, Argentina, and began collecting data in 2004. The construction of the fundamental design was completed by the end of 2008. Until October 2010 the Observatory has collected around in exposure, which is significantly more than past cosmic-ray observatories combined. The Observatory is built around two types of detectors. Detectors on the ground sample air-shower particles as they arrive at the Earth’s surface, while fluorescence detectors are measuring the light emitted when air-shower particles excite nitrogen molecules in the atmosphere.
The surface array [2] consists of 1600 fully autonomous surface detector (SD) stations, each being a light-tight tank filled with 12 t of ultra-purified water observed by 3 photomultiplier tubes detecting the Cherenkov light produced as charged particles are traversing the water. The signals from the photomultipliers are read out with flash analog-to-digital converters with 40 MHz sampling and stamped by the GPS time, allowing for detailed study of the arrival-time profile of shower particles. The tanks are placed on a triangular grid with a 1.5 km spacing. The whole array covers an area of . The surface array operates with close to a 100% duty cycle, and the acceptance for events with energy above is nearly 100% [3].
The fluorescence detectors (FD) [4] are placed in 4 buildings, each hosting 6 telescopes overlooking the surface array. Each telescope is equipped with segmented mirror, focusing the fluorescence light entering through a 2.2 m diaphragm onto a camera made of 440 photomultiplier-tube pixels. The photomultiplier signals are sampled with 10 MHz, delivering a time profile of the shower as it develops through the atmosphere. The FD can be operated only in darkness (night) with clear sky conditions (low aerosol and cloud coverage), and has a duty cycle of approximately 10 to 15%. In contrast to the SD, the acceptance of FD depends strongly on the energy of the primary particle [5], and has an useful range extending down to around .
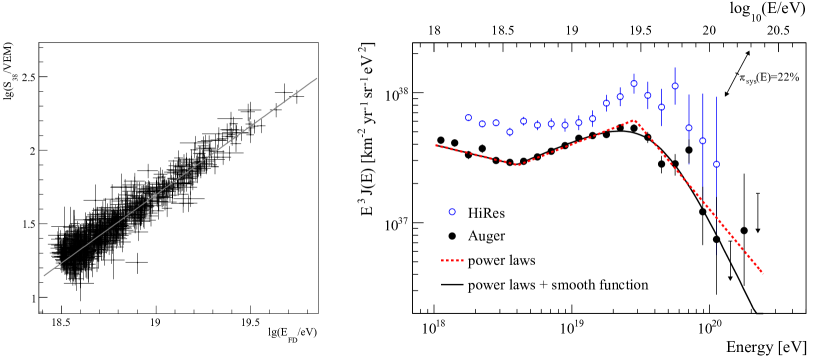
The two conceptually different detector systems provide complementary information about the particular air shower. The SD measures the lateral distribution and time structure of shower particles arriving at the ground, while the FD measures the longitudinal development of the shower through the atmosphere. Only a relatively small subset of showers is observed simultaneously by the SD and FD. These “hybrid” events are providing an invaluable calibration tool (see Fig. 1 – left). Particularly, the FD is performing a roughly colorimetric measurement of the shower energy since the amount of emitted fluorescence light is proportional to the deposited energy. On the other hand, the SD is extracting the shower energy through analysis of particle densities at the ground. These rely strongly on predictions of hadronic interaction models. Furthermore, we have to use model predictions describing physics at energies far beyond those accessible to current accelerator experiments, where the models have actually been tuned. Hybrid events therefore offer much more reliable estimate for a model-independent energy scale of the SD array. This is the crucial point in the successful design of the Pierre Auger Observatory since the SD has a much greater data sample than the FD due to the greater live time and coverage.
2 Energy Spectrum
Ultra-high energy cosmic-ray energy spectrum is one of the key parts in understanding the their origin and acceleration processes. These energies are up to eight orders of magnitude higher (or more than one order of magnitude higher in the center-of-mass energy) than those available from human-made accelerators like the LHC.
As noted above, the most reliable measurement of the primary energy is done by the observation of the fluorescence emission along the shower development path. Controlled atmosphere measurements in laboratories have determined the absolute yield of fluorescence photons per unit of energy deposit, their emission spectrum, and dependence on atmospheric parameters [6, 7]. Once the shower geometry is reconstructed from the projected light trace and timing of the FD telescope pixels and SD stations, the absolute light intensity as a function of atmospheric depth can be calculated. The total energy deposited in the atmosphere is obtained by the integral of over depth (see details in [8]).
For SD events the shower arrival direction is reconstructed from the relative timing of the signals in SD stations and proceeds with a fit of the lateral distribution of particle densities at ground. An estimator denotes the signal size at 1000 m from the shower core which was chosen to minimize the sensitivity to the shower-to-shower fluctuations and the unknown primary mass. will depend on the amount of atmosphere traversed by the shower and its attenuation is accounted for. The measured value is related to that expected at a chosen nominal zenith angle, in our case . The new quantity, , measured in equivalent units of a signal from a vertical muon (VEM) is plotted in Fig. 1 (left) vs. the absolute energy reconstructed from the FD. A fit of this correlation function then provides suitable energy calibration of the SD estimator.
The derived energy spectrum is presented in Fig. 1 (right). Simple power law fits indicate that the “ankle” is located at and the spectral break at with the power-law indices being , , and for the different regions, respectively. Within systematic uncertainties of about 20% for the determination of the primary energy, the Auger and HiRes [10] spectrum can be considered consistent. The usual interpretation of a spectral suppression at this energy is the Greisen-Zatsepin-Kuz’min (GZK) effect [11] and the loss of energy of heavy nuclei through the photo-disintegration on the cosmic microwave background (CMB). Nevertheless, the suppression could also be a result of cosmic-ray sources reaching their limits of acceleration. The ankle can be interpreted as the crossing point between the galactic and extragalactic origin of cosmic rays or, alternatively, as a feature caused by the pair production on CMB. This open question can be resolved by the measurements of the photon and neutrino fluxes predicted by the GZK effect.
3 Mass composition
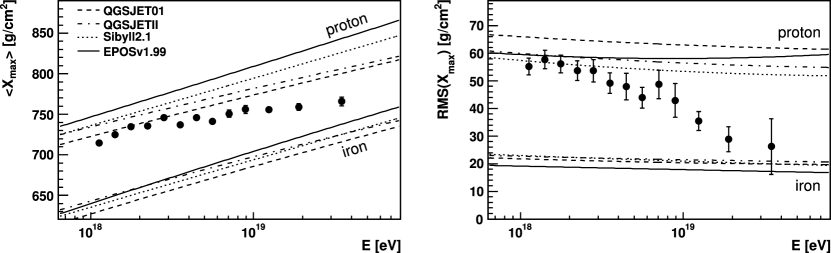
We have published results of FD measurements of the mean, , and the quadratic mean, , of the shower maximum distributions as a function of energy [12].
With FD detector the depth of shower development maximum, , is directly viewed for many showers. Nevertheless, with such measurements collective quantities have to be formed carefully in order not to bias the sample with the event selection and/or reconstruction, resulting in deviations of distributions from the reality. One of the more important potential biases is the limited observation range in elevation (also known as field-of-view). Each telescope views the sky ranging in elevation from to above horizon. Due to this limited field-of-view, showers occurring close to the telescope are not selected if they have a shallow so that the distribution can exhibit bias towards deeper showers. On the contrary, distant high-energy showers can be biased in the other direction, since deeply penetrating showers can hit the ground before the maximum is reached.
To study the magnitude and remove any potential biases the interior volume of the detecting medium is defined, excluding the external portion of the atmosphere, and applied to the data based on the shower geometry and energy. In these fiducial volume cuts a minimum range of viewable atmospheric depths is imposed so that all possible values are certainly detected and measured with good accuracy [13]. With these cuts, the analysis shows absence of bias using simulations of the detection and reconstruction of proton and iron primary particles (and their mixtures), so that and are well reproduced in the simulated shower sample. The typical measurement uncertainty of is obtained from the simulations and also verified by the real events. For sufficiently high energies (above ) a large fraction of showers are seen by two or more FD sites, so that can be measured independently. From this data we find that the typical measurement resolution around energy of is , which is in excellent agreement with the simulation result of [12]. This gives ground to trusting simulated measurement resolutions used at lower energies. The values given here are in quadrature subtracted by the detector resolution so that only the intrinsic variations are provided.
In Fig. 2 the behavior of the mean and RMS of the distribution is shown as a function of energy, compared with expectations from hadronic interaction models for proton and iron primary particles. The results favor a break in the elongation rate (defined as base-10 logarithmic slope ) at an energy of , close to the position of the “ankle” in the energy spectrum given above. For higher energies, the elongation rate becomes smaller, per decade, and is associated with a decreasing , both suggesting a possible change in the mass composition towards heavier nuclei.
Nevertheless, interpretation of these results requires comparison with simulations of air-shower development and the particular models for hadronic interactions employed by such simulations. In this light, the results described above can be (not very likely but still marginally probably) interpreted as composition being dominated by relatively light particles (protons) at highest energies but with some extreme changes in the underlying physics of interactions. All currently available models for these interactions are fits and extrapolations of accelerator data far beyond their nominal energies, e.g. the proton-air cross-section is derived from the - cross-section at center-of-mass energies of up to several , equivalent to a fixed-target energy of several . Investigations of the influence of changes to standard extrapolations of cross-section, multiplicity, and elasticity on air shower observables have shown [14] that it is easier to affect the mean of than to modify its fluctuations, and that out of the three parameters considered, the cross-section has the largest impact on , while extremely implausible changes are required to force proton showers appear like iron showers under current simulations.
4 Arrival Directions
Assuming that the highest-energy cosmic rays observed by the Pierre Auger Observatory are according to our current knowledge on the galactic and intergalactic magnetic fields exhibiting relatively unperturbed trajectories (a modus also known as the cosmic-ray astronomy), it is interesting to check if any anisotropy begins to emerge at these high energies so that the potentially uneven distribution of sources can be revealed. Furthermore, if the observed flux suppression is really a consequence of the GZK effect, there is an associated GZK horizon of the order of 100 Mpc, beyond which cosmic rays with starting energies near will be observed with much smaller energies. Since the matter density within our local cosmological neighborhood of about 100 Mpc is not isotropic, this opens a possibility to potentially detect the anisotropy in the recorded data sample. We have performed point source studies as well as harmonic analysis of arrival directions, which both characterize anisotropy at various angular scales [15].
One way to increase the chance of finding potential sources of ultra-high energy cosmic rays is to check for correlations between cosmic-ray arrival directions and known positions of interesting astrophysical candidates. However, care must be taken to appropriately take into account the reduction of statistical significance due to the repeated trials made in such procedures. Due to this, the Pierre Auger Collaboration decided to follow a predefined process. As first, an exploratory scan of the correlation between the data and various source catalogs has been performed, optimizing various parameters and cut choices. The results of this exploratory period were then used to design prescriptions used for the subsequently gathered data.
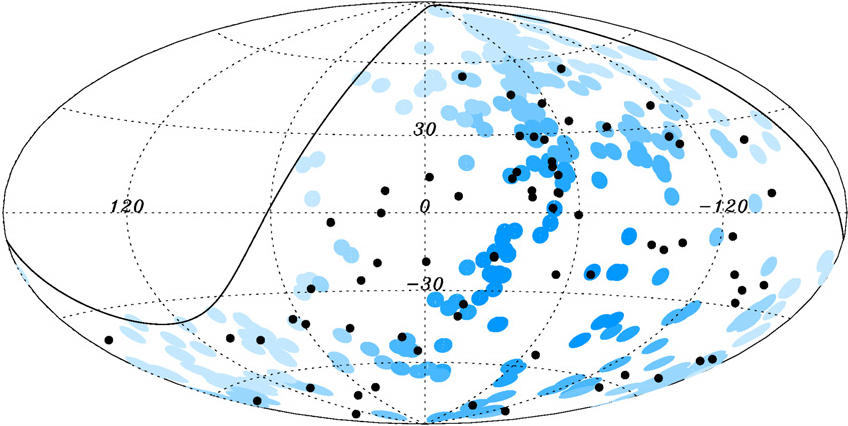
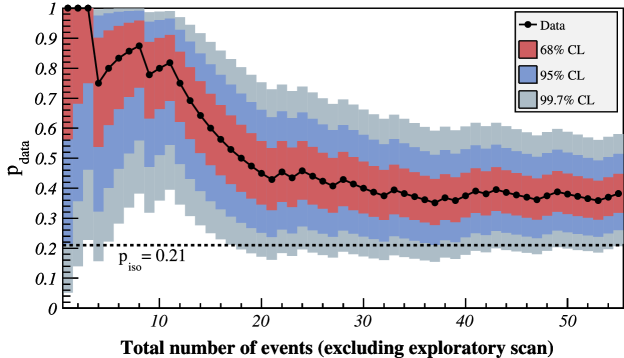
The resulting prescription was designed to test the correlation of events with energies larger than with objects in the Véron-Cetty & Véron catalog of active galactic nuclei. The prescription implied a search of large windows around nearby catalog objects with redshifts . The significance threshold set in the prescription was met in 2007 [16, 17] with 9 out of the 13 events in the sample correlating. The number of correlating events is now 21 out of 55, i.e. the correlating fraction is with 0.21 expected for isotropically distributed events [18]. A sky-map showing the locations of the events with energies above the cut is displayed in Fig. 3. The fraction of correlating events for the prescription period and for the following period is shown in Fig. 4. Compared to the initial results, the strength of the correlation appears to fall after the first 20 or so events, however, evidence for anisotropy currently remains at a stable fraction of with only to find by chance 21 or more of 55 events from an isotropic distribution correlating under these parametric conditions.
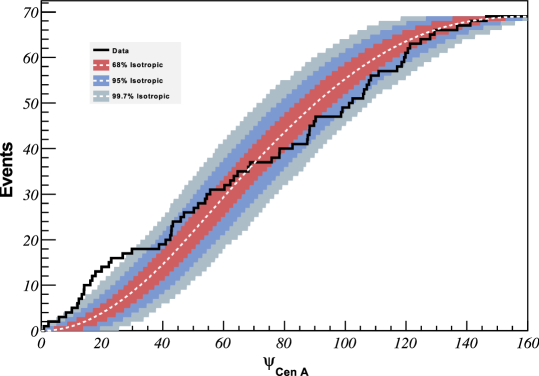
We have observed a number of other interesting correlations [18], including comparisons with other catalogs of astrophysical objects as well as a specific search around the direction towards Centaurus A (see Fig. 5). The maximum departure from isotropy occurs for a ring of around the object, in which 13 events are observed compared to an expectation of only 3.2 from isotropy. While these events could be coming from Centaurus A itself, which is only about 4 Mpc away, it is also possible that they originate in the Centaurus galaxy cluster at a distance of about 45 Mpc. Nevertheless, it is important to keep in mind that these are all a posteriori studies, an therefore without reliable confidence levels for anisotropy since the number of trials is unknown.
Acknowledgements.
Author would like to acknowledge the support from the Slovenian Ministry for Higher Education, Science, and Technology, and Slovenian Research Agency, and thank all the colleagues from the Pierre Auger collaboration for being involved and working together on this magnificent project.References
- [1] \BYAbraham J. et al. [Pierre Auger Collaboration] \TITLEProperties and performance of the prototype instrument for the Pierre Auger Observatory, \INNucl. Instrum. Meth. A523200450–95.
- [2] \BYAbraham J. et al. [Pierre Auger Collaboration] \TITLEOperations of and Future Plans for the Pierre Auger Observatory (Collection of Contributions to the 31st International Cosmic Ray Conference, Łódź, Poland, July 2009); [arXiv:0906.2354].
- [3] \BYAbraham J. et al. [Pierre Auger Collaboration] \TITLETrigger and aperture of the surface detector array of the Pierre Auger Observatory, \INNucl. Instrum. Meth. A613201029.
- [4] \BYAbraham J. et al. [Pierre Auger Collaboration] \TITLEThe Fluorescence Detector of the Pierre Auger Observatory, \INNucl. Instrum. Meth. A6202010227; [arXiv:0907.4282].
- [5] \BYAbreu P. et al. [Pierre Auger Collaboration] \TITLEThe exposure of the hybrid detector of the Pierre Auger Observatory, \INAstropart. Phys.342011368; [arXiv:1010.6162].
- [6] \BYAve M. et al. [AIRFLY Collaboration] \TITLEPrecise Measurement of the Absolute Yield of Fluorescence Photons in Atmospheric Gases, \INNucl. Phys. Proc. Suppl.212–2132011356-361; [arXiv:1101.3799].
- [7] \BYMonasor M., Vazquez J.R., Garcia-Pinto D., \atqueArqueros F. \TITLEThe impact of the air-fluorescence yield on the reconstructed shower parameters of ultra-high energy cosmic rays, \INAstropart. Phys.342011467-475; [arXiv:1010.3793].
- [8] \BYUnger M. [Pierre Auger Collaboration] \TITLEAnalysis of Longitudinal Air Shower Profiles measured by the Pierre Auger Observatory, Proc. of the International Symposium on the Recent Progress of Ultra-high Energy Cosmic Ray Observation 2010, Nagoya, Japan; [arXiv:1103.5857]; \BYUnger M., Dawson B.R., Engel R., Schüssler F., \atqueUlrich R. \TITLEReconstruction of longitudinal profiles of ultra-high energy cosmic ray showers from fluorescence and Cherenkov light measurements, \INNucl. Instr. Meth. A5882008433–441.
- [9] \BYAbraham J. et al. [Pierre Auger Collaboration] \TITLEMeasurement of the energy spectrum of cosmic rays above eV using the Pierre Auger Observatory, \INPhys. Lett. B6852010239–246; [arXiv:1002.1975].
- [10] \BYAbbasi R.U. et al. [HiRes Collaboration] \TITLEMeasurement of the Flux of Ultra High Energy Cosmic Rays by the Stereo Technique, \INAstropart. Phys.32200953–60.
- [11] \BYGreisen K. \TITLEEnd to the cosmic ray spectrum?, \INPhys. Rev. Lett.161966748; \BYZatsepin G.T. \atqueKuz’min V.A. \INPis’ma Zh. Eksp. Teor. Fiz.41966114.
- [12] \BYAbraham J. et al. [Pierre Auger Collaboration] \TITLEMeasurement of the Depth of Maximum of Extensive Air Showers above , \INPhys. Rev. Lett.1042010091101; [arXiv:1002.0699].
- [13] \BYUnger M. [Pierre Auger Collaboration] \TITLEComposition Studies with the Pierre Auger Observatory, \INNucl. Phys. B, Proc. Suppl.1902009240–246; \BYBellido J.A. [Pierre Auger Collaboration] \TITLEMass Composition Studies of the Highest Energy Cosmic Rays, \INProc. XXth Rencontres de Blois, The Gioi, Vietnam652008; [arXiv:0901.3389]
- [14] \BYUlrich R. et al. \TITLESensitivity of Extensive Air Showers to Features of Hadronic Interactions at Ultra-High Energies, Proc. 31st Int. Cosmic Ray Conf. (2009); [arXiv:0906.0418].
- [15] \BYAbraham J. et al. [Pierre Auger Collaboration] \TITLESearch for first harmonic modulation in the right ascension distribution of cosmic rays detected at the Pierre Auger Observatory, \INAstropart. Phys.432011627.
- [16] \BYAbraham J. et al. [Pierre Auger Collaboration] \TITLECorrelation of the highest energy cosmic rays with nearby extragalactic objects, \INScience3182007938–943; [arXiv:0711.2256];
- [17] \BYAbraham J. et al. [Pierre Auger Collaboration] \TITLECorrelation of the highest-energy cosmic rays with the positions of nearby active galactic nuclei, \INAstropart. Phys.292008188–204; [arXiv:0712.2843].
- [18] \BYAbreu P. et al. [Pierre Auger Collaboration] \TITLEUpdate on the correlation of the highest energy cosmic rays with nearby extragalactic matter, \INAstropart. Phys.342010314–326; [arXiv:1009.1855].