Negative magnetization of Li2Ni2Mo3O12 having a spin system composed of distorted honeycomb lattices and linear chains
Abstract
We studied magnetism of a spin-1 substance Li2Ni2Mo3O12. The spin system consists of distorted honeycomb lattices and linear chains of Ni2+ spins. Li+ ions enter about 25 % and 50 % of honeycomb and chain Ni sites, respectively, creating disorder in both the spin subsystems. A magnetic phase transition occurs at K in the zero magnetic field. In low magnetic fields, the magnetization increases rapidly below , decreases below 7 K, and finally becomes negative at low temperatures. We determined the magnetic structure using neutron powder diffraction results. The honeycomb lattices and linear chains show antiferromagnetic and ferromagnetic long-range order, respectively. We investigated static and dynamic magnetic properties using the local probe technique muon spin relaxation. We discuss the origin of the negative magnetization.
pacs:
75.25.-j, 75.30.Cr, 75.40.Cx, 75.47.Lx, 76.75.+iI INTRODUCTION
Several antiferromagnets having plural magnetic ions or magnetic-ion sites show an interesting magnetic long-range order (LRO). In Cu2Fe2Ge4O13, Cu2+ spin dimers (spin 1/2) are coupled to Fe3+ spin chains (spin 5/2).Masuda04 ; Masuda05 An indirect Fe-Fe exchange coupling via Cu dimers was observed.Masuda07 This result reveals that the Cu dimers play the role of nonmagnetic media in the indirect magnetic interaction. Dynamics of dimer excitation in staggered and random fields generated by Fe spins are also experimentally identified.Masuda09 In Cu3Mo2O9, three crystallographically independent Cu2+ sites exist (Cu1, Cu2, and Cu3). Spins (1/2) on Cu1 sites form antiferromagnetic (AFM) chains.Hamasaki08 Two spins on neighboring Cu2 and Cu3 sites form an AFM dimer. Each AFM chain is coupled to AFM dimers. Only a component parallel to the axis of magnetic moments on Cu1 sites is ordered below the AFM transition temperature K in the zero magnetic field.Hamasaki08 Perpendicular components are ordered in magnetic fields parallel to the or axis. A canted AFM LRO is stabilized only in finite magnetic fields. It is inferred that magnetic competition causes this unique LRO. In addition, the canted AFM LRO disappears in Cu3Mo2O9 with a very small amount doping (e.g., 0.2 % Zn for Cu sites).Hase08
Negative magnetization is an interesting phenomena. It was first observed in Li0.5(FeCr)2.5O4 spinels Gorter53 and was explained using the Néel model.Neel48 In this model, two collinear sublattice magnetizations ( and ) with different temperature () dependence are considered. is larger than below , while is larger than below a compensation temperature . If directions of the sublattice magnetizations are fixed, magnetization is observed as a negative value below . Several compounds showing negative magnetization have been found. Some of them are considered to be explainable by the Néel model,Menyuk60 ; Yasukochi60 ; Schulkes63 ; Luthi66 ; Abe71 ; Zakaria05 ; Kimishima00 ; Kimishima05 ; Ivanov03 ; Hashimoto05 while for the other compounds the origin is different or has not been determined explicitly.Cooke74 ; Washimiya78 ; Yoshii01a ; Yoshii00 ; Yoshii01b ; Khomchenko08 ; Andrzejewski06 ; Shirakawa91 ; Mahajan92 ; Nguyen95 ; Ren98 ; Ren00 ; Blake02 ; Adachi99 ; Singh08a ; Singh08b ; Singh10a ; Singh10b ; Duman02 Details of the origins will be described later.
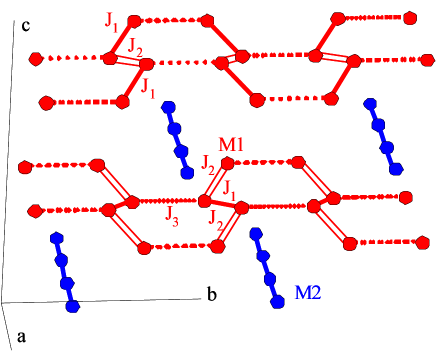
We have paid our attention to Li2Ni2Mo3O12. Two crystallographically independent Ni2+ (spin 1) sites exist (M1 and M2) as represented in Fig. 1.Ozima77 The M1 and M2 sites form distorted honeycomb lattices and linear chains, respectively. About 25 % of M1 sites and about 50 % of M2 sites are occupied by non-magnetic Li+ ions as shown by the formula Li(Li0.5Ni1.5)(Li0.5Ni0.5)Mo3O12. Unexpectedly, we found negative magnetization at low . To investigate the origin of the negative magnetization, we determined the magnetic structure of Li2Ni2Mo3O12 using the neutron powder diffraction technique and determined its static and dynamic magnetic properties using the local probe technique muon spin relaxation (SR).
II Experimental Methods
Crystalline powder of Li2Ni2Mo3O12 was synthesized using a solid-state-reaction method at 973 K in air for 144 h with intermediate grindings. We used an isotope 7Li (purity: 99 %) for neutron-diffraction samples to decrease absorption of neutrons. We confirmed formation of Li2Ni2Mo3O12 using an X-ray diffractometer (JDX-3500; JEOL). Li2Ni2Mo3O12 is insulating at room temperature.
We measured magnetization using a superconducting quantum interference device (SQUID) magnetometer (MPMS-5S; Quantum Design). We entered powder in paraffin molten by heating in the zero magnetic field and fixed finally the powder in solid paraffin. We measured magnetization of the powder embedded in solid paraffin. Probably, powder directions are randomly distributed and powder reorientation does not occur in the magnetization measurements. Specific heat was measured using relaxation technique with Physical Property Measurement System (PPMS; Quantum Design). We used a sintered pellet in the specific-heat measurements.
We determined the magnetic structure of 7Li2Ni2Mo3O12 from neutron powder diffraction data. The experiments were conducted using the high-resolution powder diffractometer for thermal neutrons HRPT hrpt (wavelength Å) and the high-intensity cold neutron powder diffractometer DMC ( Å) at the Swiss spallation neutron source SINQ in PSI. Powder was filled into a vanadium container with 8 mm diameter and 55 mm height. Rietveld refinements of diffraction data were performed using the FULLPROF Suite program package.Rodriguez93 Symmetry analyses of possible magnetic configurations were conducted using the program BASIREP in the FULLPROF Suite program package.
The muon spin relaxation (SR) measurements were performed using the Dolly spectrometer at the E1 beamline at the Swiss Muon Source (SS) in PSI. In a SR experiment nearly 100 % spin-polarized muons are implanted into the sample one at a time. The positively charged thermalize at interstitial lattice sites, where they act as magnetic micro probes. In a magnetic material the muon spin precesses about the local magnetic field at the muon site with the Larmor frequency (muon gyromagnetic ratio MHz T-1). With a lifetime of s the muon decays into two neutrinos and a positron, the latter being predominantly emitted along the direction of the muon spin at the moment of the decay. Measurement of both the direction of positron emission as well as the time between muon implantation and positron detection for an ensemble of several millions of muons provides the time evolution of the muon spin polarization along the initial muon spin direction. In a powder, 2/3 of the local magnetic field components are perpendicular to the spin and cause a precession, while the 1/3 longitudinal field components do not. The damping of the oscillation is a measure of the width of the static field distribution experienced by the muon ensemble. In a static magnetic environment, the 1/3 fraction of the muon spin polarization is conserved. In a dynamic magnetic materials however also this so-called 1/3-tail relaxes and the relaxation rate can be, in certain limits, related to magnetic fluctuation rates. Since SR is a local probe technique, the amplitudes of the different signals observed are a measure of the corresponding volume fractions. With this, it provides a direct measure of magnetic volumes which is not easily possible with scattering techniques. For further details of the SR technique, we refer to the recent review in Ref. Yaouanc .
III Experimental Results
Figure 2 portrays the dependence of the specific heat in the zero magnetic field. A peak is apparent at 8.0 K. As it will be shown later, magnetization increases rapidly on cooling below 8.0 K. Therefore, the peak indicates occurrence of a magnetic phase transition at K.
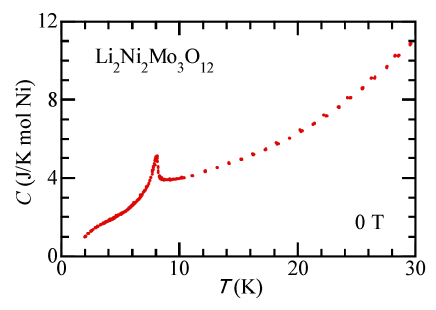
Figure 3 (a) shows the dependence of the magnetization of Li2Ni2Mo3O12 in a very weak residual magnetic field. The value of the magnetic field was estimated as T (0.63 Oe) from paramagnetic magnetization values in this field and 0.1 T. The magnetization increases rapidly below 8.2 K, shows a maximum around 7.2 K, and decreases below 7.2 K. It should be noted that the magnetization is negative below 4.2 K. We did not observe any difference between magnetizations measured for increasing and decreasing . Figure 4 represents the magnetic field dependence of at 1.7 K after the residual field cooling process. We can see a small residual magnetization and hysteresis. The rapid increase below 8.2 K and small residual magnetization indicate appearance of a canted AFM LRO or ferromagnetic (FM) LRO with small magnetic moments. Figure 3 (b) shows the dependence of in the field of T. We can see a hysteresis between magnetizations measured in the residual field cooling (RFC) and field cooling (FC) processes. The absolute value of in the FC process is larger than that in the RFC process. In 0.1 T [Fig. 3(d)], only the FC magnetization becomes negative. In 0.2 T [Fig. 3(e)], both the RFC and FC magnetizations are positive. In 1 T [Fig. 3(f)], the hysteresis is small. Figure 3 (g) shows the dependence of paramagnetic susceptibility in 0.1 T. The susceptibility above 20 K obeys the Curie-Weiss law. We determined the value of the Curie constant as 1.12 emu K/mol Ni from the data above 200 K. The value was calculated as 2.11 on the assumption that the spin value is 1. This value is reasonable for Ni2+ spins.
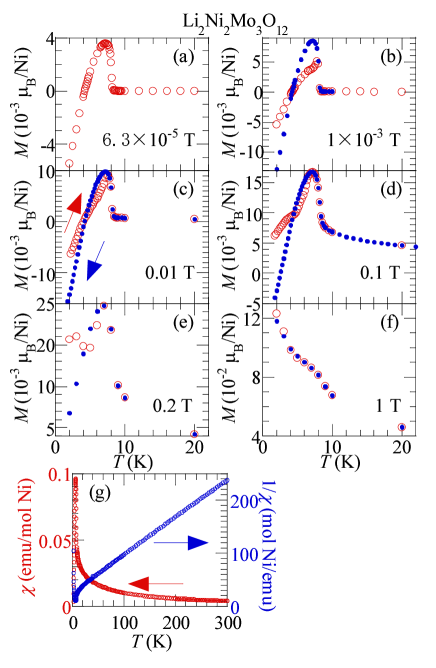
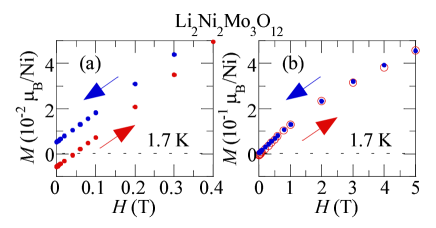
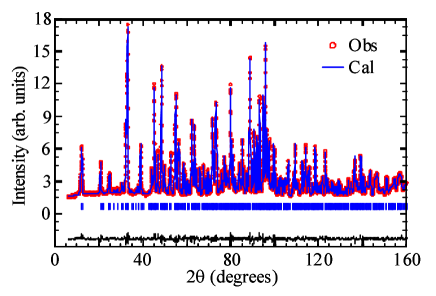
Figure 5 depicts the neutron powder diffraction pattern of paramagnetic 7Li2Ni2Mo3O12 recorded using the HRPT diffractometer with Å at 10 K, which is slightly higher than K. The refinement based on the crystal structure of Li2Ni2Mo3O12 as determined by room temperature single-crystal X-ray diffraction Ozima77 well fits the experimental neutron diffraction pattern at 10 K. Structural parameters are presented in Table I.
| Atom | Site | Å2 | Occupancy | |||
|---|---|---|---|---|---|---|
| Ni1 | 8d | 0.7473(3) | 0.4302(1) | 0.0258(1) | 0.27(3) | 0.757(2) |
| Li1 | 8d | 0.7473(3) | 0.4302(1) | 0.0258(1) | 0.27(3) | 0.243(2) |
| Ni2 | 4c | 0.3881(6) | 0.75 | 0.2497(2) | 0.27(3) | 0.566(2) |
| Li2 | 4c | 0.3881(6) | 0.75 | 0.2497(2) | 0.27(3) | 0.434(2) |
| Li3 | 4c | 0.7562(13) | 0.25 | 0.1967(3) | 0.27(3) | |
| Mo1 | 4c | 0.7149(4) | 0.75 | 0.0562(1) | 0.06(2) | |
| Mo2 | 8d | 0.2225(3) | 0.4739(1) | 0.1562(1) | 0.06(2) | |
| O1 | 4c | 0.5657(5) | 0.25 | 0.0064(1) | 0.29(2) | |
| O2 | 4c | 0.6353(5) | 0.75 | 0.1544(1) | 0.29(2) | |
| O3 | 8d | 0.1383(4) | 0.6184(2) | 0.2050(1) | 0.29(2) | |
| O4 | 8d | 0.4233(4) | 0.3779(2) | 0.2137(1) | 0.29(2) | |
| O5 | 8d | 0.9411(4) | 0.3864(2) | 0.1256(1) | 0.29(2) | |
| O6 | 8d | 0.4214(4) | 0.5122(2) | 0.0740(1) | 0.29(2) | |
| O7 | 8d | 0.9163(4) | 0.6146(2) | 0.0363(1) | 0.29(2) |
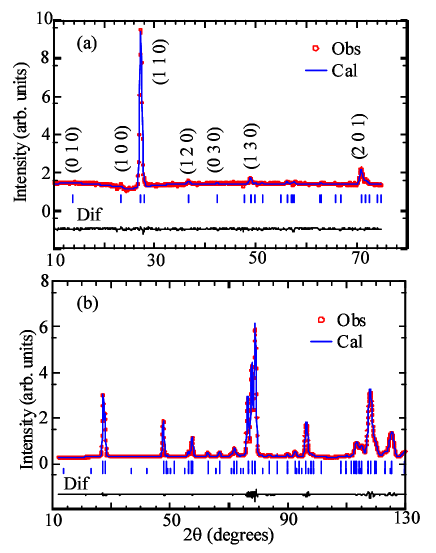
Figure 6(a) shows difference between two neutron powder diffraction patterns of 7Li2Ni2Mo3O12 at 2.0 K and 10 K collected using the DMC diffractometer ( Å). The reflections of the difference pattern can be indexed in the chemical cell with the propagation vector . The profile matching le Bail fit, in which the integral intensities are the refined parameters, shows that all the peaks are well described with k = 0 with the reliability factors , , and . The new reflections appear below . Therefore, they must be magnetic reflections.
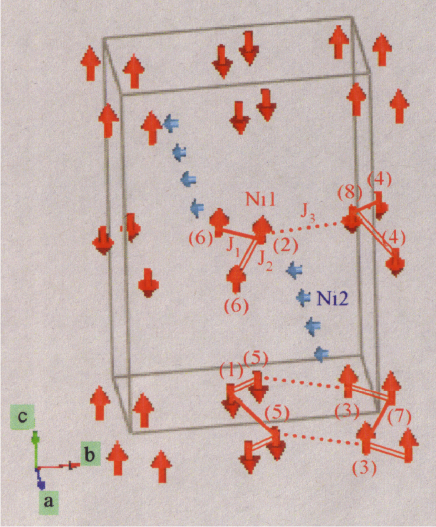
Using the determined propagation vector, we performed a symmetry analysis according to Izyumov et al.Izyumov91 to derive possible magnetic configurations for the space group . The space group has eight one dimensional irreducible representations (IRs). The observed magnetic patterns were compared with calculated patterns using the structural parameters determined from the structural refinement. After sorting out the basis functions of all eight IRs, we found that only well fits the experimental pattern. The IR has the following characters 1, -1, 1, -1, 1, -1, 1, -1 for the symmetry elements listed in the caption of Fig. 7. The magnetic moments of Ni2 atoms are restricted by symmetry to be parallel to -axis, thus forming a ferromagnetic sublattice. The -components of Ni1 spins are also forced to be ferromagnetically aligned, whereas the spins in -plane have antiferromagnetic configuration with basis vectors listed in the caption of Fig. 7.
In the refinement of the magnetic structure, all the atom structure parameters were fixed by the values obtained from HRPT data (Table I). The magnetic structure is depicted in Fig. 7. The magnetic moment at the Ni1(1) position is (0.27(4), 0.04(12), -1.58(3)) and its magnitude is 1.60(3) at 2.0 K . The ordered Ni1 moment mainly points along the direction with a small component along the direction. The size of the ferromagnetic component is refined to a small value close to zero within experimental errorbars. The arrangement of the moments indicates that the , , and interactions are FM, FM, and AFM, respectively. The magnetic moment at the Ni2(1) position is (0, -0.6(1), 0). Ni2 moments form the FM LRO. The Ni2 moment is reduced in comparison with ordinary ordered Ni2+ moments. The reduction may be caused by the one dimensionality of the Ni2 spin system and large disorder due to about 50 % substitution of Li ions.
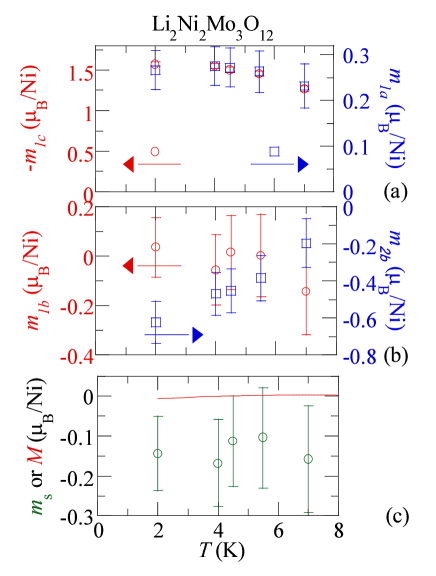
The IR well fits experimental data for all the measured temperatures. Figure 8 shows the dependence of the magnetic moments. The absolute value of the FM component increases monotonically with decreasing . The AFM components and have significantly weaker dependence of temperature with step like change at . The FM component stays close to zero with slight tendency to increase.
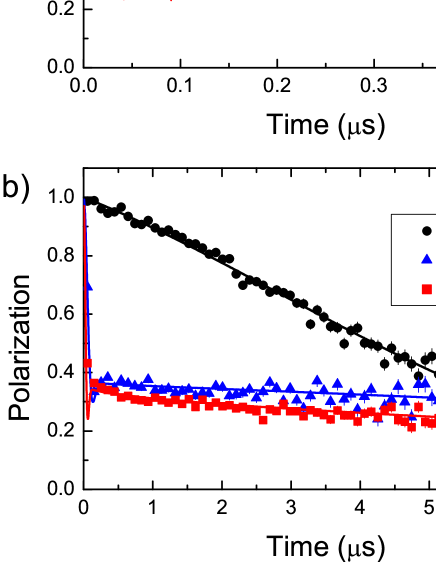
To further elucidate the static and dynamic magnetic properties of Li2Ni2Mo3O12, we performed zero field SR experiments for various temperatures. In Fig. 9 zero field SR spectra are shown for characteristic temperature above and below K. Figures 9 (a) and (b) show the same data but plotted on different time scales to highlight the observed changes for the fast and slow relaxing signals. At high temperatures a slowly relaxing spectrum of Gauss-Kubo-Toyabe form kubo is observed. This is the fingerprint of a non-magnetic material. The small Gaussian relaxation is due to static random nuclear moments only. Below K an over-damped spontaneous muon spin precession is observed, indicating a very broad field distribution at the muon site(s), i.e. a complicated or disordered magnetic structure or many muon sites in the crystallographic lattice. This result is consistent with structural disorder caused by Li ions.
The SR spectra have been fitted using the following functional form for the polarization function:
| (1) |
with
| (2) |
and
| (3) |
Here and represent the relaxation functions for the magnetic () and non-magnetic () volume fractions with their corresponding relaxation rates and , respectively. is the dynamic relaxation rate.
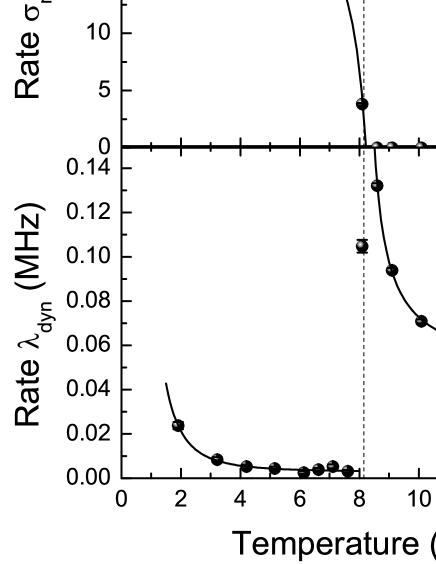
Figure 10 shows the obtained parameter values from the fits using the above equations. A sharp magnetic transition at K is observed in all the parameters. The magnetic fraction reaches 100 % shortly below . The magnetic order parameter measured via the SR frequency as well as the static field width continuously increase below . The values of are larger than the values of , indicating the very broad width of the internal field distribution. Approaching the transition from above an additional exponential damping which increases towards is observed. This is typical for the slowing down of electronic moments approaching . The corresponding dynamical relaxation rate is shown in Fig. 10 (d). Below the transition is nearly zero indicating a static magnetic state. Decreasing the temperature further, a dynamic relaxation of the 1/3 tail is observed again. This is already clearly visibly from the comparison of the SR spectra at 7.6 K and 1.9 K in Fig. 9 (b). The dynamic relaxation at low temperature had to be fitted with a root-exponential time dependence (Eq. 3), which is indicative of a broad distribution of fluctuation times. Interestingly, the dynamic relaxation rate starts to increase below K where the magnetization becomes negative.
IV Discussion
Let us consider the origin of the negative magnetization in Li2Ni2Mo3O12. The Néel model requires two FM sublattices that in our case are formed by the and components. The values of are negative. The values of are very small and show both the signs. At 2.0 K, the error bar of is the smallest and the value of is positive. Therefore, if the dependence of is similar to that of or , may be intrinsically positive. Compensation of and is possible. The sublattice magnetizations and defined in the Introduction correspond to and , respectively. has a weaker dependence than in the Néel model. If is proportional to or , has a weaker dependence than as the Néel model. We calculated the average spontaneous magnetization per Ni and plotted it together with the RFC magnetization in Fig. 8(c). Here, the proportion coefficient is calculated from the occupancies listed in Table I. The contribution of is large in because of the large number of Ni1 atoms. Although the component shows well defined decrease with temperature lowering [Fig. 8(b)], is practically constant [Fig. 8(c)]. The difference in the dependence of and suggests compensation of the FM components. A reversal of , however, was not obtained. The absolute values of seem much larger than the absolute values of the RFC magnetization represented by the solid line in Fig. 8(c).
The negative magnetization is too small to be detected using neutron powder diffraction techniques. Therefore, we could not verify the validity of the Néel model. The magnetic scattering length was calculated as fm using a Born approximation. Here, and are the value and magnitude of ordered spins, respectively. is the magnetic form factor and its magnitude is in the order of unity or less. The nuclear coherent scattering length of Ni was obtained as 10.3 fm (natural average).NeutronDataBooklet The intensity of Bragg peaks is proportional to the square of scattering lengths. The lower limit of magnetic moments that can be evaluated in neutron powder diffraction experiments is about 0.1 . As is seen in Fig. 8, error bars are in the order of 0.1 .
The following four alternative models may be considered as the candidates for explanation of the negative magnetization effect. In model 1 applicable to GdCrO3 or (LaRE)CrO3 (RE = Pr or Nd),Cooke74 ; Washimiya78 ; Yoshii01a ; Yoshii00 ; Yoshii01b ; Khomchenko08 magnetic moments of Cr ions form a canted AFM LRO, while RE ions are paramagnetic. A Dzyaloshinskii-Moriya (DM) interaction exists between Cr and RE spins. The main () component of the Cr moment produces an internal magnetic field parallel to the direction on RE ions. The polarization of paramagnetic moments on RE ions induced by the internal magnetic field is aligned opposite to the canted components parallel to the direction. Magnitude of sum of the canted components is larger than magnitude of sum of the polarization of the paramagnetic magnetization below , while the latter becomes larger than the former below . The direction of the main component of the Cr moments is fixed. Therefore, the direction of the canted component is also fixed. As a result, the negative magnetization appears in GdCrO3 or (LaRE)CrO3 (RE = Pr or Nd). In Li2Ni2Mo3O12, the distance between Ni1 and Ni2 sites is larger than 5.19 Å. Probably, exchange interactions between Ni1 and Ni2 spins are weak. Internal magnetic fields produced by Ni1 (Ni2) moments on Ni2 (Ni1) sites are small. Accordingly, the negative magnetization in Li2Ni2Mo3O12 cannot be explained by the model 1.
In model 2 applicable to LaVO3 Shirakawa91 ; Mahajan92 ; Nguyen95 or YVO3,Ren98 ; Ren00 ; Blake02 only the canted component of the magnetic moment on V ions reverses and becomes anti-parallel to external fields. Therefore, the negative magnetization was observed. In LaVO3, a structural phase transition occurs just below due to the Jahn-Teller effect. As a result, the DM vector reverses and therefore the canted component of the magnetic moment reverses. In YVO3, the canting direction is determined mainly by the single-ion anisotropy at high and by the DM interaction at low . As a result, the canting direction reverses at low . In Li2Ni2Mo3O12, LRO of Ni2 spins is the FM order (not canted AFM order). Consequently, the model 2 cannot account for the negative magnetization in Li2Ni2Mo3O12.
In model 3 applicable to (SmGd)Al2,Adachi99 compensation between the spin and the orbital parts of the ordered moments occurs. We observe a sum of spin and orbital magnetic moments. Therefore, the results in Fig. 8 indicate directly that compensation between the spin and the orbital parts of the ordered moments is not the origin of the negative magnetization. In addition, in 3d shells, only spin magnetic moments exist because of quenching of the orbital angular momentum.
In model 4 possibly applicable to Sr2RERuO6 (RE= Yb, Y or Lu),Singh08a ; Singh08b ; Singh10a ; Singh10b exchange bias (EB) effects Nogues99 may cause negative magnetization. The effects can appear in composites having both FM and AFM LROs. Ordered magnetic moments of the two LROs should be collinear. The FM transition temperature should be higher than the AFM transition temperature. In Li2Ni2Mo3O12, however, Ni1 and Ni2 moments are nearly perpendicular to each other. Only one transition was observed within experimental accuracy. In addition, distances in Ni1 - Ni2 bonds are larger than 5.19 Å, suggesting that interactions between Ni1 and Ni2 spins are weak. Consequently, EB effects cannot account for the negative magnetization in Li2Ni2Mo3O12.
At present, we think that the Néel model may be valid for the negative magnetization in Li2Ni2Mo3O12, although we cannot prove the validity of the Néel model. We cannot deny perfectly possibility of another (unknown) origin. As was described in the SR results, the dynamic relaxation rate starts to increase below K where the magnetization becomes negative. It is tempting to conclude that the magnetization inversion mechanism involves a dynamical process. As another idea, a structural change, which is not detected, may cause reversal of . Experimental investigations into Li2Ni2Mo3O12 using other techniques and further theoretical considerations are necessary.
V Summary
We studied magnetism of the spin-1 substance Li2Ni2Mo3O12. The spin system is composed of the distorted honeycomb lattices and linear chains formed by two distinct Ni2+ sites, Ni1 and Ni2 sites, respectively. Li+ ions substitute about 25 % and 50 % of the honeycomb and chain Ni sites, respectively, creating the disorder in both the spin subsystems. A magnetic phase transition occurs at K. In low magnetic fields, the magnetization increases rapidly just below , decreases below 7 K, and finally becomes negative at low temperatures on cooling. We determined the magnetic structure using neutron powder diffraction results. The magnetic order on both Ni-sites develops according to a single irreducible representation of the space group and propagation vector . The honeycomb lattices show antiferromagnetic (AFM) long-range order. The ordered Ni1 moment mainly points along the direction with a small AFM component along the direction. The size of the ferromagnetic (FM) component is very small. The ordered Ni2 moment on linear chains has only the component and shows FM long-range order. The magnetic moment sizes amounted to 1.60(3)and 0.6(1) per Ni-atom for the honeycomb-lattice and chain Ni sites, respectively. The sharp magnetic transition at was also observed in the SR results. The over-damped spontaneous muon spin precession below indicates a very broad field distribution at the muon site(s). The dynamic relaxation rate starts to increase below K where the magnetization becomes negative. We have examined several models known from literature that can account for the negative magnetization. The Néel model that is based on the compensation of the ferromagnetic sublattices may be valid in our case, but our experimental data does not allow us to prove this model quantitatively.
Acknowledgements.
We are grateful to H. Mamiya for fruitful discussion, to S. Matsumoto for sample syntheses and X-ray diffraction measurements, and to M. Kaise for X-ray diffraction measurements. The neutron powder diffraction experiments were conducted at SINQ, PSI Villigen, Switzerland. The SR measurements were performed at the Swiss Muon Source, PSI Villigen, Switzerland. This work was partially supported by grants from NIMS.References
- (1) T. Masuda, A. Zheludev, B. Grenier, S. Imai, K. Uchinokura, E. Ressouche, and S. Park, Phys. Rev. Lett. 93, 077202 (2004).
- (2) T. Masuda, A. Zheludev, B. Sales, S. Imai, K. Uchinokura, and S. Park, Phys. Rev. B 72, 094434 (2005).
- (3) T. Masuda, K. Kakurai, M. Matsuda, K. Kaneko, and N. Metoki, Phys. Rev. B 75, 220401(R) (2007).
- (4) T. Masuda, K. Kakurai, and A. Zheludev, Phys. Rev. B 80, 180412(R) (2009).
- (5) T. Hamasaki, T. Ide, H. Kuroe, T. Sekine, M. Hase, I. Tsukada, and T. Sakakibara, Phys. Rev B 77, 134419 (2008).
- (6) M. Hase, H. Kitazawa K. Ozawa, T. Hamasaki, H. Kuroe, and T. Sekine, J. Phys. Soc. Jpn. 77, 034706 (2008).
- (7) E. W. Gorter and J. A. Schulkes, Phys. Rev. 90, 487 (1953).
- (8) L. Néel, Ann. Phys. 3, 137 (1948).
- (9) N. Menyuk, K. Dwight, and D. G. Wickham Phys. Rev. Let. 4, 119 (1960).
- (10) K. Yasukochi, K. Kanematsu, and T. Ohoyama, J. Phys. Soc. Jpn. 15, 932 (1960).
- (11) J. A. Schulkes and G. Blasse, J. Phys. Chem. Solids, 24, 1651 (1963).
- (12) B. Lüthi, Phys. Rev. 148, 519 (1966).
- (13) M. Abe, M. Kawachi, and S. Nomura, J. Phys. Soc. Jpn. 31, 940 (1971).
- (14) A. K. M. Zakaria and M. A. Asgar, J. Alloys Compounds, 396, 44 (2005).
- (15) Y. Kimishima, Y. Ichiyanagi, K. Shimizu, and T. Mizuno, J. Magn. Magn. Mater., 210, 244 (2000).
- (16) Y. Kimishima, M. Uehara, and T. Saitoh, Solid State Commun., 133, 559 (2005).
- (17) V. Yu Ivanov, A. A. Mukhin, A. S. Prokhorov, and A. M. Balbashov, Phys. Stat. Sol. (b) 236, 445 (2003).
- (18) S. Hashimoto, Y. Matsuda, T. Sato, and S. Anzai, J. Appl. Phys. 98, 123903 (2005).
- (19) A. H. Cooke, D. M. Martin, and M. R. Wells, J. Phys. C:Solid State Phys., 7, 3133 (1974).
- (20) S. Washimiya and C. Satoko, J. Phys. Soc. Jpn. 45, 1204 (1978).
- (21) K. Yoshii, J. Solid State Chem., 159, 204 (2001).
- (22) K. Yoshii and A. Nakamura, J. Solid State Chem., 155, 447 (2000).
- (23) K. Yoshii, A. Nakamura, Y. Ishii, and Y. Morii J. Solid State Chem., 162, 84 (2001).
- (24) V. A. Khomchenko, I. O. Troyanchuk, R. Szymczak, and H. Szymczak, J. Mater. Sci., 43, 5662 (2008).
- (25) B. Andrzejewski, A. Kowalczyk, J. E. Frackowiak, T. Toliński, A. Szlaferek, S. Pal, and Ch. Simon, Phys. Stat. Sol. (b) 243, 295 (2006).
- (26) N. Shirakawa and M. Ishikawa, Jpn. J. Appl. Phys., 30, L755 (1991).
- (27) A. V. Mahajan, D. C. Johnston, D. R. Torgeson, and F. Borsa, Phys. Rev. B 46, 10966 (1992).
- (28) H. C. Nguyen and J. B. Goodenough, Phys. Rev. B 52, 324 (1995).
- (29) Y. Ren, T. T. M. Palstra, D. I. Khomskii, E. Pellegrin, A. A. Nugroho, A. A. Menovsky, and G. A. Sawatzky, Nature 396, 441 (1998).
- (30) Y. Ren, T. T. M. Palstra, D. I. Khomskii, A. A. Nugroho, A. A. Menovsky, and G. A. Sawatzky, Phys. Rev. B 62, 6577 (2000).
- (31) G. R. Blake, T. T. M. Palstra, Y. Ren, A. A. Nugroho, and A. A. Menovsky, Phys. Rev. B 65, 174112 (2002).
- (32) H. Adachi and H. Ino, Nature 401, 148 (1999).
- (33) R. P. Singh and C. V. Tomy, J. Phys.: Condens. Matter, 20, 235209 (2008).
- (34) R. P. Singh and C. V. Tomy, Phys. Rev. B 78, 024432 (2008).
- (35) R. P. Singh, C. V. Tomy, and A. K. Grover, Appl. Phys. Lett., 97, 182505 (2010).
- (36) R. P. Singh and C. V. Tomy, Solid State Commun. 150, 804 (2010).
- (37) E. Duman, M. Acet, Y. Elerman, A. Elmali, and E. F. Wassermann, J. Magn. Magn. Mater., 238, 11 (2002).
- (38) M. Ozima, S. Sato, and T. Zoltai, Acta Crystallogr. B 33, 2175 (1977).
- (39) P. Fischer, G. Frey, M. Koch, M. Koennecke, V. Pomjakushin, J. Schefer, R. Thut, N. Schlumpf, R. Buerge, U. Greuter, S. Bondt, and E. Berruyer, Physica B, 276-278, 146 (2000); http://sinq.web.psi.ch/hrpt
- (40) J. Rodriguez-Carvajal, Physica B (Amsterdam) 192, 55 (1993).
- (41) A. Yaouanc and P. Dalmas de Réotier. Muon Spin Rotation, Relaxation, and Resonance, Applications to Condensed Matter, Oxford University Press (2011).
- (42) Y. A. Izyumov, V. E. Naish, and R. P. Ozerov, Neutron Diffraction of Magnetic Materials (Consultants Bureau, New York, 1991).
- (43) R. Kubo, Hyperfine Interactions 8, 731 (1981).
- (44) A. Rauch and W. Waschkowski, Neutron Data Booklet (Edited by A.-J. Dianoux and G. Lander), chapter 1.1. (Neutron Scattering Lengths).
- (45) J. Nogués and Ivan K. Schuller, J. Magn. Magn. Mater., 192, 203 (1999).