The merger history, AGN and dwarf galaxies of Hickson Compact Group 59
Abstract
Compact group galaxies often appear unaffected by their unusually dense environment. Closer examination can, however, reveal the subtle, cumulative effects of multiple galaxy interactions. Hickson Compact Group (HCG) 59 is an excellent example of this situation. We present a photometric study of this group in the optical (HST), infrared (Spitzer) and X-ray (Chandra) regimes aimed at characterizing the star formation and nuclear activity in its constituent galaxies and intra-group medium. We associate five dwarf galaxies with the group and update the velocity dispersion, leading to an increase in the dynamical mass of the group of up to a factor of 10 (to M⊙), and a subsequent revision of its evolutionary stage. Star formation is proceeding at a level consistent with the morphological types of the four main galaxies, of which two are star-forming and the other two quiescent. Unlike in some other compact groups, star-forming complexes across HCG 59 closely follow mass-radius scaling relations typical of nearby galaxies. In contrast, the ancient globular cluster populations in galaxies HCG 59A and B show intriguing irregularities, and two extragalactic H ii regions are found just west of B. We age-date a faint stellar stream in the intra-group medium at Gyr to examine recent interactions. We detect a likely low-luminosity AGN in HCG 59A by its erg s-1 X-ray emission; the active nucleus rather than star formation can account for the UV+IR SED. We discuss the implications of our findings in the context of galaxy evolution in dense environments.
1 Introduction
Compact galaxy groups populate the high density tail of the galaxy number density distribution. The systems catalogued by Hickson (1982, Hickson Compact Groups, or HCGs) exhibit some features, such as dynamical and evolutionary states, elliptical fractions and X-ray properties of the intra-group medium (IGM) similar to galaxy clusters, their massive, more populous counterparts. In contrast to the well-studied cluster galaxies, however, the specific effects of the compact group environment on the evolution of its galaxies are not yet clear.
HCGs are defined through criteria of isolation and surface brightness111 , i. e. a circular area defined by three galaxy-mean-radii about the group is devoid of galaxies of comparable brightness. A group surface brightness of mag defines galaxy density. that give rise to self-gravitating, dense groupings of a few (typically four) main members. Because of their masses, these galaxies orbit around the group barycenter rather sluggishly, with velocity dispersions on the order of km s-1 (Tago et al., 2008; Cox, 2000), cf. galaxy cluster dispersions of km s-1 (Binggeli et al., 1987; The & White, 1986; Cox, 2000). This trait makes HCGs valuable laboratories for galaxy evolution: the low velocity dispersions force some galaxies into strong, prolonged interactions while others appear undisturbed but are apparently undergoing enhanced secular evolution. That is to say, this latter population is affected by gravitational interplay with their neighbors, but evolve more subtly, without obvious, strong interactions (Konstantopoulos et al., 2010).
Relating the various observational characteristics of compact groups to those of clusters is important for understanding whether they constitute their own class, or if they are simply mini-clusters. Perhaps more appropriately, structures like compact groups may be considered plausible building blocks of clusters at higher (e. g. Fujita & Goto, 2004; Rudick et al., 2006). Revealing past investigations of HCGs as a class have focussed on gas content. Their members are typically deficient in H i gas when compared to galaxies of similar morphological types and masses (e. g. the sample of isolated galaxies in Haynes & Giovanelli, 1984). Verdes-Montenegro et al. (2001) proposed an evolutionary sequence based on mapping the spatial distribution of H i across a large sample of HCGs. Johnson et al. (2007, hereafter J07) added to this investigation by quantifying the gas richness of twelve groups with the relation of H i-to-dynamical mass, ). This gave rise to the hypothesis of an alternate, two-pronged evolutionary diagram for HCGs, which we explored in Konstantopoulos et al. (2010). In one path, the galaxies have strong interactions before exhausting their cold gas reservoirs for star formation, in the other, gas is processed by star formation within individual galaxies prior to late-stage dry mergers.
Furthermore, the mid-IR colors of HCG galaxies show an interesting bimodal distribution that distinguishes star-forming from quiescent systems. Walker et al. (2010) interpret this statistically significant gap as evidence for accelerated galaxy evolution in the compact group environment. Their similar mid-IR color distributions relate HCGs to the infall regions of clusters and set them apart from any other galaxy sample compared, interacting or quiescent. This theme was expanded by Tzanavaris et al. (2010) who found this gap apparent also in the distribution of specific star formation rates for HCG galaxies. These observations together point to compact groups as local examples of the plausible building blocks of clusters in the early universe.
In addition, HCGs, which are isolated by selection, could potentially help explain the evolutionary history of some field ellipticals. For example, Rubin et al. (1990) originally proposed (see also Gallagher et al. 2008) that HCG 31 will evolve into a single, field elliptical through a wet merger (one where gas is still available during the interaction). ‘Fossil groups’, the probable ultimate fate of isolated groupings, were examined by Jones et al. (2003), who defined a criterion of diffuse X-ray emission in excess of erg s-1 for such a classification. This arises from the processing of a group’s IGM during a merger (or series of mergers), but the low total mass of most local compact groups suggests their potential well lacks the depth required to heat the IGM to X-ray detectable levels (Mulchaey & Zabludoff, 1998). Using multiple mergers as a vehicle toward a fossil group end-state maps one path of galaxy evolution from the ‘blue cloud’ of star-forming disk galaxies to the ‘red sequence’ of quiescent bulge-dominated galaxies (Bell et al., 2004).
Fossil group formation may provide an analogy to cluster centers or sub-clumps where the buildup of cD galaxies occurs. If this turns out to be valid, the study of compact groups could also help illuminate morphological transformations in the innermost cores of clusters. Exploring these different scenarios may prove fruitful for our understanding of galaxy evolution and the buildup of stellar mass in the universe. Making meaningful progress in this area requires detailed multi-wavelength studies in order to map the range of physical processes affecting galaxies that are found in these environments, determine their histories, and project their evolution.
A consistent treatment of a large sample of HCGs is therefore in order. In this work we continue the series of Gallagher et al. (2010) and Konstantopoulos et al. (2010) and provide a comprehensive, multi-wavelength study of HCG 59. We will look at the current state of the group through its star formation and nuclear activity; investigate its past through the star cluster populations; try to unravel the history of mergers in the group; examine its dwarf galaxy system; and place it in the context of HCGs in general.
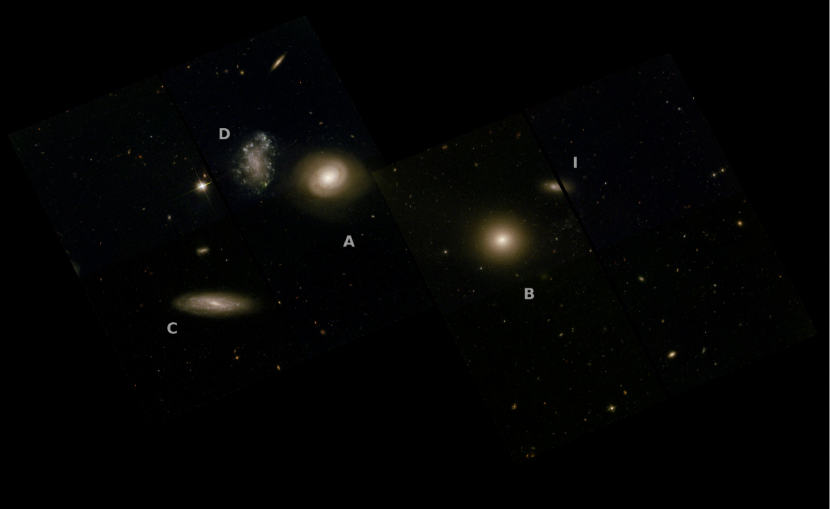
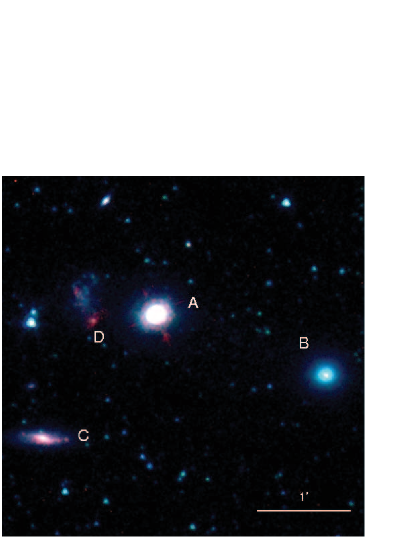
The core of HCG 59 consists of four giant galaxies, a typical number for HCGs in general. The group lies at a distance of 60 Mpc, based on a recession velocity of km s-1 (Hickson et al., 1992, corrected to the reference frame defined by the 3K Microwave Background) and km s-1 Mpc-1. Three of the galaxies, A (type Sa), B (E0), and C (Sc), have seemingly undisturbed morphologies, and the fourth (D, Im) is an unusually large irregular with a normal, peaked light profile. The total stellar mass of the group is M⊙ (from the 2MASS -band luminosities; Tzanavaris et al., 2010), while the H i mass of M⊙ is comparable to the value expected for the morphological types and stellar masses of the member galaxies, according to Verdes-Montenegro et al. (2001). This is therefore a somewhat gas-rich compact group, given that HCGs typically contain only about a third of the H i expected. On the other hand, the J07 scheme classifies the H i content of the galaxy group as a Type II, i. e. intermediate in gas content, according to its ratio of gas-to-dynamical mass of . These classifications are based on different criteria and the disparity can thus be reconciled. Table 1 summarizes some of the general characteristics of the four galaxies, while Table LABEL:tab2_dlx presents some derived and literature values of the mass content and nuclear identifications in the four galaxies.
This paper is organized in the following way: Section 2 presents the optical, IR, and X-ray datasets used throughout this work. Section 3 provides a full account of the young and old star cluster populations, which we use as our prime diagnostics of current star formation and ancient interactions. In Section 4 we discuss the main findings of this work. Finally, in Section 5 we summarize the work presented and offer ties to previous and future work in this series.
| Identifier | CoordinatesaaCoordinates are the centroids from fitting the HST -band images of each galaxy with Sérsic profiles. See § 2.1 for more details. | Type | Referencesbb[1]: Evans et al. (2010); [2]: de Vaucouleurs et al. (1991); [3]: Hickson et al. (1992); [4]: York et al. (2000); [5]: Falco et al. (1999). | ||
|---|---|---|---|---|---|
| (J2000) | H89ccHickson et al. (1989) | (mag) | ( km s-1) | ||
| A: IC 0737 | 11:48:27.55 +12:43:38.7 | Sa | 14.82 () | 4109 | [1], [2], [3] |
| B: IC 0736 | 11:48:20.08 +12:42:59.5 | E0ddThe RC3 designation for 59B is‘ S0?’, and so there is some uncertainty as to its classification. | 15.60 () | 4004 | [4], [2], [5] |
| C: KUG 1145+129 | 11:48:32.44 +12:42:19.5 | Sc | 15.90 () | 4394 | [4], [2] |
| D: KUG 1145+130 | 11:48:30.64 +12:43:47.8 | Im | 16.00 () | 3635 | [4], [2] |
.
| ID | aaSDSS model magnitudes. These values have not been corrected for Galactic extinction. | bbFrom the CO observations of Verdes-Montenegro et al. (1998) | SFRccAbsolute magnitudes assuming a distance modulus of 33.89 and correcting for Galactic extinction. | sSFRddEstimated total GC population | Nucleus eeFrom Martínez et al. (2010); ‘C’ stands for ‘composite’, i. e. one that falls at the H ii/AGN overlap region, as defined in Kewley et al. (2006); see Sections 4.4, 4.5 for discussion on these designations. | |||
|---|---|---|---|---|---|---|---|---|
| (M⊙) | (M⊙ yr-1) | () | ||||||
| A | 17. | 40 | 10. | 2 | ffThis value is heavily affected by the AGN in galaxy A, as will be elaborated in Section 2.6. | 28. | 66 | C/AGN |
| B | 8. | 29 | . | 8 | 0. | 19 | C | |
| C | 3. | 03 | . | 2 | 5. | 15 | H ii | |
| D | 2. | 67 | . | 6 | 18. | 15 | H ii | |
2 Observations
2.1 HST optical imaging
The analysis presented in this paper is based largely on HST-ACS/WFC multi-band data. Images were taken in the F435W, F606W and F814W bands in two pointings to cover all known giant group members. We will refer to these filters as , , (and the set as BVI) to denote the closest matches in the Johnson photometric system. The notation does not, however, imply a conversion between the two systems. The observations were executed on 2007 February 24, as part of GO program 10787 (PI: Jane Charlton). The exposure times were 1710, 1230 and 1065 seconds in the BVI bands respectively. Three equal sub-exposures were taken with each filter with a three-point dither pattern (sub-pixel dithering). Images were reduced ‘on the fly’ to produce combined, geometrically corrected, cosmic-ray cleaned images. For the analysis of point sources, we used the standard HST pipeline products with a nominal pixel scale of per pixel. For analysis of the extended sources, we ran MultiDrizzle (Fruchter & Sosey, 2009) with the pixel scale set to per pixel to improve the spatial resolution. The absolute image astrometry was checked with the world coordinate system of the Two Micron All-Sky Survey catalog (2MASS; Skrutskie et al., 2006) by identifying four unsaturated point sources in common; the average offset was ″ in RA and Dec. The four main galaxy -band light profiles were fit with Sérsic profiles using GALFIT (Sérsic, 1968; Peng et al., 2010a); the best-fitting centroid positions are given in Table 1.
We used the images, presented in Figure 1, to characterize the optical morphology of the galaxies, and to detect and photometer star clusters and cluster complexes. All reported magnitudes are in the Vega magnitude system. In Section 3, we present the analysis of these two scales (clusters and complexes) of the star formation hierarchy and also distinguish between young massive clusters (YMCs) and globular clusters (GCs).
2.2 Optical point source photometry
We follow the same rationale applied in our previous work (Gallagher et al., 2010; Konstantopoulos et al., 2010) and use star clusters to infer the star formation activity and history in each of the HCG 59 galaxies. At the adopted distance to HCG 59 of 60 Mpc, we expect some contamination by supergiant stars, which can have absolute -band magnitudes as bright as (Efremov et al., 1986). At this distance, one ACS pixel measures pc, (cf. the average star cluster radius of pc; e. g. Scheepmaker et al., 2007), meaning that clusters are at most marginally resolved and can be considered point sources for the purposes of selection and photometry. We select clusters using the method described in Gallagher et al. (2010); in brief, we perform the initial selection on median-divided images, require selection in all three bands, and filter the resulting catalog using point spread function (PSF) photometry. Our PSF filtering applied the following criteria from the output of the ALLSTAR routine in IRAF222 IRAF is distributed by the National Optical Astronomy Observatories, which are operated by the Association of Universities for Research in Astronomy, Inc., under cooperative agreement with the National Science Foundation.: values below 3.0; a sharpness in the range ; and a photometric error less than mag. Aperture corrections are first measured between 3 and 10 pixels and then added to the Sirianni et al. (2005) corrections to infinity. Finally, foreground (Galactic) extinction with is accounted for using the standard Galactic extinction law (a correction of mag; Schlegel et al., 1998).
In order to fortify the selection against stars, we apply a conservative absolute magnitude cut at mag, which produces the high-confidence sample. We do, however, define a larger sample by relaxing the magnitude cut and applying stricter PSF-fitting criteria to detect globular clusters, which are expected to be fainter and point-like. In order to minimize contamination from marginally resolved sources such as compact background galaxies, we follow Rejkuba et al. (2005) and apply hyperbolic filters (starting narrow for bright sources and widening for fainter sources) with a maximum cut-off at the above mentioned criteria of magnitude error, and sharpness. We will refer to this as the extended sample.
The application of these criteria assigns 240 bright star cluster candidates (SCCs) to the high-confidence sample and 948 to the extended sample. Specifically, the numbers of detected SSCs (extended sample numbers in parentheses) in galaxies A through D are 7 (29), 77 (213), 13 (63) and 65 (217), with a further 78 (426) objects coincident with what would be the intra-group medium. We will provide a full analysis of these cluster populations in Section 3.1.
In order to test the completeness of the final list of SCCs, we used ADDSTAR to add 3000 artificial stars to the image (over the entire field, including the galaxies) in the apparent magnitude range 24–28, i. e. absolute magnitudes of . Because the final catalogue only contains sources detected in all three filters, we include this effect by calculating completeness fractions based only on artificial stars detected in all three bands (e. g. Da Rocha et al., 2002). The limiting magnitudes for the 90% and 50% recovery rates are (26.56, 27.25), (26.51, 27.19) and (26.47, 27.15) in the , and bands respectively (after photometric corrections are applied). For the distance modulus used of 33.89 mag, mag corresponds to mag.
Our assessment of the state of star formation in HCG 59 is not limited to star clusters. Star cluster complexes represent a larger scale of star formation, as the optically blended concentrations of gas, stars, and dust that make up small star-forming regions, and likely include groups of clusters. In contrast to star clusters, these can be resolved to even greater distances than studied here, as the fractal distribution of gas about a galaxy gives rise to such structures at all scales (e. g. as demonstrated for M33 by Bastian et al., 2007).
2.3 Globular Cluster Candidate Selection
Globular clusters are also selected from the HST images. Since the process is tuned to the color distributions found in HCG 59, we provide a full account below. As contamination from supergiants is not a problem for objects with GC-like colors, we adopt a fainter magnitude limit to select old GC candidates than we used for SCCs. We have chosen a cutoff at , which corresponds to at our adopted distance modulus for HCG 59, or slightly more luminous than the expected peak in the globular cluster luminosity function (GCLF) at (e.g. Ashman & Zepf, 1998; Harris, 2001). The majority of GC candidates brighter than this limit lie above the 90% photometric completeness level in all 3 filters. Assuming a Gaussian GC luminosity function with a peak at and a dispersion , our faint-end cutoff then samples of the entire GCLF.
We have selected GC candidates (GCCs) according to the color-space distribution of Milky Way GCs. We de-reddened the colors of globular clusters from the Harris (1996) catalog by their listed values, and then defined a parallelogram based on the intrinsic color distribution of the MW GCs. This parallelogram was then converted to the ACS filters using the ‘synthetic’ transformations in Sirianni et al. (2005). The color selection region adopted here is 0.10 mag wider in than that used in the analysis of HCG 7 (Konstantopoulos et al., 2010), but still does not exceed the boundaries of the Harris (1996) MW GCs. To quantify, 95 of 97 MW GCs from the Harris (1996) catalog (those with BVI information) lie within this box. All point sources in the HCG 59 fields with 1 error bars that overlap our color selection region are considered GC candidates, and are plotted in Figure 2.
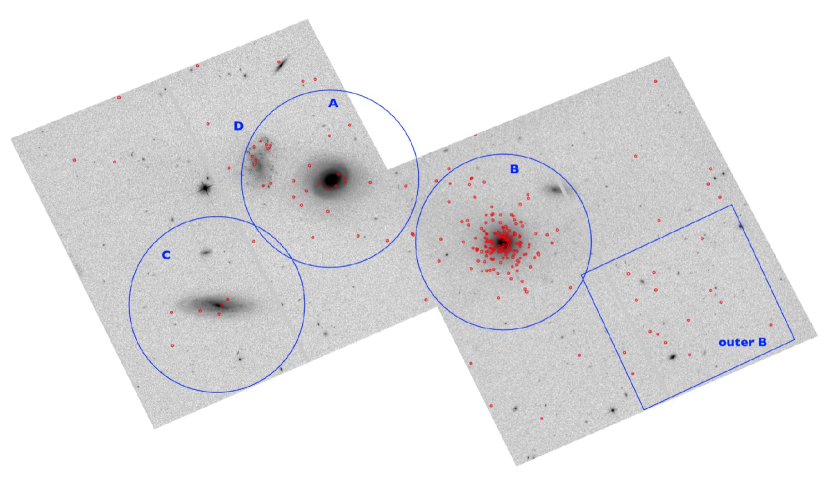
Due to the close (projected) proximity of the galaxies in the group, it is likely that the halo GCs in each system will appear superposed. In an attempt to quantify the GCCs in each galaxy, we use the relationship between the galactic mass and the radial extent of the GC systems in galaxies of Rhode et al. (2007). To compute the expected size of each halo, we have adopted the mass-to-light conversions in that work, although we stress the general conclusions we reach are not dependent on the detailed size of any given halo. As the predicted masses of all of the group galaxies are just below the lowest mass galaxies in the Rhode et al. (2007) sample, we adopted a radial extent of 15 kpc (or 56″ at the assumed distance to HCG 59) for each of galaxies A, B and C. Galaxy D is a lower luminosity system, and as seen in Figure 2, GCCs in this object already lie within the projected halo of GCCs in galaxy A. Discussion of the individual GC systems in each group galaxy follows in Section 3.3.
2.4 Background and Foreground Contamination
Contamination in our color-selected sample of GC candidates is expected from a variety of sources, including foreground Milky Way halo stars, reddened young clusters, and unresolved background galaxies. With the small number of GC candidates present in some of the HCG 59 galaxies (discussed below), contamination can be significant.
Predictions from Milky Way star count models (the Besançon model of Robin et al., 2003) suggest that only 3–4 foreground Milky Way stars will appear in the magnitude and color ranges for expected GCs in each of our ACS fields. Determining the contamination from younger, reddened clusters is more difficult, particularly in the central regions of the late-type galaxies C and D, where such objects could be present. Unresolved background galaxies are not likely contributing in any significant way to the numbers of objects in our fields; analyses of the background objects (with GC-like colors) in HCG 7 (Konstantopoulos et al., 2010) showed that the predicted foreground Milky Way star counts were similar to the observed putative background contamination, leaving little room for background galaxies to contribute significantly.
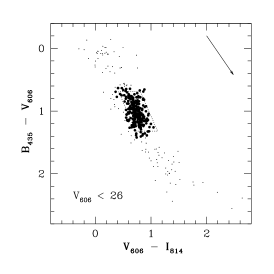
We also consider the Pirzkal et al. (2005) analysis of stars in the Hubble Ultra-Deep Field (HUDF). Within the range of colors shown in Figure 8, they found the main contaminant of ‘void sky’ to be M-stars, however, with a - of , they are too red to be considered in our analysis. All Main Sequence stars detected in the HUDF are too bright to be mistaken for star clusters by our detection algorithm. In fact, the only class of stellar object that can be found in the color-space occupied by our cluster candidates is white dwarfs, which Pirzkal et al. find to have a density of pc-3. The maximum Galactic volume covered by our two pointings is a cube of px on a side, or pc-3, assuming a scale height of 400 pc (the maximum height quoted by Pirzkal et al.). Such a volume might be expected to host white dwarfs. Therefore, we consider this potential source of contamination to be negligible.
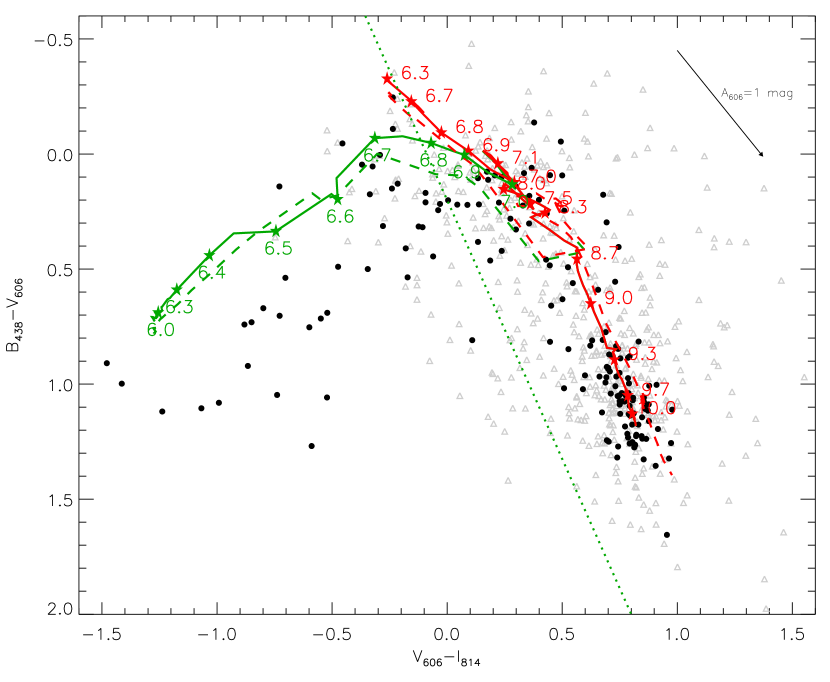
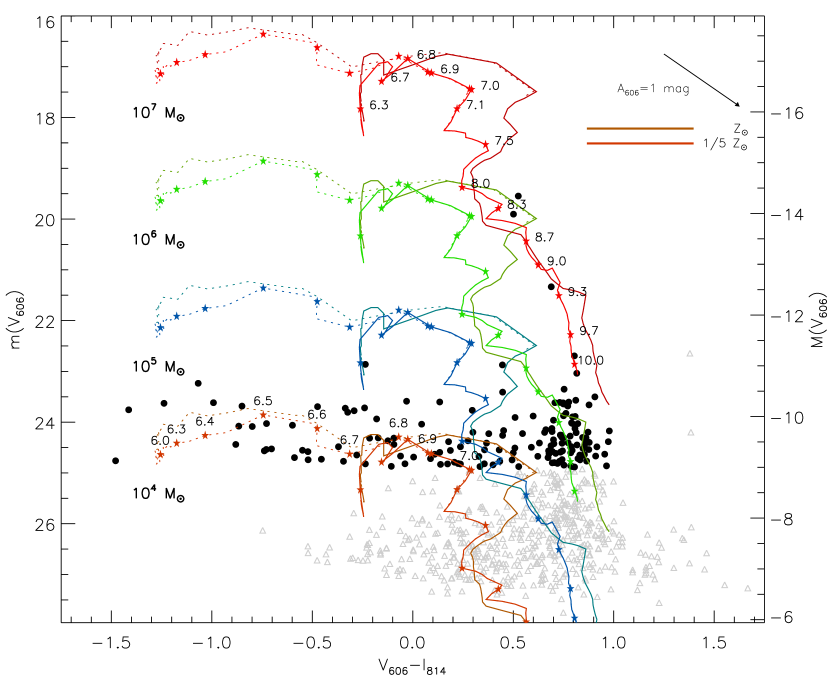
The dominant source of contamination to our GCC sample will actually be stars from the Sagittarius dwarf galaxy. Our ACS fields (at , ) are superposed on a rather dense part of the tidally induced (and bifurcated) leading arm (stream ‘A’ from Belokurov et al., 2006) of Sgr (e.g., Majewski et al., 2003; Belokurov et al., 2006; Newberg et al., 2007; Yanny et al., 2009); the presence of such streams is not accounted for in traditional Milky Way star count models. To investigate the impact of Sgr Stream stellar populations, in Figure 3 we have overlaid 12 Gyr isochrones of Marigo et al. (2008) with a range of metallicities expected for the Sgr leading arm, (e.g. Chou et al., 2007; Yanny et al., 2009), at distances between 26 and 36 kpc onto color-magnitude diagrams of the point sources in both of our ACS fields (assuming kpc, with a spread of kpc; Newberg et al., 2007; Niederste-Ostholt et al., 2010; Correnti et al., 2010). From this, we see that stars just below the Sgr Stream main sequence turnoff do have colors and magnitudes similar to that of the brighter () GC candidates in our study, making some contamination likely.


To estimate the total contamination in our GCC sample, we assume those GC candidates that lie far outside the GC system halos (as shown in Figure 2) are instead contaminating sources. The one exception to this is a region (called ‘outer B’ in Figure 2) that lies outside the GC system of galaxy B, opposite to the direction of galaxy A. We will return to this feature below. There are a total of 18 objects in 8.4 arcmin2, or a background surface density . This is much higher than the predicted surface density of MW halo stars from the Besançon model (), indicating that Sgr leading arm stars are the dominant foreground source of contamination in our sample.
Of course, for the above analysis we are making the assumption that these contaminating objects are not bona-fide ‘intra-group’ GCs that lie far outside the main galaxies of the group. To test this, we compare the luminosity function for the background source sample with the luminosity function of the large GC candidate population surrounding galaxy B. We show this in the right panel of Figure 3. The extrahalo luminosity function does not show a sharp rise with increasing magnitude as expected of a GC luminosity function and exhibited by the GCCs in galaxy B. Although a definitive comparison is not possible with so few objects in the IGM area, this is consistent with these IGM objects being contaminants and not a part of a diffuse population of intragroup GCs. Thus we adopt the surface density above as that of the ‘background’ in the analyses that follow.
2.5 Las Campanas wide-field imaging: low surface brightness light and dwarf galaxies
We extend the coverage of the HST observations through wide-field imaging with the Las Campanas Observatory (LCO) 2.5-meter telescope. We took - and -band images of a 25′ diameter around the group with the Wide Field Reimaging CCD Camera (WFCCD). The data were obtained on 2007 July 07 as part of an imaging campaign that covers all 12 HCGs in the J07 sample. The and filter exposure times were 300 s and 600 s, respectively.
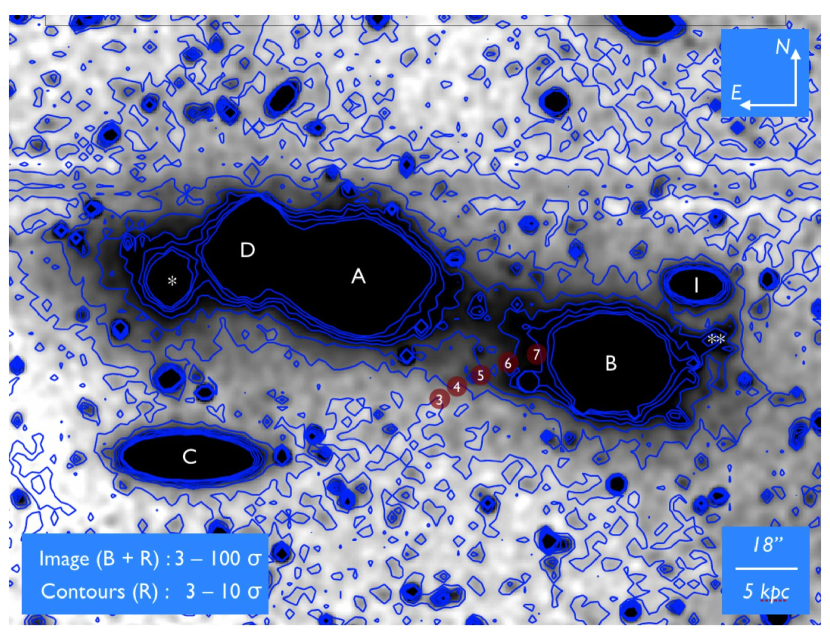
These images allow for the detection of low surface brightness features, such as the signatures of past interactions, over a large area. We present this analysis in Figure 4, where we stacked the and images and applied a Gaussian smoothing filter to the result. This image shows only features and -band contours that register at least above the background. We find two faint features, a ‘bridge’ that appears to connect galaxies A and B and an arc extending from B toward a compact structure to its north-west (we will later refer to this as the ‘B-I arc’). There is another compact, extended source in the space between galaxies C and D.
The original purpose of the LCO observing program was to prepare a sample of dwarf galaxy candidates for spectroscopic follow-up. Though our redshift survey has yet to cover HCG 59, it is covered by the Sloan Digital Sky Survey (SDSS; York et al., 2000): a spectroscopic search sweeping a radius of 30 arcminutes around the nominal center of the group (the geometric center of the region enveloping the four known members) yields seven spectra with redshifts in the range 0.01–0.02: galaxies C and D and five compact galaxies. We therefore consider the membership of SDSS galaxies J114817.89+124333.1 and J114813.50+123919.2, which are covered by our wide-field imaging and J114930.72+124037.5, J114940.11+122338.6 and J114912.21+123753.8 which lie at projected distances greater than 13 arcminutes from the group center. The first of these galaxies is also present in the HST imaging, but lies partly in the ACS chip gap. In Section 4.1 we attempt to determine whether these are HCG 59 members through a phase-space analysis.
The Hickson (1982) naming convention assigns letters in order of brightness. Since our imaging does not cover all five dwarf candidates, we used the SDSS -band photometry to consistently classify the galaxies as HCG 59 F through J. We have omitted the letter E, as it was assigned in the original catalog to a background galaxy. We attempted to measure stellar masses for these galaxies using 2MASS -band images (Skrutskie et al., 2006), however, they are below the detection limit of that survey. Table 3 summarizes all of the information presented in this section: measured and SDSS photometry, radial velocities, galaxy morphologies and projected distances from the group barycenter. The latter two properties will be discussed in Section 4.1
| ID | SDSS ID | (Plate, MJD, Fiber) | Morphology | aaSDSS model magnitudes. These values have not been corrected for Galactic extinction. | bbGalactic extinction and recession velocities are from SDSS DR7. | ccAbsolute magnitudes assuming a distance modulus of 33.89 and correcting for Galactic extinction. | bbGalactic extinction and recession velocities are from SDSS DR7. | |
|---|---|---|---|---|---|---|---|---|
| (mag) | ( km s-1) | (kpc) | ||||||
| F | J114930.72+124037.5 | (1609, 53142, 464) | Sd | 15.83 | 0.09 | 3984 | 290 | |
| G | J114940.11+122338.6 | (1609, 53142, 465) | dIr | 17.34 | 0.08 | 3195 | 471 | |
| H | J114912.21+123753.8 | (1608, 53138, 625) | dIr | 17.39 | 0.08 | 4011 | 225 | |
| I | J114817.89+124333.1 | (1608, 53138, 586) | dIm | 17.43 | 0.10 | 4038 | 32 | |
| J | J114813.50+123919.2 | (1608, 53138, 593) | dE | 17.69 | 0.10 | 3942 | 83 | |
2.6 Spitzer observations: infrared spectral energy distributions
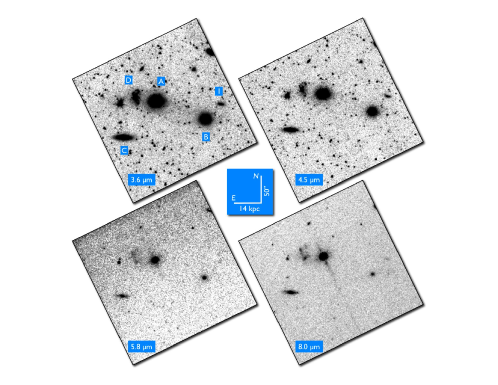
The optical imaging was complemented by Spitzer imaging in the mid-infrared (IRAC 3.6–8 µm and MIPS 24 µm observations) presented in J07 and shown in Figure 5. In addition to the Rayleigh-Jeans tail of stellar photospheric emission, the IRAC bands probe the presence of hot dust and polycyclic aromatic hydrocarbons (PAHs), while the m observations trace cooler thermal dust emission. The dust and PAH emission are both stimulated by star formation activity. The harder spectra of active galactic nuclei typically destroy PAH molecules while heating dust to hotter temperatures than found in galaxies with star formation alone. At low AGN luminosities, the IR SEDs are often ambiguous (particularly in the presence of star formation; e.g., Gallagher et al., 2008).
The Spitzer images were combined with JHKS observations from 2MASS (Skrutskie et al., 2006) to plot the IR spectral energy distribution (SED) of each galaxy (following J07), presented in the frequency-space plot of Figure 6. We have used the Silva et al. (1998) templates for galaxies of various morphological types. These map the SED of different galaxies as the sum of starlight and gas and dust emission from star formation and interstellar cirrus. We calculate the spectral index of the SED within the IRAC bands through a simple power-law fit. This was defined by Gallagher et al. (2008) as , and it serves as a measure of star formation activity. In logarithmic frequency units, the flux difference from 8 to 4.5m leads to a positive gradient in quiescent environments, while star formation registers as a negative slope. For HCGs, the steepness of the slope is sensitive to the specific star formation rate (Tzanavaris et al., 2010).
In brief, the SEDs of galaxies B and C follow their morphological types of E/S0 and Sc, while the irregular nature of D does not allow for a template to be assigned (we use Sc in Figure 6). Galaxy A, nominally an Sa, shows strong excess light at wavelengths associated with PAH and/or hot dust emission (m). If the flux in this region is associated with star formation, an Sc template would be more appropriate. This is, however, inconsistent with the optical morphology of A. Furthermore, the shape of this emission is also consistent with the AGN dust bump (e.g., Elvis et al., 1994; Gallagher et al., 2008), so in Section 4.5 we will examine the nuclear activity of this galaxy.

The SED-fitting process could not be carried out for the new dwarf galaxies catalogued in Section 2.5 due to the limited spatial coverage of the Spitzer imaging and the faintness of the dwarfs (they were not detected in 2MASS). As of July 2011, the Wide-field Infrared Survey Explorer (WISE) photometric catalogue did not cover HCG 59.
2.7 The high energy picture: Chandra-ACIS observations
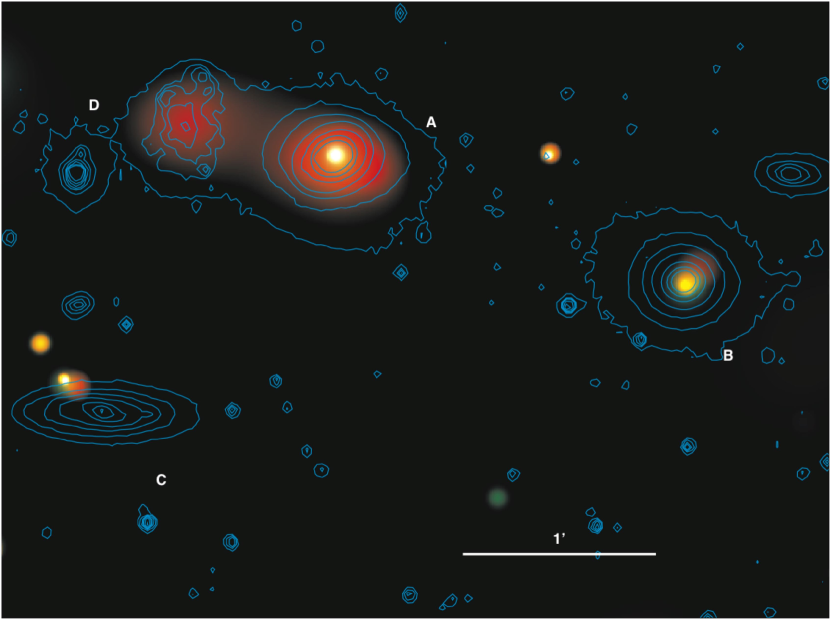
The dataset is completed by Chandra-ACIS data in the 0.5–8.0 keV range. Results reported here are drawn from the work by Tzanavaris et al. (2011 in prep.). HCG 59 was observed by Chandra between 2008-04-12 and 2008-04-13 at the aim point of the back-illuminated S3 CCD of ACIS in very faint mode with an exposure time of 39 ks (observation ID 9406, sequence number 800743, PI S. Gallagher). The data were processed using standard Chandra X-ray Center aspect solution and grade filtering, from which the level 2 events file was produced. Figure 7 shows an adaptively smoothed 3-band X-ray image, with optical () contours overplotted for comparison.
Wavdetect, the CIAO 4.1.2333http://cxc.harvard.edu/ciao wavelet detection tool (Freeman et al., 2002) was used in the soft (0.5–2.0 keV), hard (2.0–8.0 keV) and full (0.5–8.0 keV) bands to detect candidate point sources. The 10241024 S3 chip field was searched with wavdetect at the false-probability threshold. Wavelet scales used were 1, 1.414, 2, 2.828, 4, 5.657 and 8.0 pixels. Source lists produced by wavdetect for each band were matched against each other by means of custom-made scripts (K. D. Kuntz, priv. comm.) to calculate a unique position for each candidate point source, taking into account the varying size of the Chandra PSF across the S3 CCD.
Point source photometry was carried out for the objects in the source list using ACIS Extract444http://www.astro.psu.edu/xray/docs/TARA/AE.html (Broos et al., 2010) which takes into account the varying Chandra PSF accross the CCD. Poisson errors on net counts were calculated by means of the approximations of Gehrels (1986). Sources with measured net counts smaller than the error were flagged as non-detections. Note that this method produces very similar results to choosing a binomial probability threshold of 0.004 in ACIS Extract (Xue et al., 2011).
As sources have too few counts for reliable spectral fitting, we apply the method of Gallagher et al. (2005) to obtain a rough estimate of the spectral shape by using hardness ratios, defined as HR , where and represent the counts in the hard and soft bands, respectively. Briefly, we use the X-ray spectral modeling tool XSPEC (Arnaud, 1996), version 12.5.0, to simulate the instrumental response and transform observed HR values into an effective power law index (where photons cm-2 s-1 keV-1), and also obtain associated X-ray fluxes and luminosities. This modeling includes neutral absorption from the Galactic of cm-2 (Kalberla et al., 2005).
We estimate flux limits of erg cm-2 s-1 (0.5 - 2.0 keV) and erg cm-2 s-1 (2.0 - 8.0 keV), corresponding to luminosity limits of erg s-1 (0.5 - 2.0 keV) and erg s-1 (2.0 - 8.0 keV). Assuming these limits, we use the relation of Cappelluti et al. (2007) to estimate the number of background sources we would expect to detect in the HCG 59 field over the square degree area of the S3 chip. This number is and in the soft and hard bands, respectively, with a % uncertainty. In the much smaller area ( square degrees) covered by our galaxies, we expect background source in each band.
We detect a total of 40 sources in the soft band and 33 sources in the hard band over the ACIS S3 field. We thus expect about 15 soft and 13 hard sources to be point sources associated with HCG 59. We find that 9 soft and 3 hard sources are located inside the boundaries of the MIR-based HCG 59 galaxy regions of J07. We note that 11 sources that have only hard-band emission are located far from the HCG 59 galaxies and are thus likely background AGN.
In the central regions of two group galaxies, there are three notable X-ray point sources detected with high significance. As these point sources are all with 5′ of the Chandra optical axis, the X-ray positions are the ACIS Extract “mean positions of events within the extraction regions” 555See Section 5.3 of the ACIS Extract User Manual – http://www2.astro.psu.edu/xray/docs/TARA/ae_users_guide.html with intrinsic positional uncertainties of a few tenths of an arcsecond. There is some additional uncertainty from matching the absolute reference frames of Chandra and HST, but this is expected to be small as both are consistent with 2MASS at the level.
The first source, in galaxy A, has a full-band luminosity of erg s-1 and an estimated . The X-ray position of this source is 0.7″ from our quoted optical position (Table 1). This isolated point source in the nuclear region of galaxy A has a luminosity that is consistent with known low-luminosity AGN (e.g., Ho et al., 2001) and significantly higher than individual, luminous X-ray binaries. The two point sources found in the central region of galaxy B have X-ray positions 0.2″ and 1.3″ from the HST -band galaxy centroid position (Table 1). Unfortunately, these sources have fewer than 10 counts in each band, precluding even a rough estimate. Their full-band luminosities are erg s-1, respectively.
The Chandra images are also sensitive to diffuse emission from MK degree gas. As can be seen in our adaptively smoothed image, some soft, diffuse emission is detected in galaxy D (Im), likely associated with star formation, as well as in galaxy A. In both cases, the diffuse emission covers an area several times the size of the Chandra PSF at that location. We obtain an upper limit on the IGM surface brightness as follows. We calculate the count rate in a source-free region between group galaxies, and estimate the corresponding flux for keV thermal emission using PIMMS.666http://heasarc.nasa.gov/Tools/w3pimms.html We thus estimate the IGM surface brightness to be erg cm-2 s-1 arcsec-2. Finally, we note that dwarf galaxy I is not coincident with any detected X-ray sources; none of the other new dwarf members of HCG 59 are within the Chandra field of view.
We will discuss the implications of these observations further in Section 4.
3 The young and old star cluster populations: star formation over a Hubble time
3.1 Young star clusters and the past Gyr of star formation
The population of star clusters is representative of star formation as a whole in any system (e. g. Bressert et al., 2010). They are formed en masse after large events (e.g., Trancho et al., 2007; Konstantopoulos et al., 2008, 2009; Konstantopoulos, 2009; Bastian et al., 2009) and at a slower pace at all times when a galaxy is forming stars (Lada & Lada, 2003). The extreme brightness of young clusters makes them detectable to large distances and therefore a reliable tracer of the star formation history of their host galaxy over a Gyr or so. Beyond that point in time they are referred to as intermediate age clusters and eventually globular clusters. As a whole, the cluster population of a galaxy can reveal its star-forming history over a Hubble time.
In this section, we analyze the cluster populations of the four main galaxies in HCG 59 using the HST PSF photometry described in Section 2.2. We use color-color (CC) and color-magnitude (CMD) diagrams to roughly age-date the clusters by comparing them to evolutionary tracks. The BVI filter combination of our HST images lacks coverage below Å, which is crucial to breaking the age-reddening degeneracy (owing to the inclusion of the Balmer jump and near-UV continuum). However, it is still possible to infer the passing of intense bursts of star formation via the clumping of data-points along the evolutionary track, and unreddened young clusters are clearly evident.
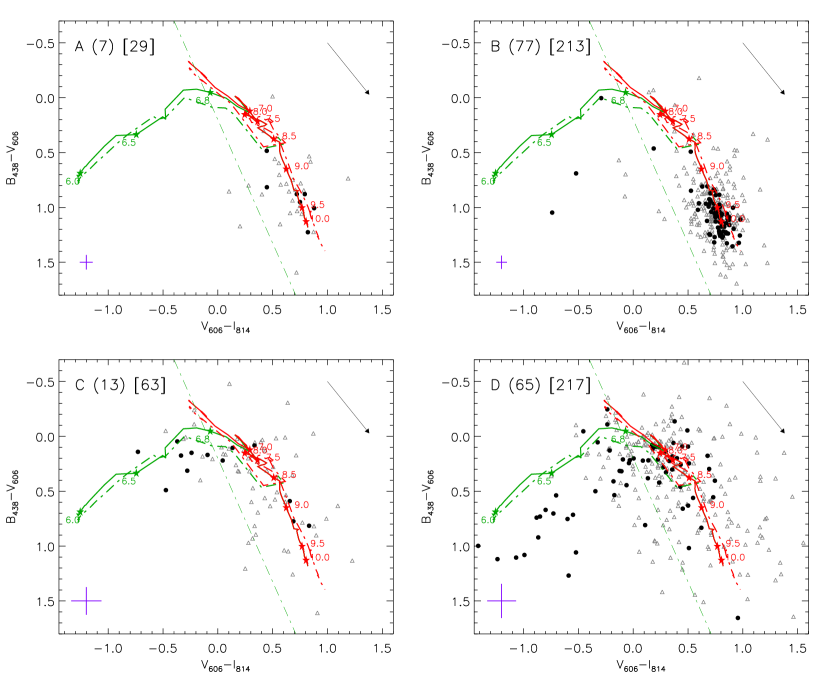
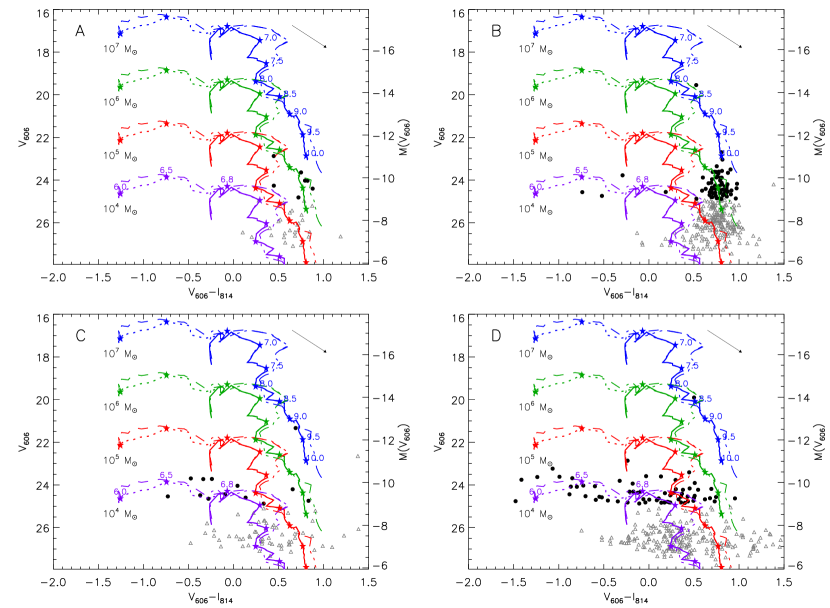
Figures 8 through 11 show the high-confidence sample (i. e. clusters with mag; see Section 2.2) as solid dots, while the extended sample is marked with open triangles. The solid and dashed red lines (running top to bottom) show Marigo et al. (2008) evolutionary tracks for simple stellar populations (SSP) of Z⊙ and Z⊙. This is slightly different from our previous work, where we used Bruzual & Charlot (2003) models. We made this change because the Marigo et al. (2008) models seem to provide a good fit to both young clusters and globulars, unlike other model suites which focus on one part of the cluster population. The green lines that run more or less horizontally show Starburst99 (SB99; Leitherer et al., 1999) tracks of the same metallicities. These also include nebular emission, which we expect to often be present during the first Myr of evolution. At this state the cluster is still surrounded by residual gas from the time of its formation ionized by UV photons. This short-lived phase ends when the first stars evolve and explode in supernovae that expel the gas. Clusters with colors redder than 0.8 in both axes are most likely GCs, although they might be highly reddened young clusters.
When contrasting the extended and high-confidence samples, the former appears to spread more in color-space. This reflects a mass effect intrinsic to star clusters, rather than indicating contamination. Two recent studies, Silva-Villa & Larsen (2011) and Popescu & Hanson (2010), independently reached the conclusion that lower mass (fainter) clusters, M⊙, often exhibit deviations from the theoretical model tracks. In this mass regime, the underlying stellar initial mass functions (IMF) are under-sampled and stochastic effects dominate the overall light. Given that the IMF is populated randomly, it is physically equivalent to creating either one high mass star, or low mass stars (given the IMF slope). In contrast, a high-mass cluster will populate the IMF fully. Consequently, a population of high-mass clusters will have smaller intrinsic photometric dispersion. A cluster with lower mass will run out of material before the IMF becomes fully sampled, thus leading to the presence of gaps and spikes. Because of this effect, the presence of a high mass star in a low mass cluster will make the cluster appear to have a larger photometrically derived mass than one with only lower mass stars.
We now treat the population of each galaxy individually. In the following paragraphs, all star and globular cluster candidates discussed are taken from the high-confidence sample. The distinctions of young, intermediate, and globular are inferred from the locations of candidates along evolutionary tracks within the – vs. – color-color space.
Galaxy A (Sa) hosts a very small detectable population of five GCCs and two intermediate-age cluster candidates. The CMD shows them all to be consistent with having high masses, with . The lack of young clusters, combined with the high masses of the ones detected, indicates that galaxy A has stopped forming stars at a high rate. Because the mass-to-light ratio of a stellar population increases with age (i. e., the older a cluster becomes, the higher its mass must be for detection), young clusters should dominate the cluster population when the SFR is high. The non-detection of any young clusters is further evidence that the UV+IR emission is dominated by AGN continuum, and the inferred SFR of 5 M⊙ yr-1 is severely overestimated.
Galaxy B (E/S0) hosts mostly red clusters; the GCCs vastly outnumber young cluster candidates in this system. In fact, the four SCCs in the high-confidence sample do not strictly belong to galaxy B, but are found in the IGM: two nebular sources are located in a clump to the west of the galaxy, which we are treating as part of a stream that connects this galaxy to the dwarf HCG 59I in our field of view. We will return to these H ii regions in Section 4.3. The two non-nebular SCCs are distinct clusters in dwarf galaxy I. This means that the presence of patchy dust (as seen in the HST images of 59B) by itself is not indicative of star formation at a high enough level to produce massive clusters, consistent with its SFR of 0.02 M⊙ yr-1.
Galaxy C (Sc) shows a continuous star formation history, evident in the smooth distribution of datapoints along the evolutionary track. The presence of nebular sources indicates some current star formation, while the low masses ( M⊙) derived throughout the sample imply an overall low level of star formation over time. This is in accord with the low value of 0.16 M⊙ yr-1 for the SFR of the galaxy. There is no pronounced GC population.
Galaxy D (Im) is an unusually large irregular galaxy. It shows a continuous star formation history through to the present. The CMD shows a handful of SCCs with . At 0.48 M⊙ yr, this galaxy has the largest SFR of those with young clusters. There is no old component in the cluster distribution, no evident halo of GCCs, again possibly due to the low mass of the system which implies a small globular cluster system. Furthermore, the extended sample does not reveal a tight, correlated color distribution characteristic of GCs. The youngest clusters lie at a typical color-space distance of mag away from the nebular model track along the reddening vector, indicating the presence of dusty star-forming regions.
3.2 Star cluster complexes
One step above star clusters in the star formation hierarchy is cluster complexes, large agglomerates of young stars, arranged in a fractal distribution that follows the collapse of the progenitor gas. These structures can be used to understand the global star formation activity in a galaxy. They are found to be more compact at higher redshifts than in the local universe (with two to five times higher mass surface density, as found by Elmegreen et al., 2009), although in one local interacting compact group, HCG 31, we find complexes to be similar to those at intermediate redshifts (Gallagher et al., 2010). We argue in this series of papers that compact groups might process gas more efficiently when interacting than most other environments apart from the infall regions of galaxy clusters (Walker et al., 2010). HCG 31 fits well in that context.
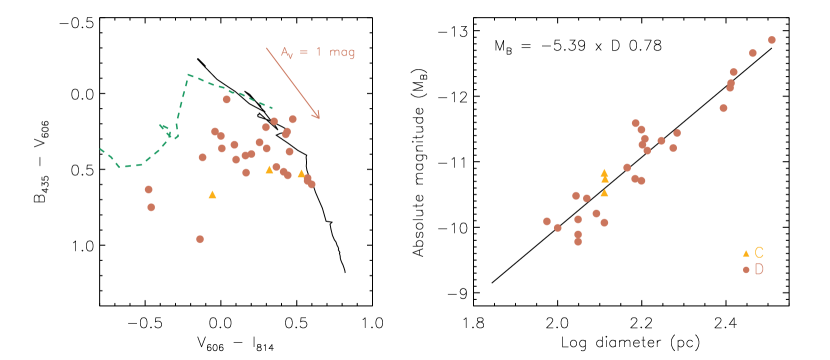
Star-forming complexes are extended amorphous regions, with dust scattered across their surfaces. Their boundaries were identified by eye and measured by contours down to a limiting surface brightness about 10 above the background. We single out 30 star-forming complexes in this compact group, three in galaxy C, and 27 in D. We find no complexes in the E/S0 galaxy B or A, the evolved (Sa) spiral. The sizes of these complexes are comparable to those in local systems (Figure 12; cf. Elmegreen et al., 1994, 1996) and consistent with HCG 7, a relatively inactive compact group (Konstantopoulos et al., 2010). Their colors are indicative of star formation and nebular emission, as expected of star-forming regions (Figure 12, right). In all, the star-forming complexes in HCG 59 are comparable to their counterparts in local star-forming galaxies. They follow very closely a relation between brightness and size, much more so than we found in our previous study of HCG 7. We show this correlation in Figure 12 (right) where the line is a simple linear fit to the data. The linear fit implies a similar surface brightness for complexes across the group, unlike in HCG 7, where we found significantly more scatter.
3.3 The ancient globular cluster systems of HCG 59
Globular clusters represent the earliest eras of star formation in a given galaxy. Their color distributions carry the imprints of interactions and mergers and thus may probe the history of their hosts over a very long timescale.
In this section we provide a full analysis of the number and color distributions of the GC populations in HCG 59 and complement the star formation and interaction histories we began to explore in Section 3.1. This analysis is built around the plots of Figure 13. The top row has a color-color plot (left) and histogram of the distributions (right) in each galaxy. (The color-magnitude diagram is shown in the left panel Figure 3.) Owing to their projected proximity, the GC systems of galaxies A and D overlap, and so we cannot provide separate analyses. However, given the relative masses of the two galaxies and their evolutionary stages, it is safe to assume that the population is dominated by A.


We find a fairly large population of globular clusters across this compact group, the vast majority of which are found in and around B. Recall that given the fading of clusters with age, GCs need extremely high masses, M⊙, to be detected to such large distances. We also find some clusters at large radial distances from the center of this galaxy, including some found along the stellar stream that appears to connect galaxies A and B (see Section 4.3) and its projection on the far side of galaxy B. Galaxies A and C host small populations. To quantify these populations, we derive the specific frequency, , a measurement of the number of clusters per unit galaxy luminosity, for each galaxy. First, we correct the observed number of GC candidates by the background correction noted above, and then calculate the total number of GCs expected around each galaxy by first adopting a photometric completeness fraction of for objects with , and correcting for the expected fraction of GCs that lie below this magnitude limit. The values are 0.3, 7.7 and 0.1 for galaxies A, B and C respectively, assuming that all bright GCCs consistent with the halo of A are actually bound to A. The measured and derived numbers are collected in Table 4.
The size of the population in galaxy C is consistent with its Sc morphological type, while B has a tremendously rich system, about twice the number of GCCs expected. Conversely, the GC population of galaxy A is much poorer than expected, compared to the values of typically seen in Sa spirals (Chandar et al., 2004). Many of the detected GCCs appear to lie in a ring just outside of the bulge of the galaxy. Comparing to other GC populations in HCGs, our specific frequency for HCG 59B of is larger than (yet still consistent within the uncertainties) those observed so far in other large elliptical galaxies in HCGs: global values of for HCG 22A from Da Rocha et al. (2002),777The lower from Barkhouse et al. (2001) for HGC 22 A is due to their larger for the galaxy – both studies find a very similar total number of globular clusters. and for HCG 90C from Barkhouse et al. (2001).
Inspection of the region marked ‘outer B’ in Figure 3 shows a possible excess of GC candidates over the background level described above in Section 2.4, perhaps tracing an intra-group stellar population. This is not unusual, as compact groups by their very nature are likely to promote interactions. (White et al., 2003) detected diffuse intragroup emission in HCG 90 accounting for up to half the light of the group. Two further studies, Da Rocha & Mendes de Oliveira (2005) and Da Rocha et al. (2008), found intra-group light in another six groups: HCGs 15, 35, 51, 79, 88, and 95. In HCG 59, a total of GCCs lie within the 2.7 arcmin2 region, where we expect a background contribution of objects. Assuming only Poisson noise, this suggests a excess of objects in this part of HCG 59. This possible excess could be due to variations in the stellar density in the Galactic halo or the Sgr Stream. However, the luminosity function of this small number of sources in the ‘outer B’ region (shown as the solid line in the right panel of Fig. 3) is weighted towards the faint end, suggesting that at least some of these objects are indeed true GCCs located far ( kpc) from galaxy B. The unusually large population of GCCs associated with B, the anomalously small population in A, and the possible population of GCs in the IGM (presumably stripped from a member galaxy), all indicate that this compact group environment may have redistributed GCs between member galaxies and/or to the IGM.
In particular, possible interactions in the recent history of galaxy B might have redistributed its GC system. With this in mind, we compare the azimuthally averaged radial profile of the spatial distribution of the GC system with the surface brightness profile of the galaxy, as derived through GALFIT (Peng et al., 2010b). The galaxy is best fit by a single-component Sérsic profile of shape . Interestingly, we find the Sérsic profile of the galaxy to provide a better description of the GC system than the best fitting power-law profile of index . This is contrary to the finding of power-law GC system distributions around loose group member NGC 6868 and HCG 22 A. If that is to be considered the norm for compact groups, then perhaps the recent interaction activity about galaxy B has changed the shape of its GC halo.
| Galaxy | aaNumber of detected GCCs | bbBackground correction | ccNumber of clusters brighter than mag | ddEstimated total GC population | eeSpecific frequency | |||||
|---|---|---|---|---|---|---|---|---|---|---|
| A | 18 | 4 | 6 | 1.0 | 13 | 6 | 33 | 21 | 0.3 | 0.2 |
| B | 162 | 13 | 6 | 1.0 | 180 | 34 | 462 | 182 | 7.7 | 3.0 |
| C | 7 | 3 | 6 | 1.0 | 1 | 3 | 3 | 8 | 0.1 | 0.3 |
| D | 11 | 3 | 1 | 0.2 | 11 | 5 | 28 | 18 | 1.6 | 1.0 |
The bottom panel of Figure 13 shows the color distribution (converted to the Johnson photometric system for direct comparison to Galactic globulars) of the clusters in each galaxy. The shaded area in the plot of A/D shows clusters that are clearly part of A, i. e. omits the ones that are projected upon the body of D. This does not alter the distribution, strengthening our assumption of a small population in D. Galaxy C also hosts a very small population, as expected due to its low mass.
The color distribution can act as a proxy of metallicity for GCs and we take advantage of that to compare the two populous distributions of galaxies A and B. The color distribution of galaxy A seems fairly flat and the low numbers do not allow for a statistical treatment. Galaxy B, however, provides a large enough population to perform a test for bimodality, using the KMM algorithm of Ashman et al. (1994). This returns no evidence for a composite distribution in the metallicity distribution.
4 Discussion
4.1 Extending the membership of HCG 59
In Section 2.5 we introduced a search for dwarf galaxies in HCG 59, which we continue here. Since all objects we are considering here are covered by SDSS, we will not provide images and spectra here. More information can be obtained from the SDSS database using the plate IDs, Modified Julian Dates (MJDs), and fiber IDs given in Table 3.
Regarding the morphologies of the new members, I, the candidate covered by our HST imaging, seems irregular, with a peaked light profile. This agrees with its spectrum, which shows clear emission lines and a continuum shape typical of a spiral. We classify it as dIm. The rest of the galaxies are not covered with high-resolution imaging, so we are more conservative in classifying them. F shows quite clear spiral structure in the SDSS images, and is therefore given an Sd type. We note that its star formation seems to be declining, given that H is the only detectable emission line. G and H appear quite irregular and elongated, with spectra exhibiting blended emission and absorption. We assign them dIr types. Finally, J shows a morphology closer to spherical and weak emission lines (although the S/N does not allow for a confident determination); we assign it a dE type.
Regarding their roles as group members, four of the five galaxies do not appear to be interacting with any other members, as might be expected from their locations far from the group core (Figure 14, left). It is only I that shows some evidence of an interaction with galaxy B, in the form of the ‘B-I arc’ described in the Section 2.5. This stellar stream includes the large star-forming region we find to the west of galaxy B, which is part of the analysis of Section 3.1.
In order to assess whether these galaxies belong to the group, we perform a phase-space analysis, following the statistical studies of Mulchaey & Zabludoff (1998) and Zabludoff & Mulchaey (2000). This is shown in Figure 14, right panel, where each datapoint represents a dwarf galaxy. The x-axis measures the distance of a galaxy from the group centroid, calculated as the mass-weighted average position of the four main members (A through D). The y-axis shows the offset of a galaxy’s radial velocity from the group mean, normalized to the core group (A through D) velocity dispersion of km s-1.
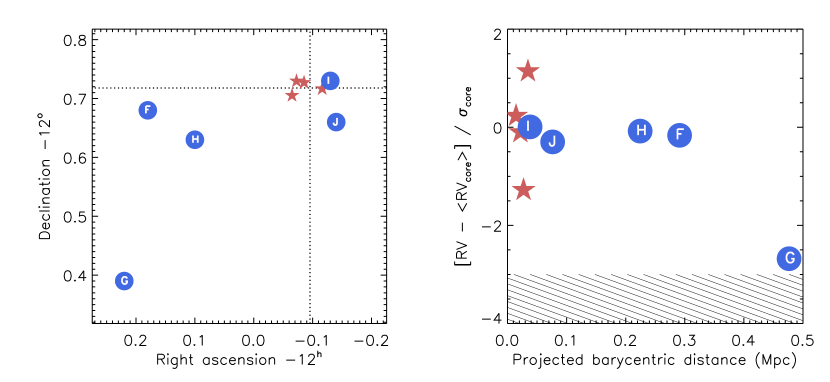
We find all galaxies to satisfy our membership constraints. Four of five spectroscopically detected galaxies lie within the boundary set by the four main members; galaxy G, which has the largest offsets in physical and velocity space, is moving with a radial velocity offset less than three times the group dispersion. We therefore consider all five galaxies under consideration here to be members of HCG 59, based on a strict 3 -clip, as demonstrated in Figure 14. The inclusion of new members updates the velocity dispersion of the group to km s-1. Based on this value, we derive a dynamical mass for HCG 59 of M⊙, a -fold increase with respect to the main members alone. This in fact changes the J07 evolutionary stage of the group from Type II (intermediate) to Type III (gas-poor), as it yields a ratio of H i-to-dynamical mass of 0.71, with the caveat that the measured H i mass is likely underestimated because the dwarfs at large group radii are not included.
It is interesting to find dwarf galaxies at large distances from the center of the group. This lack of barycentric clustering is also observed in the Local Group, where it is seen as a morphology-density relation: dwarf irregulars (dIr) are found at larger distances from the group center (Grebel, 1999) than the quiescent dwarf spheroidals (dSph) and dwarf ellipticals (dE). This may indicate that some dIrs are galaxies experiencing their first infalls to the group center. Such a situation could explain the relatively large velocity offset and the star-forming nature of galaxy G.
The membership of galaxy G seems the most uncertain of the five galaxies discussed above, given the marginal agreement with the velocity cut, and the large projected barycentric distance. This is important, as its inclusion does affect the updated dynamical properties, due to the large change in group radius. We quantify this in Table 5, where we summarize the dynamical properties of HCG 59. Those numbers show a change of mass by a factor of or with and without galaxy G, while the J07 type changes from II to III regardless of the inclusion of G. The velocity dispersion is most affected: including G increases the value to 336 km s-1 from the original 314 km s-1, while excluding G significantly reduces the dispersion to 208 km s-1, which is more consistent with the evolved state suggested by our analysis.
| Reference | J07 type | |||
|---|---|---|---|---|
| ( km s-1) | (M⊙) | |||
| Hickson (1982) | 4036 | 314 | II | |
| This work | 3924 | 336 | III | |
| This work, excluding G | 4015 | 208 | III | |
4.2 The current state of star formation
We have presented several diagnostics of star formation activity across HCG 59. The Tzanavaris et al. (2010) SFRs of galaxies A through D are M⊙ yr-1. These are determined from the combination of UV and IR light assuming that all of the light emanates from star-forming regions. The presence of young star clusters in galaxies C and D shows that stars are forming at a fair pace, in accord with the star formation rates quoted in Table 1. Overall, the SFRs are consistent with the infrared SEDs of these galaxies with the notable exception of A which is almost certainly strongly contaminated by AGN emission and shows no evidence of ongoing star formation from the other evidence on hand. There are several soft X-ray point sources throughout the group, which are likely to probe compact stellar remnants local to HCG 59 galaxies. There is also soft, diffuse X-ray emission confined to the galaxies, which probes K gas heated by star formation (stellar winds and SNe). The IR images do not show much that is surprising: emission along the spiral arms of C and in the star-forming clumps embedded in D. Four of the five dwarf galaxies show star formation activity, J being the exception. They are found to be star-forming based on either their bright emission lines or blue continua. Galaxies A and B, on the other hand, exhibit quiescent or even extinguished star formation. In the case of A, this is inferred by the absence of young star clusters.
In all, the group does not appear to be undergoing a burst or any other event notable in terms of current star formation. With the exception of the two most massive galaxies, the group is forming stars at a regular pace. This is also exemplified by the behavior of star cluster complexes across the group, which follow very closely after a brightness-radius relationship consistent with typical nearby galaxies, and in contrast to HCGs 7 and 31 (Konstantopoulos et al., 2010; Gallagher et al., 2010).
4.3 Signatures of interactions in the intra-group medium
Major interaction or merger events are very often accompanied by bursts of star and cluster formation. The examination of star clusters in HCG 59 presented in Section 3.1 did not show any evidence of such events in the last few Gyr. Given the high mass-detection limit for star clusters at this distance, they cannot be used to trace minor dynamical events. We therefore search for such evidence in the lowest surface brightness features detectable in our LCO images. In Section 2.5, we reported the detection of a low surface brightness stream of material in the projected area between galaxies A and B. This is visible at low surface brightness in our HST imaging and quite pronounced in the wide-field images from Las Campanas, at the level. We also detected an arc of luminous material to the west of galaxy B, perhaps connecting it to compact galaxy I, which we discuss in Section 4.1.
The low surface brightness and limited extent of the ‘B-I arc’ preclude precision photometry. We can therefore only pursue an in-depth analysis of the bridge between A and B. In order to derive the photometric properties of this feature, we first drew a color-map to look for an evident gradient. Unfortunately, the stream is not bright enough to clearly dominate the image background. We thus conducted photometry of the area and the outskirts of the two galaxy that bracket it. We used large apertures of radius 75 pc (8 px) to reduce the background noise. The results are plotted in Figure 15; on the left panel we compare the measured photometry with the evolution of the color, according to the Marigo et al. (2008) model tracks of three metallicities. We find an intermediate value between the colors of the outskirts of the two galaxies that define this region (plotted as yellow dashed lines), cautioning that the emission in this region might be affected by the two galaxy light-envelopes to some extent.
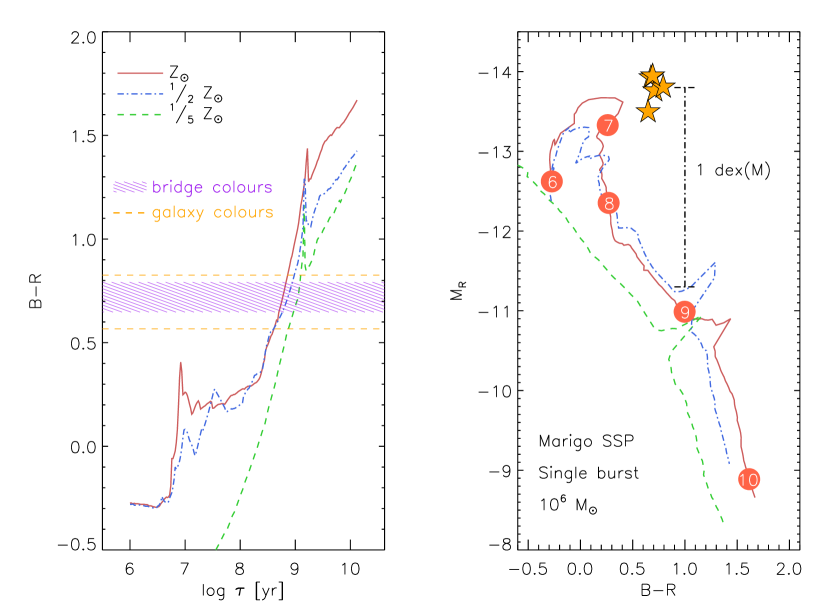
The origin of the bridge is not clear and its faintness makes it difficult to ascertain the dominant source of emission. It could consist either of stripped stars, or stars that formed in situ from stripped gas. If this is mixed stellar material from the two galaxies, we cannot study it in any more detail. We can, however, develop the in situ formation scenario further, by treating the bridge as a simple stellar population. In this case, the color-magnitude diagram of Figure 15 (right), provides an age estimate of about 1 Gyr, depending on metallicity. In addition, the CMD plotted in this figure provides an estimate of the stellar mass contained: with M⊙ of Gyr old stars in each aperture, we extrapolate a mass in the order of M⊙, i. e. a density of M⊙ pc2. If the stars here are stripped from a galaxy, the overall mass will be higher, as the of simple stellar populations increases with time.
4.4 HCG 59B as a merger remnant
HCG 59B, the E/S0 galaxy on the west side of the group, seems quite regular at first glance, however, a close inspection of the low-level light reveals some interesting features. While ELLIPSE fitting shows an overall smooth isophotal structure in light, there is severe isophotal twisting in the central regions. This is spatially coincident with several patches of extinction we detect in the HST images; they are most pronounced in , observable in and hardly detectable in , implying a thin column of dust. In the Spitzer bands, the fits indicate very symmetric structure in the 3.6 and m bands, but the 5.8 and m fits show a faint cusp some px, or kpc from the surface brightness profile peak.
The color-composite IRAC image (Figure 5) shows hints of structure in galaxy B; however, an evolved elliptical/lenticular with near-zero star formation should present a smooth isophotal profile in all bands. Nonetheless, its SED (Figure 6) shows a gradual decline, indicative of emission from stellar photospheres, rather than the heated dust associated with star formation.
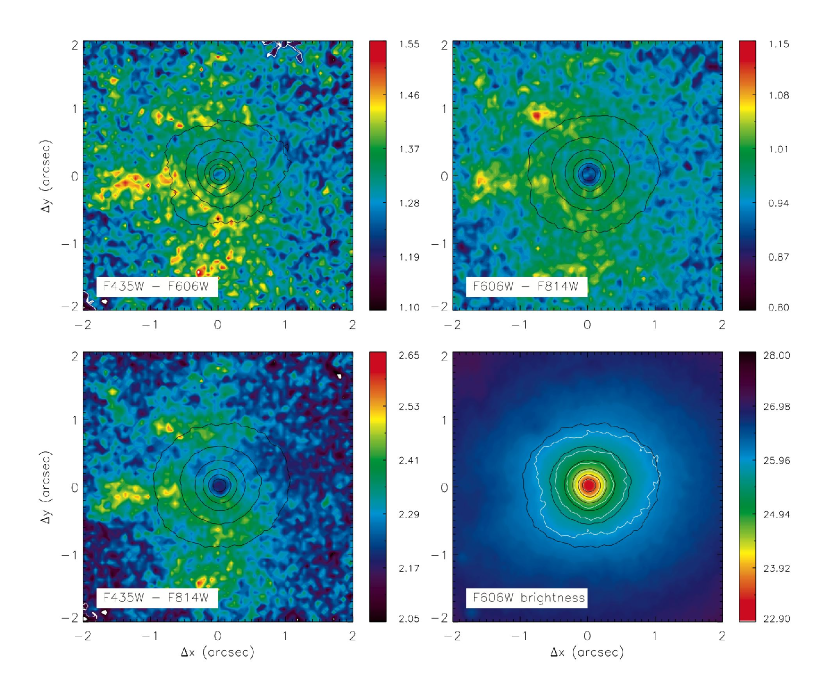
To investigate these irregularities further, we take advantage of the high resolution of the HST images. We construct pixel-by-pixel color maps of B, with the aim of tracing the exact location of the extinction patches. If the underlying stellar population is evolved to the same stage (i. e. an evolved SSP), then extinction will be the only source of discrepancies in color. There are, in fact, three possible sources of color variations in this filter combination: (i) extinction across a similarly colored stellar population (mixed or coeval); (ii) spatially separated stellar populations of various ages and/or metallicities; or (iii) the presence of gas and star formation – i. e. H ii region emission lines.
The maps, shown in Figure 16, cover the three possible filter combinations; for reference, the image is also shown. The map is the one most sensitive to extinction. To quantify, the Cardelli et al. (1989) extinction law assigns almost twice the extinction in the as it does to the , (, cf. ). This is therefore the map we use to detect patches of low extinction, of order 0.3 mag, in three fingers extending approximately eastwards from the north-south line through the nucleus. This faint structure is seen in all three colormaps, but not in the image. The F606W filter covers various emission lines, including H, [N ii], [S ii], H, and [O iii]. Interestingly, Martínez et al. (2010) found H, [NII] and [SII] emission in the spectrum of B, at relative intensities consistent with a composite H ii region plus AGN emission. From the concentrated, blue core of the image, this line emission appears to be spatially coincident with the nucleus.
Circumstantial evidence for a close encounter in the recent history of galaxy B is provided by the uneven distribution of its GC system. GCs normally form spherical haloes, however, here we find GCs at large radii, many concentrated along the stellar stream that seemingly connects galaxies A and B, and its extension across the far side of galaxy B. Furthermore, the overabundance of GCs in galaxy B is matched by a severe dearth of clusters in A. Given the possibility that the two galaxies interacted Gyr ago, a scenario whereby GCs are transferred between the two systems is not out of the question. It is unclear from a dynamical perspective why in the process of an interaction the GCs would flow from A, the more massive entity, to B. In a simple thought experiment, we move as many clusters from B to A as are required to level the of A to the nominal value for an Sa. This still leaves an excess of GCCs in B relative to normal. However, the factor-of-two uncertainties involved in the determination of do not rule out this scenario of GC ‘swapping’.
The X-ray map of this galaxy, as described in Section 2.7, reveals two distinct X-ray sources in the nuclear region. Unfortunately, with full-band luminosities of erg s-1, neither is sufficiently luminous be identified as an unambiguous AGN – a possibility that the optical spectroscopy of Martínez et al. has indicated. Given the lack of ongoing star formation in the region, the sources are unlikely to be high mass X-ray binaries, though luminous low mass X-ray binaries (associated with older stellar populations) or groups of them unresolved at the distance of HCG 59 are plausible. In addition, due to the uncertainty in matching X-ray sources to optical imaging, we cannot confidently derive a one-to-one correlation between the optical clumps and these sources, although the correlation is confirmed to within the X-ray positional uncertainties. We note however that, as discussed in Section 2.7, the nuclear X-ray sources are spatially close to the optical center of the galaxy.
The excess of globular clusters and uneven dust distribution in the nuclear regions of B hint at some interaction in the more distant ( Gyr) past, but the lack of additional evidence for structural disturbances limits our ability to infer more. We do detect a few young clusters in galaxy B and a non-zero (though low) SFR, and therefore some reservoir of cold gas is present. Accretion of a satellite galaxy is therefore a possibility. Furthermore, the unimodal GC color distribution does not favor a gas-rich, major merger in the past. This conclusion follows the paradigm of Muratov & Gnedin (2010), who attribute the known bimodality of GC colors to late-epoch mergers. It is also a reasonable assumption that the implied interaction did not feature a major merger with a gas-rich system, as that would have enhanced the young and intermediate-age cluster populations.
4.5 Nuclear activity in HCG 59A
In Section 2.6 we reported that the IR emission in galaxy A is consistent with being dominated by an AGN, rather than star formation. This is based on the disparity between the galaxy’s morphological type of Sa and the high UV+IR SFR suggested by interpreting the emission as related to SF. Furthermore, the lack of young massive clusters is inconsistent with a SFR of 5 M⊙.
This hypothesis is supported further by the finding of a hard X-ray source in the nuclear region of galaxy A, with erg s-1 as reported in Section 2.7. The spectroscopic AGN survey of HCGs (Martínez et al., 2010) places the galaxy at the interface of the H ii and AGN zones in the ‘BPT’ diagram (Baldwin et al., 1981), based on optical emission-line ratios. The 2′′-wide slit they used encompasses a wide region (effective aperture of 0.58 kpc), therefore the signal is most likely diluted by circumnuclear and disk light. Visual inspection of the central region reveals asymmetric structure, resembling a second nuclear source of comparable luminosity to the nucleus. As in the previous section, we employ HST color maps to take advantage of the spatial resolution of pc per pixel.
The maps, shown in Figure 17, reveal a cone of blue light at , with colors of , , and . The complexity of the central region inhibits easy interpretation, but one clue are the emission lines covered in the three bands. covers H, [O iii], H and [N ii], which can be associated with star formation and/or AGN activity. In this scenario, the blue cone could stand out as a result of geometry, perhaps being located in a break in the dust distribution. A simple explanation could relate this feature to an unreddened line of sight through the inner spiral structure of A. In that case, however, we would expect to see bright, young star clusters, as they are known to shine through thick columns of dust, let alone relatively dust-free regions (e. g. Region B in M82; Smith et al., 2007; Konstantopoulos et al., 2008).
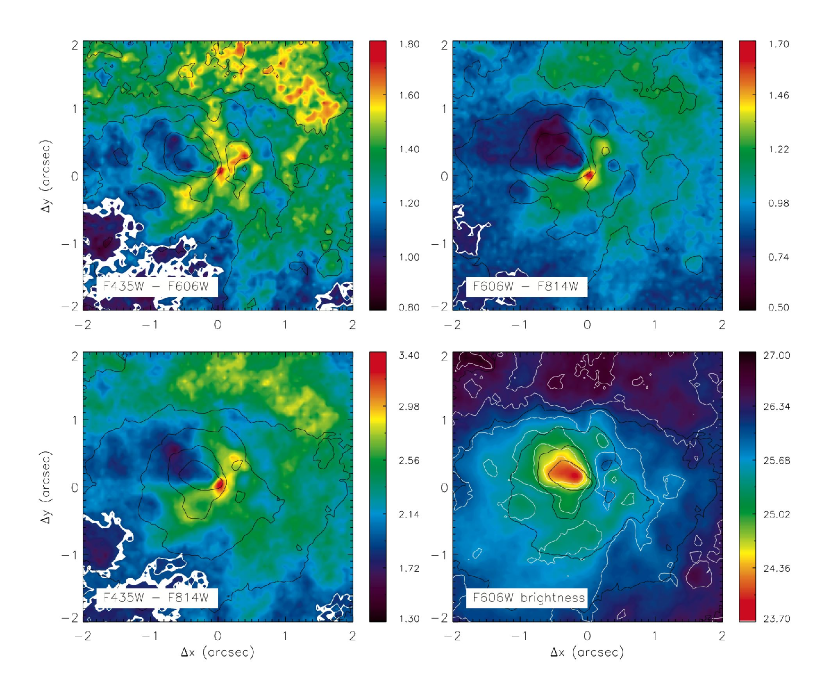
A different interpretation can relate this structure to an AGN. The lack of symmetry could suggest a small narrow-line region, photoionized by the AGN continuum, with projection effects and obscuration hiding the cone on the far side. This would produce strong [O iii] and [N ii] emission, the presence of which was reported by Martínez et al. (2010). This geometry is consistent with the inclination of galaxy A of no more than (assuming the AGN and galaxy share the same inclination angle).
Combining the pieces of evidence collected from the X-ray, optical and MIR emission, we propose that the nuclear emission in HCG 59A is dominated by a low-luminosity AGN with a photoionized narrow-line region. The onset of activity may be related to a possible encounter with galaxy B about 1 Gyr ago, as tentatively dated from the colors of the bridge connecting the two galaxies (Section 4.3).
5 Summary
We have presented an analysis of HCG 59, a compact group comprising four main galaxies and at least five newly discovered dwarfs at the mag level. Our results are based on multi-wavelength observations and continue a series of papers that have followed two different approaches: on the one hand we have treated the overall properties of Hickson compact groups (Johnson et al., 2007; Gallagher et al., 2008; Tzanavaris et al., 2010; Walker et al., 2010); on the other hand, we have surrounded our HST observations with a multi-wavelength dataset to pursue in-depth investigations of individual CGs, one at a time (Palma et al., 2002; Gallagher et al., 2010; Konstantopoulos et al., 2010).
Compared to HCGs 7 and 31, two compact groups previously studied in this series, HCG 59 presents something of an intermediate step: where HCG 7 was found to be interacting solely in the dynamical sense (i. e. currently in the absence of direct hit encounters), HCG 59 shows evidence for stronger interactions in the recent past. There is evidence for star formation in the intragroup medium in the H ii regions to the Northwest of galaxy B, in sharp contrast to HCG 7 where the star-formation associated with each galaxy was self-contained. In the context of the evolutionary sequence we proposed in Konstantopoulos et al. (2010), it occupies a stage further along than HCG 7. It has begun building an IGM, as testified by some amount of intra-group light, but has yet to build up a large elliptical fraction. Its classification as a relatively unevolved group (J07) is in accord with standard diagnostics such as its velocity dispersion of km s-1 and lack of diffuse, extended X-ray emission.
Through the use of SDSS data, we associated five dwarf galaxies to HCG 59 for the first time. Their inclusion updated the velocity dispersion and dynamical mass of the group and changed its J07 evolutionary type to an evolved group of Type III (originally Type II, or intermediate). The star-forming nature of these dwarfs, their radial velocities, and distances from the group core seem to suggest that some may be infalling for the first time. The noted relation between morphological type and barycentric distance follows the one observed in the Local Group and may be considered – conversely – as an indication of the ‘young’ dynamical state of HCG 59. The above information highlights the importance of studying the dwarf galaxy contingent of compact groups.
Star formation is proceeding at a regular pace in this CG, certainly at a rate consistent with the morphologies of the member galaxies. The regularity of star cluster complexes agrees with this image. The star cluster population does not show evidence of major, gas-rich, interactions in the past and the IR SEDs are generally as expected. One exception to this rule is galaxy D. Given its large size, the morphological regularity of its neighbors, and the lack of evidence of recent interactions, it is not clear why it has such an irregular structure and why it is forming stars at the rate that it is.
Where the information is unclear for galaxy D, B is evidently in the midst of at least one dynamical process. This probably started more than a Gyr ago given the lack of tidal features such as shells and tails commonly observed in such events in the optical (Schweizer & Seitzer, 1998; Hibbard et al., 2001; Mullan et al., 2011). It is likely physically associated with an arc of star formation that seemingly connects it to dwarf galaxy I (the arc that hosts the discovered extragalactic H ii regions), and 59B lies at one end of a low surface brightness bridge of stellar material, which might physically connect it with A. We found this feature to be no older than Gyr by age-dating its stellar population. Perhaps most intriguingly, the globular cluster population of B is anomalously large, with significantly more globular cluster candidates than A, despite its lower stellar mass. The origin of this discrepancy is unclear, but hints at an additional event in the more distant past.
In one sense, this group is typical of early or intermediate-stage HCGs. There are plenty of dynamical processes at play, however they are all proceeding at a low level and centered around one or two objects. Galaxy B is at the focus of all such processes that our diagnostics can reach, like galaxy B in HCG 7 (also an early-type galaxy). In addition, both these groups may feature an active nucleus host galaxy (the dominant galaxy A in both groups, albeit the detection is not certain in HCG 7).
We find the presence of a low-luminosity AGN in A to be likely given the spatial coincidence of the galaxy centroid with a erg s-1 X-ray point source. The inferred SFR from the IR+UV luminosity is not supported given the lack of young star clusters, and therefore likely is overestimated because of significant AGN contamination. If the A-B bridge constitutes a physical connection between the two galaxies, a causal connection between the interaction and the AGN is possible. In this case, we can constrain the timescale since the onset to no more than one Gyr.
In the introduction, we discussed HCGs as a potentially special environment in terms of galaxy evolution. The apparent duality of ‘modes’ in which HCG galaxies are found – either star-forming or quiescent – and the evident lack of an intermediate stage population are in accord with the mid-IR color-space ‘gap’ discussed in our previous work (Johnson et al., 2007; Tzanavaris et al., 2010; Walker et al., 2010). The impact of the group environment will be the topic of the next paper in this series. There we will treat HCGs 16, 22 and 42 with a goal of understanding the evolutionary processes at play in compact groups and relating their galaxies to those found at other levels of galaxy clustering.
Acknowledgements
We thank the referee, Cristiano Da Rocha, for his constructive criticism of the manuscript and suggested additions that elevated the work. ISK thanks Ranjan Vasudevan and Matt Povich for educational discussions on the X-ray properties of AGN and star-forming regions. We thank Gordon Garmire for his contribution in obtaining the X-ray dataset. Support for this work was provided by NASA through grant number HST-GO-10787.15-A from the Space Telescope Science Institute which is operated by AURA, Inc., under NASA contract NAS 5-26555 and through Chandra Award No. GO8–91248 issued by the Chandra X-ray Observatory Center, which is operated by the Smithsonian Astrophysical Observatory under NASA contract NAS8-03060. SCG, KF, and ARH thank the National Science and Engineering Council of Canada and the Ontario Early Researcher program. Funding was provided by the National Science Foundation under award 0908984. PRD would like to acknowledge support from HST grant HST-GO-10787.07-A. AIZ acknowledges support from the NASA Astrophysics Data Analysis Program through grant NNX10AE88G. KEJ gratefully acknowledges support for this work provided by NSF through CAREER award 0548103 and the David and Lucile Packard Foundation through a Packard Fellowship. PT acknowledges support through a NASA Postdoctoral Program Fellowship at Goddard Space Flight Center, administered by Oak Ridge Associated Universities through a contract with NASA. This research has made use of the NASA/IPAC Extragalactic Database (NED) which is operated by the Jet Propulsion Laboratory, California Institute of Technology, under contract with the National Aeronautics and Space Administration.
Facilities: HST (), Spitzer (), Chandra (), Las Campanas ()
References
- Arnaud (1996) Arnaud, K. A. 1996, in Astronomical Society of the Pacific Conference Series, Vol. 101, Astronomical Data Analysis Software and Systems V, ed. G. H. Jacoby & J. Barnes, 17–+
- Ashman et al. (1994) Ashman, K. M., Bird, C. M., & Zepf, S. E. 1994, AJ, 108, 2348
- Ashman & Zepf (1998) Ashman, K. M., & Zepf, S. E. 1998, Globular Cluster Systems (Cambridge University Press)
- Baldwin et al. (1981) Baldwin, J. A., Phillips, M. M., & Terlevich, R. 1981, PASP, 93, 5
- Barkhouse et al. (2001) Barkhouse, W. A., West, M. J., & Bothun, G. D. 2001, ApJ, 562, 679
- Bastian et al. (2007) Bastian, N., Ercolano, B., Gieles, M., Rosolowsky, E., Scheepmaker, R. A., Gutermuth, R., & Efremov, Y. 2007, MNRAS, 379, 1302
- Bastian et al. (2009) Bastian, N., Trancho, G., Konstantopoulos, I. S., & Miller, B. W. 2009, ApJ, 701, 607
- Bell et al. (2004) Bell, E. F., Wolf, C., Meisenheimer, K., Rix, H., Borch, A., Dye, S., Kleinheinrich, M., Wisotzki, L., & McIntosh, D. H. 2004, ApJ, 608, 752
- Belokurov et al. (2006) Belokurov, V., Zucker, D. B., Evans, N. W., Gilmore, G., Vidrih, S., Bramich, D. M., Newberg, H. J., Wyse, R. F. G., Irwin, M. J., Fellhauer, M., Hewett, P. C., Walton, N. A., Wilkinson, M. I., Cole, N., Yanny, B., Rockosi, C. M., Beers, T. C., Bell, E. F., Brinkmann, J., Ivezić, Ž., & Lupton, R. 2006, ApJ, 642, L137
- Binggeli et al. (1987) Binggeli, B., Tammann, G. A., & Sandage, A. 1987, AJ, 94, 251
- Bressert et al. (2010) Bressert, E., Bastian, N., Gutermuth, R., Megeath, S. T., Allen, L., Evans, II, N. J., Rebull, L. M., Hatchell, J., Johnstone, D., Bourke, T. L., Cieza, L. A., Harvey, P. M., Merin, B., Ray, T. P., & Tothill, N. F. H. 2010, MNRAS, 409, L54
- Broos et al. (2010) Broos, P. S., Townsley, L. K., Feigelson, E. D., Getman, K. V., Bauer, F. E., & Garmire, G. P. 2010, ApJ, 714, 1582
- Bruzual & Charlot (2003) Bruzual, G., & Charlot, S. 2003, MNRAS, 344, 1000
- Cappelluti et al. (2007) Cappelluti, N., Hasinger, G., Brusa, M., Comastri, A., Zamorani, G., Böhringer, H., Brunner, H., Civano, F., Finoguenov, A., Fiore, F., Gilli, R., Griffiths, R. E., Mainieri, V., Matute, I., Miyaji, T., & Silverman, J. 2007, ApJS, 172, 341
- Cardelli et al. (1989) Cardelli, J. A., Clayton, G. C., & Mathis, J. S. 1989, ApJ, 345, 245
- Chandar et al. (2004) Chandar, R., Whitmore, B., & Lee, M. G. 2004, ApJ, 611, 220
- Chou et al. (2007) Chou, M., Majewski, S. R., Cunha, K., Smith, V. V., Patterson, R. J., Martínez-Delgado, D., Law, D. R., Crane, J. D., Muñoz, R. R., Garcia López, R., Geisler, D., & Skrutskie, M. F. 2007, ApJ, 670, 346
- Correnti et al. (2010) Correnti, M., Bellazzini, M., Ibata, R. A., Ferraro, F. R., & Varghese, A. 2010, ApJ, 721, 329
- Cox (2000) Cox, ed. 2000, Allen’s astrophysical quantities (AIP Press)
- Da Rocha & Mendes de Oliveira (2005) Da Rocha, C., & Mendes de Oliveira, C. 2005, MNRAS, 364, 1069
- Da Rocha et al. (2002) Da Rocha, C., Mendes de Oliveira, C., Bolte, M., Ziegler, B. L., & Puzia, T. H. 2002, AJ, 123, 690
- Da Rocha et al. (2008) Da Rocha, C., Ziegler, B. L., & Mendes de Oliveira, C. 2008, MNRAS, 388, 1433
- de Vaucouleurs et al. (1991) de Vaucouleurs, G., de Vaucouleurs, A., Corwin, Jr., H. G., Buta, R. J., Paturel, G., & Fouque, P. 1991, Third Reference Catalogue of Bright Galaxies (Volume 1-3, XII, 2069 pp. 7 figs.. Springer-Verlag Berlin Heidelberg New York)
- Efremov et al. (1986) Efremov, Y. N., Ivanov, G. R., & Nikolov, N. S. 1986, in IAU Symposium, Vol. 116, Luminous Stars and Associations in Galaxies, ed. C. W. H. de Loore, A. J. Willis, & P. Laskarides, 389–+
- Elmegreen et al. (1996) Elmegreen, B. G., Elmegreen, D. M., Salzer, J. J., & Mann, H. 1996, ApJ, 467, 579
- Elmegreen et al. (1994) Elmegreen, D. M., Elmegreen, B. G., Lang, C., & Stephens, C. 1994, ApJ, 425, 57
- Elmegreen et al. (2009) Elmegreen, D. M., Elmegreen, B. G., Marcus, M. T., Shahinyan, K., Yau, A., & Petersen, M. 2009, ApJ, 701, 306
- Elvis et al. (1994) Elvis, M., Wilkes, B. J., McDowell, J. C., Green, R. F., Bechtold, J., Willner, S. P., Oey, M. S., Polomski, E., & Cutri, R. 1994, ApJS, 95, 1
- Evans et al. (2010) Evans, I. N., Primini, F. A., Glotfelty, K. J., Anderson, C. S., Bonaventura, N. R., Chen, J. C., Davis, J. E., Doe, S. M., Evans, J. D., Fabbiano, G., Galle, E. C., Gibbs, D. G., Grier, J. D., Hain, R. M., Hall, D. M., Harbo, P. N., (Helen He, X., Houck, J. C., Karovska, M., Kashyap, V. L., Lauer, J., McCollough, M. L., McDowell, J. C., Miller, J. B., Mitschang, A. W., Morgan, D. L., Mossman, A. E., Nichols, J. S., Nowak, M. A., Plummer, D. A., Refsdal, B. L., Rots, A. H., Siemiginowska, A., Sundheim, B. A., Tibbetts, M. S., Van Stone, D. W., Winkelman, S. L., & Zografou, P. 2010, ApJS, 189, 37
- Falco et al. (1999) Falco, E. E., Kurtz, M. J., Geller, M. J., Huchra, J. P., Peters, J., Berlind, P., Mink, D. J., Tokarz, S. P., & Elwell, B. 1999, PASP, 111, 438
- Freeman et al. (2002) Freeman, P. E., Kashyap, V., Rosner, R., & Lamb, D. Q. 2002, ApJS, 138, 185
- Fruchter & Sosey (2009) Fruchter, A., & Sosey, M. 2009 (STScI)
- Fujita & Goto (2004) Fujita, Y., & Goto, T. 2004, PASJ, 56, 621
- Gallagher et al. (2010) Gallagher, S. C., Durrell, P. R., Elmegreen, D. M., Chandar, R., English, J., Charlton, J. C., Gronwall, C., Young, J., Tzanavaris, P., Johnson, K. E., de Oliveira, C. M., Whitmore, B., Hornschemeier, A. E., Maybhate, A., , & Zabludoff, A. 2010, The Astronomical Journal, 139, 545
- Gallagher et al. (2008) Gallagher, S. C., Johnson, K. E., Hornschemeier, A. E., Charlton, J. C., & Hibbard, J. E. 2008, ApJ, 673, 730
- Gallagher et al. (2005) Gallagher, S. C., Richards, G. T., Hall, P. B., Brandt, W. N., Schneider, D. P., & Vanden Berk, D. E. 2005, AJ, 129, 567
- Gehrels (1986) Gehrels, N. 1986, ApJ, 303, 336
- Grebel (1999) Grebel, E. K. 1999, in IAU Symposium, Vol. 192, The Stellar Content of Local Group Galaxies, ed. P. Whitelock & R. Cannon, 17–+
- Harris (1996) Harris, W. E. 1996, AJ, 112, 1487
- Harris (2001) Harris, W. E. 2001, in Saas-Fee Advanced Course 28: Star Clusters, ed. L. Labhardt & B. Binggeli, 223–+
- Haynes & Giovanelli (1984) Haynes, M. P., & Giovanelli, R. 1984, AJ, 89, 758
- Hibbard et al. (2001) Hibbard, J. E., van Gorkom, J. H., Rupen, M. P., & Schiminovich, D. 2001, in Astronomical Society of the Pacific Conference Series, Vol. 240, Gas and Galaxy Evolution, ed. J. E. Hibbard, M. Rupen, & J. H. van Gorkom, 657–+
- Hickson (1982) Hickson, P. 1982, ApJ, 255, 382
- Hickson et al. (1989) Hickson, P., Kindl, E., & Auman, J. R. 1989, ApJS, 70, 687
- Hickson et al. (1992) Hickson, P., Mendes de Oliveira, C., Huchra, J. P., & Palumbo, G. G. 1992, ApJ, 399, 353
- Ho et al. (2001) Ho, L. C., Feigelson, E. D., Townsley, L. K., Sambruna, R. M., Garmire, G. P., Brandt, W. N., Filippenko, A. V., Griffiths, R. E., Ptak, A. F., & Sargent, W. L. W. 2001, ApJ, 549, L51
- Johnson et al. (2007) Johnson, K. E., Hibbard, J. E., Gallagher, S. C., Charlton, J. C., Hornschemeier, A. E., Jarrett, T. H., & Reines, A. E. 2007, AJ, 134, 1522
- Jones et al. (2003) Jones, L. R., Ponman, T. J., Horton, A., Babul, A., Ebeling, H., & Burke, D. J. 2003, MNRAS, 343, 627
- Kalberla et al. (2005) Kalberla, P. M. W., Burton, W. B., Hartmann, D., Arnal, E. M., Bajaja, E., Morras, R., & Pöppel, W. G. L. 2005, A&A, 440, 775
- Kewley et al. (2006) Kewley, L. J., Groves, B., Kauffmann, G., & Heckman, T. 2006, MNRAS, 372, 961
- Konstantopoulos (2009) Konstantopoulos, I. S. 2009, ArXiv e-prints
- Konstantopoulos et al. (2008) Konstantopoulos, I. S., Bastian, N., Smith, L. J., Trancho, G., Westmoquette, M. S., & Gallagher, III, J. S. 2008, ApJ, 674, 846
- Konstantopoulos et al. (2009) Konstantopoulos, I. S., Bastian, N., Smith, L. J., Westmoquette, M. S., Trancho, G., & Gallagher, J. S. 2009, ApJ, 701, 1015
- Konstantopoulos et al. (2010) Konstantopoulos, I. S., Gallagher, S. C., Fedotov, K., Durrell, P. R., Heiderman, A., Elmegreen, D. M., Charlton, J. C., Hibbard, J. E., Tzanavaris, P., Chandar, R., Johnson, K. E., Maybhate, A., Zabludoff, A. E., Gronwall, C., Szathmary, D., Hornschemeier, A. E., English, J., Whitmore, B., Mendes de Oliveira, C., & Mulchaey, J. S. 2010, ApJ, 723, 197
- Lada & Lada (2003) Lada, C. J., & Lada, E. A. 2003, ARA&A, 41, 57
- Leitherer et al. (1999) Leitherer, C., Schaerer, D., Goldader, J. D., González Delgado, R. M., Robert, C., Kune, D. F., de Mello, D. F., Devost, D., & Heckman, T. M. 1999, ApJS, 123, 3
- Majewski et al. (2003) Majewski, S. R., Skrutskie, M. F., Weinberg, M. D., & Ostheimer, J. C. 2003, ApJ, 599, 1082
- Marigo et al. (2008) Marigo, P., Girardi, L., Bressan, A., Groenewegen, M. A. T., Silva, L., & Granato, G. L. 2008, A&A, 482, 883
- Martínez et al. (2010) Martínez, M. A., Del Olmo, A., Coziol, R., & Perea, J. 2010, AJ, 139, 1199
- Mulchaey & Zabludoff (1998) Mulchaey, J. S., & Zabludoff, A. I. 1998, ApJ, 496, 73
- Mullan et al. (2011) Mullan, B., Konstantopoulos, I. S., Kepley, A. A., Lee, K. H., Charlton, J. C., Knierman, K., Bastian, N., Chandar, R., Durrell, P. R., Elmegreen, D., English, J., Gallagher, S. C., Gronwall, C., Hibbard, J. E., Hunsberger, S., Johnson, K. E., Maybhate, A., Palma, C., Trancho, G., & Vacca, W. D. 2011, ArXiv e-prints
- Muratov & Gnedin (2010) Muratov, A. L., & Gnedin, O. Y. 2010, ArXiv e-prints
- Newberg et al. (2007) Newberg, H. J., Yanny, B., Cole, N., Beers, T. C., Re Fiorentin, P., Schneider, D. P., & Wilhelm, R. 2007, ApJ, 668, 221
- Niederste-Ostholt et al. (2010) Niederste-Ostholt, M., Belokurov, V., Evans, N. W., & Peñarrubia, J. 2010, ApJ, 712, 516
- Palma et al. (2002) Palma, C., Zonak, S. G., Hunsberger, S. D., Charlton, J. C., Gallagher, S. C., Durrell, P. R., & English, J. 2002, AJ, 124, 2425
- Peng et al. (2010a) Peng, C. Y., Ho, L. C., Impey, C. D., & Rix, H.-W. 2010a, AJ, 139, 2097
- Peng et al. (2010b) —. 2010b, AJ, 139, 2097
- Pirzkal et al. (2005) Pirzkal, N., Sahu, K. C., Burgasser, A., Moustakas, L. A., Xu, C., Malhotra, S., Rhoads, J. E., Koekemoer, A. M., Nelan, E. P., Windhorst, R. A., Panagia, N., Gronwall, C., Pasquali, A., & Walsh, J. R. 2005, ApJ, 622, 319
- Popescu & Hanson (2010) Popescu, B., & Hanson, M. M. 2010, ApJ, 724, 296
- Rejkuba et al. (2005) Rejkuba, M., Greggio, L., Harris, W. E., Harris, G. L. H., & Peng, E. W. 2005, ApJ, 631, 262
- Rhode et al. (2007) Rhode, K. L., Zepf, S. E., Kundu, A., & Larner, A. N. 2007, AJ, 134, 1403
- Robin et al. (2003) Robin, A. C., Reylé, C., Derrière, S., & Picaud, S. 2003, A&A, 409, 523
- Rubin et al. (1990) Rubin, V. C., Hunter, D. A., & Ford, Jr., W. K. 1990, ApJ, 365, 86
- Rudick et al. (2006) Rudick, C. S., Mihos, J. C., & McBride, C. 2006, ApJ, 648, 936
- Scheepmaker et al. (2007) Scheepmaker, R. A., Haas, M. R., Gieles, M., Bastian, N., Larsen, S. S., & Lamers, H. J. G. L. M. 2007, A&A, 469, 925
- Schlegel et al. (1998) Schlegel, D. J., Finkbeiner, D. P., & Davis, M. 1998, ApJ, 500, 525
- Schweizer & Seitzer (1998) Schweizer, F., & Seitzer, P. 1998, AJ, 116, 2206
- Sérsic (1968) Sérsic, J. L. 1968, Atlas de galaxias australes (Observatorio Astronomico)
- Silva et al. (1998) Silva, L., Granato, G. L., Bressan, A., & Danese, L. 1998, ApJ, 509, 103
- Silva-Villa & Larsen (2011) Silva-Villa, E., & Larsen, S. 2011, ArXiv e-prints
- Sirianni et al. (2005) Sirianni, M., Jee, M. J., Benítez, N., Blakeslee, J. P., Martel, A. R., Meurer, G., Clampin, M., De Marchi, G., Ford, H. C., Gilliland, R., Hartig, G. F., Illingworth, G. D., Mack, J., & McCann, W. J. 2005, PASP, 117, 1049
- Skrutskie et al. (2006) Skrutskie, M. F., Cutri, R. M., Stiening, R., Weinberg, M. D., Schneider, S., Carpenter, J. M., Beichman, C., Capps, R., Chester, T., Elias, J., Huchra, J., Liebert, J., Lonsdale, C., Monet, D. G., Price, S., Seitzer, P., Jarrett, T., Kirkpatrick, J. D., Gizis, J. E., Howard, E., Evans, T., Fowler, J., Fullmer, L., Hurt, R., Light, R., Kopan, E. L., Marsh, K. A., McCallon, H. L., Tam, R., Van Dyk, S., & Wheelock, S. 2006, AJ, 131, 1163
- Smith et al. (2007) Smith, L. J., Bastian, N., Konstantopoulos, I. S., Gallagher, III, J. S., Gieles, M., de Grijs, R., Larsen, S. S., O’Connell, R. W., & Westmoquette, M. S. 2007, ApJL, 667, L145
- Tago et al. (2008) Tago, E., Einasto, J., Saar, E., Tempel, E., Einasto, M., Vennik, J., & Müller, V. 2008, A&A, 479, 927
- The & White (1986) The, L. S., & White, S. D. M. 1986, AJ, 92, 1248
- Trancho et al. (2007) Trancho, G., Bastian, N., Miller, B. W., & Schweizer, F. 2007, ApJ, 664, 284
- Tzanavaris et al. (2010) Tzanavaris, P., Hornschemeier, A. E., Gallagher, S. C., Johnson, K. E., Gronwall, C., Immler, S., Reines, A. E., Hoversten, E., & Charlton, J. C. 2010, ApJ, 716, 556
- Verdes-Montenegro et al. (1998) Verdes-Montenegro, L., Yun, M. S., Perea, J., del Olmo, A., & Ho, P. T. P. 1998, ApJ, 497, 89
- Verdes-Montenegro et al. (2001) Verdes-Montenegro, L., Yun, M. S., Williams, B. A., Huchtmeier, W. K., Del Olmo, A., & Perea, J. 2001, A&A, 377, 812
- Walker et al. (2010) Walker, L. M., Johnson, K. E., Gallagher, S. C., Hibbard, J. E., Hornschemeier, A. E., Tzanavaris, P., Charlton, J. C., & Jarrett, T. H. 2010, AJ, 140, 1254
- White et al. (2003) White, P. M., Bothun, G., Guerrero, M. A., West, M. J., & Barkhouse, W. A. 2003, ApJ, 585, 739
- Xue et al. (2011) Xue, Y. Q., Luo, B., Brandt, W. N., Bauer, F. E., Lehmer, B. D., Broos, P. S., Schneider, D. P., Alexander, D. M., Brusa, M., Comastri, A., Fabian, A. C., Gilli, R., Hasinger, G., Hornschemeier, A. E., Koekemoer, A., Liu, T., Mainieri, V., Paolillo, M., Rafferty, D. A., Rosati, P., Shemmer, O., Silverman, J. D., Smail, I., Tozzi, P., & Vignali, C. 2011, ApJS, 195, 10
- Yanny et al. (2009) Yanny, B., Newberg, H. J., Johnson, J. A., Lee, Y. S., Beers, T. C., Bizyaev, D., Brewington, H., Fiorentin, P. R., Harding, P., Malanushenko, E., Malanushenko, V., Oravetz, D., Pan, K., Simmons, A., & Snedden, S. 2009, ApJ, 700, 1282
- York et al. (2000) York, D. G., Adelman, J., Anderson, Jr., J. E., Anderson, S. F., Annis, J., Bahcall, N. A., Bakken, J. A., Barkhouser, R., Bastian, S., Berman, E., Boroski, W. N., Bracker, S., Briegel, C., Briggs, J. W., Brinkmann, J., Brunner, R., Burles, S., Carey, L., Carr, M. A., Castander, F. J., Chen, B., Colestock, P. L., Connolly, A. J., Crocker, J. H., Csabai, I., Czarapata, P. C., Davis, J. E., Doi, M., Dombeck, T., Eisenstein, D., Ellman, N., Elms, B. R., Evans, M. L., Fan, X., Federwitz, G. R., Fiscelli, L., Friedman, S., Frieman, J. A., Fukugita, M., Gillespie, B., Gunn, J. E., Gurbani, V. K., de Haas, E., Haldeman, M., Harris, F. H., Hayes, J., Heckman, T. M., Hennessy, G. S., Hindsley, R. B., Holm, S., Holmgren, D. J., Huang, C., Hull, C., Husby, D., Ichikawa, S., Ichikawa, T., Ivezić, Ž., Kent, S., Kim, R. S. J., Kinney, E., Klaene, M., Kleinman, A. N., Kleinman, S., Knapp, G. R., Korienek, J., Kron, R. G., Kunszt, P. Z., Lamb, D. Q., Lee, B., Leger, R. F., Limmongkol, S., Lindenmeyer, C., Long, D. C., Loomis, C., Loveday, J., Lucinio, R., Lupton, R. H., MacKinnon, B., Mannery, E. J., Mantsch, P. M., Margon, B., McGehee, P., McKay, T. A., Meiksin, A., Merelli, A., Monet, D. G., Munn, J. A., Narayanan, V. K., Nash, T., Neilsen, E., Neswold, R., Newberg, H. J., Nichol, R. C., Nicinski, T., Nonino, M., Okada, N., Okamura, S., Ostriker, J. P., Owen, R., Pauls, A. G., Peoples, J., Peterson, R. L., Petravick, D., Pier, J. R., Pope, A., Pordes, R., Prosapio, A., Rechenmacher, R., Quinn, T. R., Richards, G. T., Richmond, M. W., Rivetta, C. H., Rockosi, C. M., Ruthmansdorfer, K., Sandford, D., Schlegel, D. J., Schneider, D. P., Sekiguchi, M., Sergey, G., Shimasaku, K., Siegmund, W. A., Smee, S., Smith, J. A., Snedden, S., Stone, R., Stoughton, C., Strauss, M. A., Stubbs, C., SubbaRao, M., Szalay, A. S., Szapudi, I., Szokoly, G. P., Thakar, A. R., Tremonti, C., Tucker, D. L., Uomoto, A., Vanden Berk, D., Vogeley, M. S., Waddell, P., Wang, S., Watanabe, M., Weinberg, D. H., Yanny, B., & Yasuda, N. 2000, AJ, 120, 1579
- Zabludoff & Mulchaey (2000) Zabludoff, A. I., & Mulchaey, J. S. 2000, ApJ, 539, 136