Overdensities of Y-dropout Galaxies from the Brightest-of-Reionizing Galaxies Survey: A Candidate Protocluster at Redshift 111Based on observations made with the NASA/ESA Hubble Space Telescope, which is operated by the Association of Universities for Research in Astronomy, Inc., under NASA contract NAS 5-26555. These observations are associated with Program .
Abstract
Theoretical and numerical modeling of the assembly of dark-matter halos predicts that the most massive and luminous galaxies at high redshift are surrounded by overdensities of fainter companions. We test this prediction with Hubble Space Telescope observations acquired by our Brightest of Reionizing Galaxies (BoRG) survey, which identified four very bright candidates as -dropout sources in four of the 23 non-contiguous WFC3 fields observed. We extend here the search for -dropouts to fainter luminosities ( galaxies with ), with detections at confidence (compared to the confidence threshold adopted earlier) identifying 17 new candidates. We demonstrate that there is a correlation between number counts of faint and bright -dropouts at confidence. Field BoRG58, which contains the best bright candidate (), has the most significant overdensity of faint -dropouts. Four new sources are located within (corresponding to comoving at ) from the previously known brighter candidate. The overdensity of -dropouts in this field has a physical origin to very high confidence (), independent of completeness and contamination rate of the -dropout selection. We modeled the overdensity by means of cosmological simulations and estimate that the principal dark matter halo has mass ( density peak) and is surrounded by several halos which could host the fainter dropouts. In this scenario, we predict that all halos will eventually merge into a galaxy cluster by . Follow-up observations with ground and space based telescopes are required to secure the nature of the overdensity, discover new members, and measure their precise redshift.
Subject headings:
galaxies: evolution — galaxies: high-redshift1. Introduction
A growing number of galaxies at is being discovered with Wide Field Camera 3 (WFC3) on the Hubble Space Telescope (Oesch et al., 2010; Bouwens et al., 2010a; McLure et al., 2010; Finkelstein et al., 2010; Wilkins et al., 2010; Yan et al., 2011; Trenti et al., 2011). These galaxies are identified from deep imaging in multiple bands, showing the signature of absorption of photons with wavelength shorter than Lyman- (Ly) at by intervening neutral hydrogen (Steidel et al., 1996). Based on the wavelength range of the filter in which the photometric break is observed, an approximate redshift is derived. The Lyman-break technique has been validated extensively with spectroscopic follow-ups of large samples at (Malhotra et al., 2005; Stark et al., 2010; Ono et al., 2011; Pentericci et al., 2011). Non-ambiguous redshift measurements for galaxies at are missing despite several attempts, possibly because of an increase in the neutral fraction of hydrogen compared to lower redshift (Lehnert et al., 2010; Schenker et al., 2011).
HST observations and their ground-based spectroscopic follow-ups are providing a glimpse of the formation of stars and galaxies during the epoch of hydrogen reionization at , showing a declining star formation rate as the redshift increases and a rapidly evolving galaxy luminosity function (Bouwens et al., 2011). The evolution of the luminosity function is consistent with the expected evolution of the dark-matter halo mass function: at higher redshift, massive dark-matter halos become progressively rarer and the typical mass evolves toward smaller values (Trenti et al., 2010; Finlator et al., 2011; Jaacks et al., 2011). It is thus not surprising that the majority of galaxies, identified from pencil-beam surveys such as the HUDF, are faint, with magnitudes .
To search for the brightest and rarest galaxies, we are carrying out a large area medium-deep HST survey along random lines of sight (Trenti et al. 2011, hereafter T11). Bright galaxies, such as those identified by our Brightest of Reionizing Galaxies (BoRG) survey, are expected to be highly clustered and to be found preferentially in groups rather than in isolation. This scenario has been verified observationally out to by several groups, both in the context of Ly emitters (Shimasaku et al., 2003; Venemans et al., 2004; Ouchi et al., 2005) and of Lyman-break galaxies (Overzier et al., 2006a; Zheng et al., 2006; Cooke et al., 2008; Utsumi et al., 2010; Capak et al., 2011a). Clustering of sources around a rare, bright galaxy extends to less luminous companions, under a broad assumption that galaxy luminosity is correlated with the mass of the dark-matter host halo. This provides an indirect test to investigate whether the bright galaxy is at high redshift rather than a foreground contaminant that entered into the Lyman-break photometric selection window (Muñoz & Loeb, 2008a).
In T11, we identified four candidates with and detections at confidence from an area of approximately arcmin2. In this paper we revisit the search for candidates in the BoRG survey, extending the selection to fainter sources, detected at confidence. Our goal is to test whether the brightest candidates are preferentially associated with overdensities of fainter dropouts, thereby providing support for the nature of the bright candidate based on the findings by Muñoz & Loeb (2008a). Our particular focus is on field BoRG58, which contains the galaxy with the highest signal-to-noise ratio (S/N) found in the survey so far, with J-band magnitude (T11). The photometric quality of the data available for the field allow us to extend the search for fainter dropout sources with .
This paper is organized as follows. In Section 2 we summarize the data reduction and analysis, and in Section 3 we investigate the clustering of the newly identified -dropouts. In Section 4 we discuss the properties of the -dropouts in field BoRG58 and perform extensive tests to evaluate the likelihood that we are observing a 3D, physical overdensity in that field. Section 5 compares our observations to theoretical/numerical models. Section 6 summarizes our findings and concludes by discussing the outlook for follow-up observations to strengthen the results obtained in this work. We adopt WMAP5 cosmology (Komatsu et al., 2009) and the AB magnitude scale (Oke, 1974).
2. Data Reduction and Dropout Selection
The BoRG survey is a four-band (F606W, F098M, F125W, F160W) pure-parallel HST/WFC3 survey designed primarily to identify bright galaxies () at based on their broad-band colors using the Lyman-break technique (Steidel et al., 1996). Data are associated primarily with program GO-11700 (PI Trenti), complemented by program GO-11702 (PI Yan; see Yan et al. 2011). In this paper we consider the data from GO-11700 (23 out of 29 WFC3 pure-parallel pointings) to guarantee a uniform design of the observations, as described in T11. Exposure times vary from pointing to pointing because of the pure-parallel nature of the survey and are reported, along with the limiting magnitudes in Table 1 of T11. For reference, we report here the exposure times and limits for field BoRG58, which contains the best candidate identified in T11. That field, centered at , (J2000 system), was observed with the following exposure times (also indicated is the sensitivity within an aperture of radius ). F125W: (); F160W: (); F098M: (); F606W: ().
The observations are designed so that at least two different exposures per filter were taken in each field, but there is no dithering, as the spectroscopic primary observations do not use it. Individual exposures have been calibrated first with calwfc3, then aligned and registered on a common scale using multidrizzle (Koekemoer et al., 2002).
We identified sources from the images using SExtractor in dual image mode (Bertin & Arnouts, 1996), requiring at least 9 contiguous pixels with after normalization of the RMS maps as discussed in T11. Sources are accepted in our final catalog if they pass a minimum signal-to-noise (S/N) threshold with in and in for ISOMAG fluxes. For Gaussian noise, uncorrelated in the two bands, there is a probability that a noise fluctuation satisfies our source-selection criteria. This illustrates that the likelihood of introducing spurious sources within this catalog is very low, as demonstrated quantitatively in Section 4.
2.1. Lyman-break selection and contamination
To select candidates, we impose the following conditions on the sources in the catalog:
| (1) |
| (2) |
and we finally require non-detection in (). Flux measurements are corrected for foreground Galactic extinction using the maps by Schlegel et al. (1998). For the determination of the color, we replace the flux in with its upper limit if the measurement is below that limit. This is the standard practice for the Lyman-break galaxy selection (e.g., Bouwens et al. 2007). A different selection technique, based on the fit of the observed fluxes in all bands available to construct a photometric redshift probability distribution, may resort to upper limits (e.g., see McLure et al., 2010). In this respect, we note that our flux-replacement for the Y-J color would be equivalent to a replacement while at the same time requiring a slightly less prominent break, that is . Such selection is still more conservative than adopted by Bouwens et al. (2010a), which nevertheless resorts to limits.
We measure the near-IR colors based on isophotal photometry without Point Spread Function (PSF) corrections, an approach that optimizes the signal-to-noise ratio, as determined by extensive Monte-Carlo simulations of artificial source recovery (Oesch et al., 2007). This approach has been adopted in several other studies (Oesch et al. 2009; Oesch et al. 2010; T11). Alternative approaches include resorting to either fixed apertures (see Bunker et al. 2010) or to Kron-line elliptical apertures (see Bouwens et al. 2007). The variety of approaches present in the literature suggests that a gold standard is missing, primarily because results are comparable among all different methods, as shown by Finkelstein et al. (2010). In addition, we verified directly that the impact of PSF corrections on the colors of the -dropouts in the BoRG survey is small. For this purpose, we corrected the isophotal photometry based on the WFC3 PSF model provided by STScI222http://www.stsci.edu/hst/wfc3/ir_ee_model_smov.dat, interpolating the data provided over wavelength and radius. For the radius, we defined an effective aperture radius for each dropout based on the isophotal area used for the photometry. Faint dropouts are typically detected over an average of 20 pixels, that is an effective radius of . This leads to small corrections (compared to the random error on the colors): and .
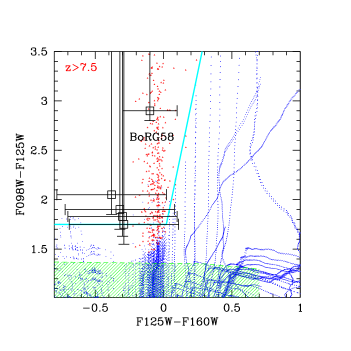
Our color-color selection includes objects in the redshift range and is efficient at rejecting low-redshift interlopers and brown-dwarf stars (Figure 1; see also Bouwens et al. 2010a). The most likely contaminants in the color selection are galaxies with either a prominent Balmer break or with strong emission lines. In T11, we estimated a contamination fraction based on population synthesis modeling, which includes templates with emission lines, and comparison with the GOODS/ERS data for the bright dropouts discussed there.
Recently, Atek et al. (2011) extrapolated data from a spectroscopic survey shallower than BoRG to derive a contamination rate from low- galaxies with strong emission lines in the BoRG survey of one bright -dropout every 17 fields. They suggested that galaxies with a very faint continuum and flux in the J and H band given primarily by line emission (O II, ; O III, , and , ) can enter our photometric selection window. For a galaxy with , this implies a line flux . Observationally, we have no evidence that this is the case for the bright -dropout in field BoRG58, which has been followed-up with Keck spectroscopy. Schenker et al. (2011) observed that bright galaxy candidate with NIRSPEC, covering the wavelength range and reaching a median sensitivity of in the N1 filter and in the N2 filter. No emission lines were detected. If the candidate had been an emission-line contaminant as suggested by Atek et al. (2011), the line would have been clearly detected (at confidence), unless the contaminant has an O III line located in a very narrow region of the spectrum with around . All other configurations are ruled out. In fact, if the flux in J is due to O III (), O III moves redward of the filter for O II at . If instead the flux is due to O III (), then moves out of for O III at . Spectroscopic follow-up is therefore efficient at identifying this class of contaminants. In the case of the BoRG58 field, the observations of Schenker et al. (2011) essentially rule out that the brightest -dropout is an emission-line contaminant.
Because we are focusing here on fainter sources, we revisited our estimate of contamination. For the fainter dropouts near the selection limit of our survey, we estimate that contamination can reach . This is comparable to that reported by Bouwens et al. (2010a) for ERS -dropouts (where there is an expected contamination; see also McLure et al. 2011; Capak et al. 2011b). Our data are less deep in the optical bands, but we impose more stringent near-IR color-color cuts, which reduce the impact of photometric scatter at the expense of reduced completeness of our faint sample.
Other sources of possible contaminants are galactic ultra-cool stars, which have red colors (Knapp et al., 2004). However, the use of F098M as a dropout filter is efficient at rejecting this class of contaminants when combined with our selection criteria . As shown in Fig. 1, the locus of brown dwarfs is well separated from our selection window for -dropouts. Ryan et al. (2011) searched for brown dwarf stars in a data-set that included all the BoRG fields considered here and identified a total of 17 ultra-cool stars in arcmin2. All their candidates have , so it is unlikely that any faint and unresolved source with has stellar origin.
3. Correlation between faint and bright -dropouts in the BoRG survey
The Lyman-break selection for faint sources discussed in Section 2.1 has been applied to the 23 BoRG fields from program GO-11700, with the goal of investigating whether the BoRG survey contains evidence of clustering of fainter -dropouts around the brighter sources identified in T11. Sources have been inspected visually to ensure that they are not artifacts such as hot pixels, diffraction spikes of stars, or outer regions of brighter foreground galaxies.
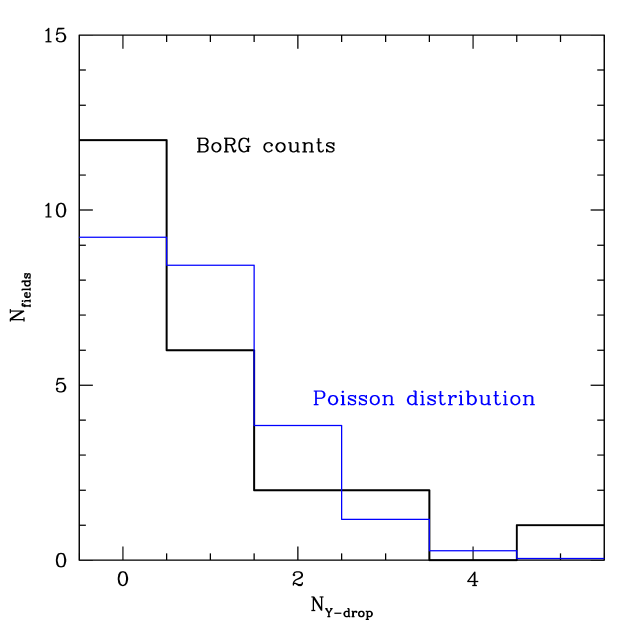
A total of 21 sources satisfy the -dropout selection (Table 1). Therefore, we identify 17 new candidates (defined as “faint” sample) in addition to the four published in T11 (defined as “bright” sample). The “bright” versus “faint” classification is based on a S/N selection in the band, with bright meaning . The number counts per field of the 21 candidates are distributed as follows. Twelve fields have no sources satisfying our selection criteria, and six fields contain a single faint candidate. The remaining five fields have multiple candidates. Four of these five fields are those that contain one of the bright candidates published in T11. In BoRG1k and BoRG66 we find an additional -dropout. BoRG0t has two faint dropouts in addition to the bright one we already reported, while four additional candidates have been discovered in field BoRG58. Finally, three candidates are present in field BoRG0y, including one with that barely misses the S/N cutoff adopted in T11 ( detection at confidence, at ). Table 1 summarizes our findings. The distribution of the number counts is presented in Figure 2 and compared to the expectation from the null hypothesis (no clustering), which is a Poisson distribution with average value . This comparison has been suggested as a method to infer the clustering properties of dropout samples in pure-parallel surveys Robertson (2010). Visual inspection immediately identifies the excess at (field BoRG58), which will be investigated in detail in the subsequent sections of the paper. The remaining of the number-counts distribution appears to deviate slightly from Poisson, but because of the small number of fields and dropouts per field, a marked difference is neither expected nor statistically significant. At low number counts, Poisson uncertainty dominates the contribution to the standard deviation of the distribution (Trenti & Stiavelli, 2008; Robertson, 2010).
To analyze the clustering of dropouts, there is however fundamental information that is not conveyed in Figure 2: All four fields with a bright candidate from T11 contain at least a second, fainter, -dropout. To investigate the chance of this happening, we resorted to a Monte-Carlo simulation to derive the probability that a random distribution of the 17 new sources among the 23 fields analyzed leads to eight or more faint sources in the four fields with a brighter candidate, with a minimum of one source for each field. We carried out random realizations and derived that such occurrence has probability . Therefore, the association between the newly discovered dropouts and the brighter previously reported sources is significant at greater than confidence. The presence of multiple dropouts in field BoRG0y qualitatively strengthens the confidence of the result, as the brightest dropout in that field barely misses the S/N cutoff of T11 and therefore our definition of “bright” dropout.
Our choice to define “bright” and “faint” dropouts based on a S/N measurement rather than absolute luminosity minimizes the impact of differences in the exposure times among the BoRG fields. In fact, the luminosity function of -dropouts around the detection limit of the BoRG survey, , can be locally approximated by a power law, so that the relative expected abundance of bright and faint sources is approximately uniform across the survey. In addition, we verified that the correlation in the number counts between the faint and bright sample of dropouts is not arising because the fields containing bright candidates have deeper integration times. The integration time of the fields containing a dropout identified in T11 is representative for the survey: of the four, two have below median depths and two are above median. In particular, field BoRG58, containing the most significant excess of dropouts, has an exposure time s in F125W, only slightly deeper than the median exposure of the survey ( s in F125W).
Foreground Galactic reddening is not the cause of the observed correlation between faint and bright dropouts. From the Schlegel et al. (1998) maps, all fields with candidates have low extinction values (). The average extinction for the sample of the four fields with bright candidates is (and BoRG58 has ), while the average extinction for the fields containing only faint candidates is . Such low extinction values imply that the reddening corrections we apply to our near-IR photometry are very small ().
Finally, we note that the analysis presented here on the correlation between bright and faint dropouts is completely independent of contamination and completeness of the selection, as it is uniquely based on number counts. Both contamination and incompleteness actually contribute toward reducing the significance of clustering. In fact, if the sample of dropouts consists of a population of bona-fide objects plus some contaminants at , no angular cross-correlation is present between the two populations. In such case, the clustering signal is less strong than for the case in which the whole sample is in the same redshift interval. Incompleteness also reduces clustering. For a fixed number of objects, an incomplete sample contains objects at fainter luminosities compared to a complete sample. Because galaxy luminosity correlates with halo mass, this reduces the average bias of the population (Trenti & Stiavelli, 2008)333This effect is also illustrated by our public cosmic variance calculator available at http://casa.colorado.edu/~trenti/CosmicVariance.html.
So far, our analysis has focused only on the global correlation of counts in the survey, showing that faint dropouts are preferentially found in fields with bright dropouts at a confidence level greater than 99.84% regardless of contamination and completeness of the selection. In the next Section we investigate in details the properties of field BoRG58, which contains the highest number of dropouts among the BoRG survey fields.
4. Candidate Lyman-Break Galaxies in Field BoRG58
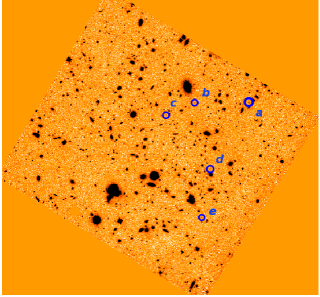
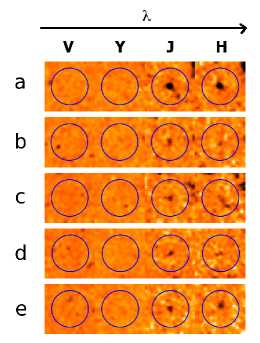
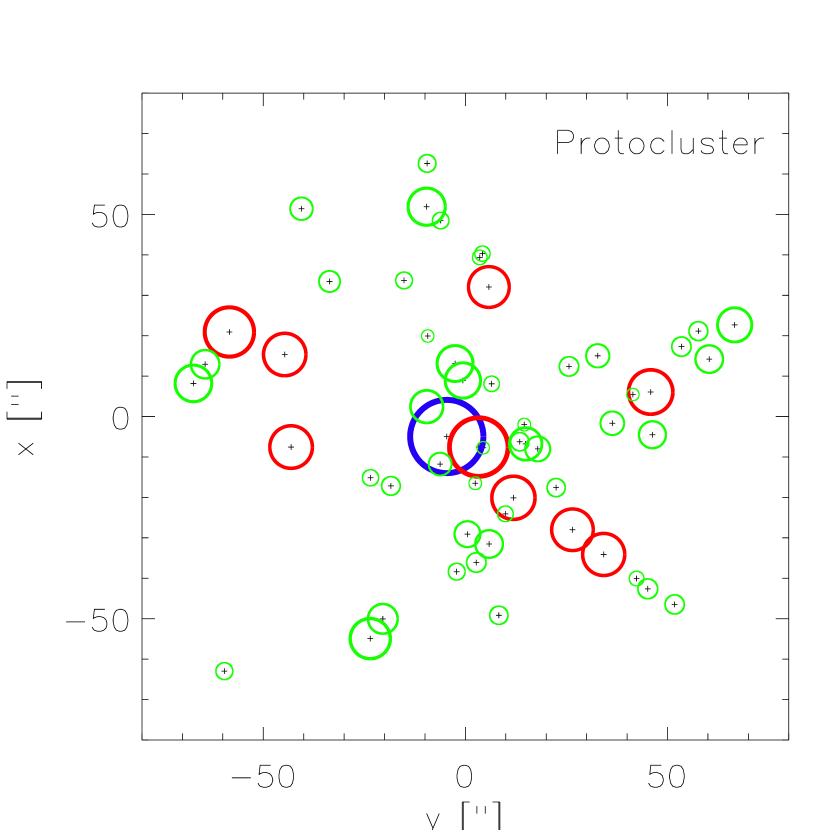
Five objects within field BoRG58 satisfy the selection criteria for -dropout sources (see Table 2). In addition to the source BoRG58_17871420 discussed in T11, we identify four additional sources with magnitudes . All candidates are located within a subregion of diameter of the WFC3 field (Figure 3). At , this separation corresponds to comoving Mpc. All sources are undetected in and consistent with the same redshift of (Figure 1 and Table 2). The average color of the four fainter sources (BoRG58_14061418 - BoRG58_14550613) appears marginally bluer () than that of the brightest galaxy (BoRG58_17871420). About half of this difference is accounted by PSF effects. The bright dropout is detected over a larger effective radius (), hence the difference in encircled energy between and is smaller ( versus derived for the fainter dropouts). The remaining difference after PSF match ( could be due to faint galaxies having bluer UV slopes (Bouwens et al., 2010b).
As field BoRG58 appears unique among the survey, we performed several tests with the goal (1) of establishing that the dropouts are real galaxies rather than noise peaks and (2) of quantifying the statistical significance of the dropout overdensity in the field.
4.1. Tests to establish reality of the dropouts
To demonstrate that the detections of the four fainter sources BoRG58_14061418 - BoRG58_14550613 are real, we performed the following tests.
Data quality control: We verified that the RMS maps around the source locations are regular and do not indicate hot/anomalous pixels.
Negative image test: This test allows us to characterize non-gaussianity in the tails of the noise distribution and therefore to assess the likelihood that detections at confidence are spurious. Using the SExtractor segmentation map, we masked sources in our detection image (), replacing the pixels at these locations with pixels sampled randomly from regions of the image not containing any source. We then inverted the image and proceeded to run SExtractor with the same parameters used for the actual science image. In the negative image, no sources are detected at confidence level . Hence it is unlikely that the four dropouts BoRG58_14061418 - BoRG58_14550613 are spurious sources as they are detected at in the science image.
H-image random shift test: Next, we evaluated the likelihood that the low-significance detection () in arises from noise fluctuations, rather than being intrinsically associated to flux from sources detected in . This is especially important in light of the minor misalignment () of BoRG58_14550613 in these two filters (see Figure 3). In this test we essentially replace the science image in the H band with a noise-only image. Therefore, we should expect that the number of sources that have flux in both the and bands at level sufficient to pass the -dropout selection is much smaller compared to the number of sources found when using the H-band science image. For this test, we masked sources in the image as described above for the negative image test. Next, we randomly shifted it along both axes using periodic boundary conditions. Then we ran SExtractor and constructed source catalogs in all bands, replacing with the masked and shifted copy. We repeated the experiment 100 times with different shifts, determining an expected contamination of objects in the -dropouts catalog (a total of three objects among the 100 MC realizations, with at most one dropout per realization). The probability of detecting four objects when are expected is . This test thus clearly shows that the four faint sources surrounding the brighter BoRG58_17871420 have correlated flux in the and images, strengthening the likelihood that they are real.
Detector-induced noise test: Next, we evaluated whether correlated flux in and arises from detector noise (e.g., charge persistence). The BoRG survey observations have been designed so that exposures in and are preceded in the same HST orbit by a exposure of comparable length; additional time is devoted to imaging in different orbits (T11). Without dithering, a source falls on the same detector pixels in every IR filter for exposures in any given orbit. We thus combined with multidrizzle the subset of observations in the two orbits shared with and (visits 60 and 62) and measured the flux at the location of the dropouts. All dropouts have in this sub-image, in agreement with the non-detection using the full combination of all exposures. This demonstrates that the detector pixels where the dropout sources are located in and are not providing anomalously high electron counts. This test also demonstrates that the faint dropouts are not spurious sources induced by detector persistence. Otherwise, the sub-image would have been affected more than the one (see T11 for a more detailed discussion of our optimization of the exposure sequence to avoid persistence-induced spurious dropouts). Instrumental origin of the correlated flux in and for the faint dropouts is ruled out.
4.2. Contamination and completeness
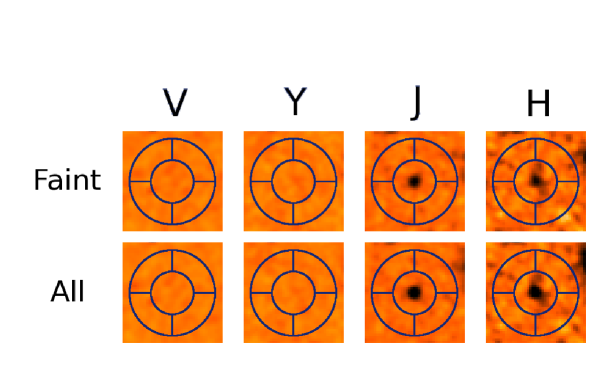
Improved rejection of contaminants: We stacked the images of the five -dropouts identified in the BoRG58 field to verify that there is no flux in the and bands (see Figure 5). Within a circular aperture of radius , there is indeed no measured flux in these bands, both for the stack of the four fainter sources as well as for the stack of all five objects. Within the same aperture, the stacked images of the four fainter sources have in and in . These values are consistent with the ISOMAG S/N measured by SExtractor for the individual sources (Table 2). Stacking allows us to set limits that are mag deeper than each individual non-detection in and , ruling out to higher confidence the possibility that the majority of the dropouts are low-redshift contaminants.
Dwarf-star contamination: As discussed in Section 2.1, our -dropout selection is highly unlikely to include Galactic ultra-cool dwarfs because we require , while these stars have (Ryan et al., 2011). Furthermore, such contamination is even less likely in field BoRG58 compared to a typical field in the BoRG survey. In fact, the BoRG58 line of sight has a high Galactic latitude () which is in the top of the distribution for among the survey fields considered here. Finally, we measured size and ellipticity for the dropouts and compared them to the PSF. The profiles of both the bright dropout itself as well as of a stack of all faint dropouts show clear signs of elongation in both J and H bands (ellipticity ), unlike expected for a star (ellipticity ). While the PSF is undersampled in our images due to the lack of dithering, the stacks and the bright dropout are also found to be wider than the PSF (FWHM for the sources versus FWHM= for the PSF). Therefore, these tests provide further direct evidence that contributes to excluding stellar contamination.
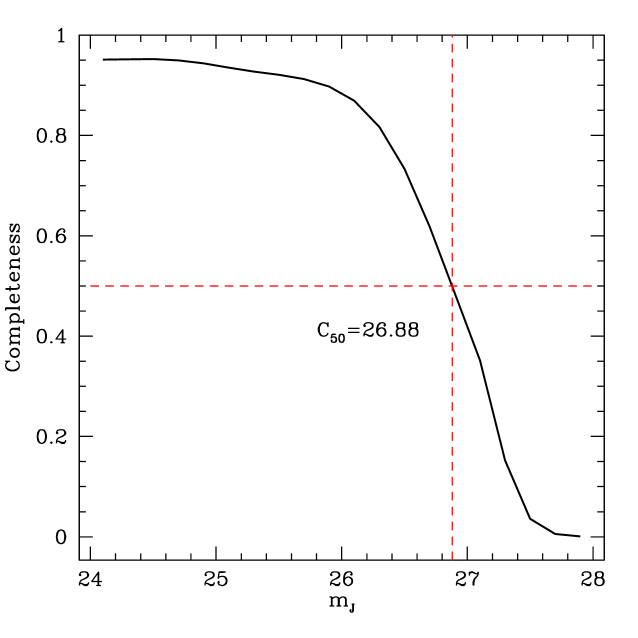
Completeness: We resorted to Monte-Carlo experiments that recover artificial sources of varying brightness to evaluate the completeness of the data, following the method of Oesch et al. (2007). Our code evaluates the fraction of input galaxies (modeled as Sersic profiles) that are recovered as a function of magnitude given our catalog construction and color-color selection criteria. We used input galaxies with magnitude and a Gaussian UV-slope distribution (). We simulated galaxies in the redshift range and adopted a log-normal input size distribution with mean radius . We find completeness at and completeness at , corresponding to the magnitude of our faintest candidate (see Fig. 4).
4.3. Statistical significance of clustering in BoRG58
In this section we quantify the statistical significance of the clustering of dropouts in field BoR58. First we compare the overdensity observed against Poisson statistics, which has the advantage of providing a measure of the clustering significance that is independent of contamination and completeness as we discuss in Section 3. Next, we include the effect of cosmic variance (galaxy clustering) to assess the overdensity significance.
As discussed in Section 3, field BoRG58 contains the highest number of dropouts among the fields searched. From a simple counts-in-cell statistics considering the full field of view of WFC3, we derive that an overdensity of dropouts or more under the expectation of is realized with probability under Poisson statistics. As field BoRG58 was identified in T11 as the one containing the best and most robust candidate in the survey, therefore establishing an a priori expectation for clustering, we are justified in considering the dropout overdensity significant at confidence. If we were to consider a more conservative measure and consider the probability of finding one overdensity with -dropouts among the four fields with a bright candidate from T11, we would still obtain that the dropouts are clustered at confidence.
Furthermore, the dropouts in BoRG58 are located within a subregion of the WFC3 field of view; therefore the overdensity is even more significant. To correctly model the finite field of view and edge effects, we resorted to a Monte-Carlo simulation to quantify the probability that five sources are located within a region with within the WFC3 field if they are distributed uniformly with per full WFC3 field. Such configuration happens with probability for field BoRG58, or with probability under a more robust measure of requiring one overdensity among the four fields with bright dropouts. In both cases, the significance of the overdensity is increased by a factor compared to the counts-per-field estimate.
The comparison with Poisson statistics demonstrates, to very high confidence level (), that the overdensity of sources in field BoRG58 is physical rather than originating from random fluctuations. The distribution of galaxy counts in pencil-beam surveys differs from Poisson statistics because of clustering (cosmic variance), as measured from the two-point correlation function (Peebles, 1980). Therefore we take into account cosmic variance to evaluate whether the overdensity of galaxies in BoRG58 is likely associated to a protocluster of galaxies, with the (majority of) dropouts in a narrow redshift range. The alternative scenario is a fluctuation in the number counts that is made more probable because of projected galaxy clustering from sources that are at different redshift within the -dropout selection window.
As discussed in Section 3, the -dropout sample has the highest bias (that is strongest clustering) in the case where the survey is complete and there is no contamination. We recall that this is because an incomplete survey samples lower halo masses and because contaminants and dropouts have no cross-correlation. If we assume a mean number density of candidates per WFC3 field, we derive from our cosmic variance calculator a bias444Note that the bias of the population of contaminants is significantly lower than the bias of sources with the same luminosity. From the conditional luminosity function model of Cooray (2005), a contaminant at with observed magnitude () is expected to live in a dark-matter halo of mass with bias . , that is a cosmic variance of (Trenti & Stiavelli, 2008). This estimate relies on an abundance match of high-redshift galaxies with dark-matter halos, which is the working assumption adopted by several studies (Newman & Davis, 2002; Somerville et al., 2004; Trenti & Stiavelli, 2008; Muñoz et al., 2010; Robertson, 2010). This modeling has been tested observationally at by determination of the two-point correlation function of Lyman-break galaxies (Overzier et al., 2006b; Lee et al., 2009), and indirectly at because conditional luminosity function models correctly predict the observed abundance of dropout galaxies in the HUDF and ERS/CANDELS surveys (Trenti et al., 2010; Oesch et al., 2011). In any case, the uncertainty in the bias of the Y-dropout sample propagates only mildly into the final determination of the number counts fluctuations. This is because cosmic variance and Poisson dispersion are summed in quadrature; therefore, when the expected number of objects per field is smaller or comparable to unity, Poisson uncertainty dominates the total dispersion. In fact, if we assume a pencil beam of with redshift selection (T11), we derive a variance of -dropouts per cell of diameter around their average value of . That means that the overdensity of five -dropouts in BoRG58 is significant at , after including the effects of galaxy clustering. For reference, under Poisson statistics the overdensity would have been significant at the level.
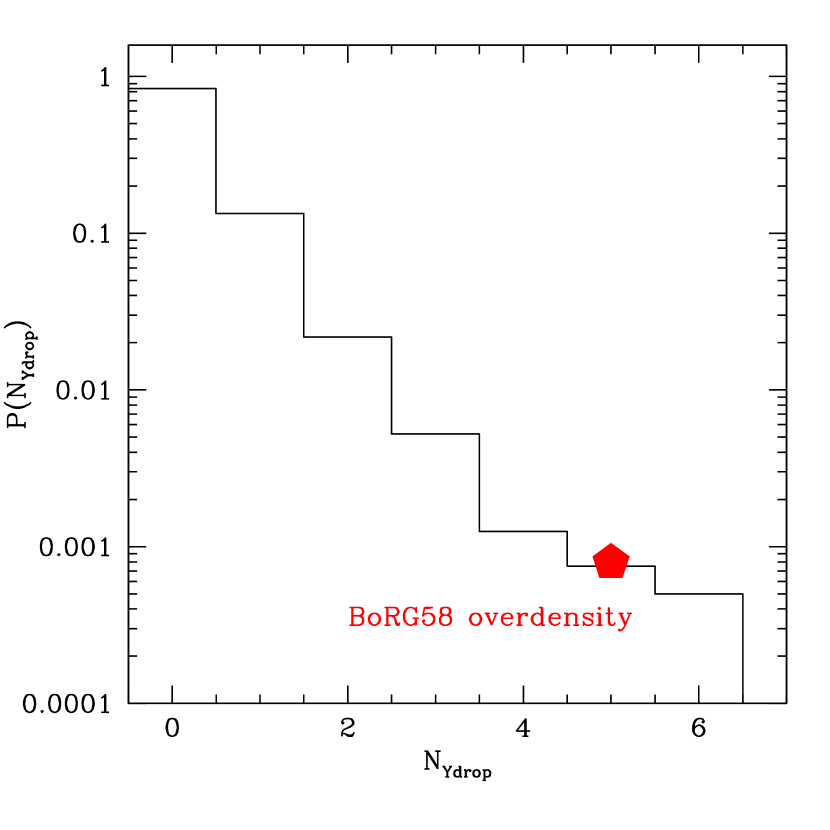
An approximate analytical form for the number counts distribution in presence of cosmic variance could be derived analytically under the same assumption that light traces dark matter (e.g., Adelberger et al. 1998; Robertson 2010), but that would not allow us to distinguish excess number counts originating from physical overdensities versus line-of-sight random superpositions. Therefore, we traced a pencil beam trough a cosmological simulation, following the method described in Trenti & Stiavelli (2008) to construct the full probability distribution of the expected number counts (see also Muñoz et al. 2010). We used the box of edge () simulated with DM particles as discussed in Trenti & Stiavelli (2008). Snapshots and halo catalogs were constructed every , allowing us to model the redshift evolution of the box over multiple snapshots as the -dropout pencil beam is traced ( centered at ). We set a minimum threshold of 92 particles for the dark-matter halos to be included in the pencil beam, as this gives an average number of counts in a WFC3-like pencil-beam that is equal to the observed value of (every dark-matter halo above the threshold is populated with a galaxy). We then considered a pencil beam equivalent in volume to the region that contains the BoRG58 overdensity, but shaped as a parallelepiped for computational reasons: (corresponding to , with at ). We ran 4000 random realizations of the pencil beam, obtaining and variance , in agreement with the analytical estimate discussed above. The full number count distribution of the -dropout counts is presented in Figure 6. Five realizations in have . Only one of these five fields with high number counts arises because of superposition of dropouts at different redshift along the pencil beam. The remaining realizations have all dropouts within a region of comoving size . This numerical experiment allows us to set a probability that the BoRG58 overdensity is a not a result of galaxy clustering along the line of sight. In addition, in the case of random superposition along the line of sight, all dark-matter halos have comparable masses near the low-mass cutoff to be included in the beam. In contrast, the fields that include 3D clusters have at least one halo with mass about four times higher than the minimum mass. Under the assumption that luminosity correlates with mass, the presence of a very luminous galaxy as in the case of field BoRG58 further strengthens the likelihood of a proto-cluster scenario.
Finally, we note that the overdensity of -dropout sources observed in BoRG58 is also more significant than any overdensity of sources found among the 10 WFC3 pointing in the GOODS/ERS fields by Bouwens et al. (2010a) who found two candidates in a region of diameter .
To summarize, all tests performed imply that the -dropout overdensity in BoRG58 is real and has high statistical significance. To investigate in more detail a possible scenario for the physical origin of the overdensity, we resort to numerical modeling of galaxy assembly during the epoch of reionization in the next Section.
5. Theoretical/numerical modeling of the overdensity
Under the assumption that the five -dropout of field BoRG58 are at , we can infer the dark-matter properties of the halos in which they reside by resorting to the Improved Conditional Luminosity Function model of Trenti et al. (2010). From their halo-mass versus galaxy-luminosity, we infer that the brightest member of the overdensity () lives in a halo. Such halo is a density peak with comoving space density , which has approximately a chance of being present within the volume probed by the BoRG survey (). This mild tension could be eased if there is some redshift evolution of the halo-mass versus galaxy-luminosity relation so that galaxies at higher become brighter at fixed halo mass as suggested by Muñoz & Loeb (2011); the Trenti et al. 2010 model is calibrated at while the Y-dropouts are at . If this is the case, we can derive instead the halo mass from number-density matching, obtaining a slightly lower value (). The fainter galaxies () are expected to be hosted in lower mass, and more common, halos with ( peaks).
Using extended Press-Schechter modeling (Muñoz & Loeb, 2008a), we expect on average halos with surrounding BoRG58_17871420 within a sphere of diameter (comoving) corresponding to . For reference, the average number of halos above this mass threshold for a random region of the universe of the same volume at is . A massive dark matter halo like the one expected for BoRG58_17871420 boosts by more than three orders of magnitude the number density of halos that can host galaxies sufficiently luminous to be detected. Similar results are given by a more powerful clustering model originally developed to describe the Shapley Supercluster (Muñoz & Loeb, 2008b). This analytical estimate shows that clustering of fainter dropouts around a very bright dropout is naturally expected. The prediction can be extended further to argue that if no clustering is observed at all, then it is likely that the very bright dropout is not at , but rather a foreground contaminant, because in this case the source is within a dark-matter halo with lower bias (see Section 4.3 and also Muñoz & Loeb 2008a). We note that, as discussed in Section 3, all the bright dropouts in the BoRG survey show evidence of clustering. The signal is not as strong as in the case of BoRG58, but is still significant at confidence.
Analytical predictions of clustering are limited to spherical volumes, whereas observations select galaxies within a pencil beam (Trenti & Stiavelli, 2008; Muñoz et al., 2010). For more accuracy, we use a set of cosmological simulations designed to study high- galaxy formation in overdense environments (Romano-Diaz et al., 2011). These runs follow only the evolution of dark matter and similar to the cosmic variance estimates constructed in this paper rely on the assumption that light traces matter555In passing, we note that the conclusion of Romano-Diaz et al. (2011) was that the predicted clustering of Lyman-break galaxies around the brightest QSOs was stronger than observed, under the assumption that all these QSOs live in dark matter halos with masses inferred from abundance matching (). Therefore it was proposed there that the tension with the observations could be eased if some of the QSOs are instead hosted in less massive halos. Recently, Volonteri & Stark (2011) showed that, because of the SDSS magnitude-limited selection, this is likely to be the case.. The simulations have a comoving volume and mass resolution . Halos with are thus well resolved with several hundred particles (Trenti et al., 2010a). The initial conditions were constrained to contain a halo at , imposing the input overdensity at the center of the box with the Hoffman & Ribak (1991) method. These simulations have a central dark-matter halo with at and are therefore appropriate for investigating the environment of BoRG58_17871420. Within a field of view with a line-of-sight extension of (), there are on average halos with . We find in the realization with the highest abundance of halos (Figure 7). For comparison, we expect halos in such volume for a random region of the universe at . Numerical simulations by Overzier et al. (2009) show that projected overdensities of dropouts might not be associated with actual 3-D overdensities, but the probability is negligible for the field of view considered here, as we demonstrated from our analysis of numerical simulations in Section 4.3 ().
These theoretical expectations indicate that, if the bright candidate in field BoRG58 lives in a massive dark-matter halo, then the overdensity of fainter -dropouts in its proximity is naturally explained as a proto-cluster structure. Although without spectroscopic confirmation we cannot demonstrate that the overdensity is composed of galaxies at a common redshift, all other hypotheses (either contamination from foreground galaxies or Galactic stars, or galaxies at different redshifts) are highly unlikely (Section 4.3). Of course, the current data cannot exclude that some of the faint dropouts are at different redshifts with respect to the bright dropout (including being foreground contaminants). Our numerical simulations indicate that deeper data would not only confirm the nature of the currently identified -dropouts, but more importantly they would discover additional, fainter candidates living in the proximity of the massive dark matter halo that hosts BoRG58_17871420.
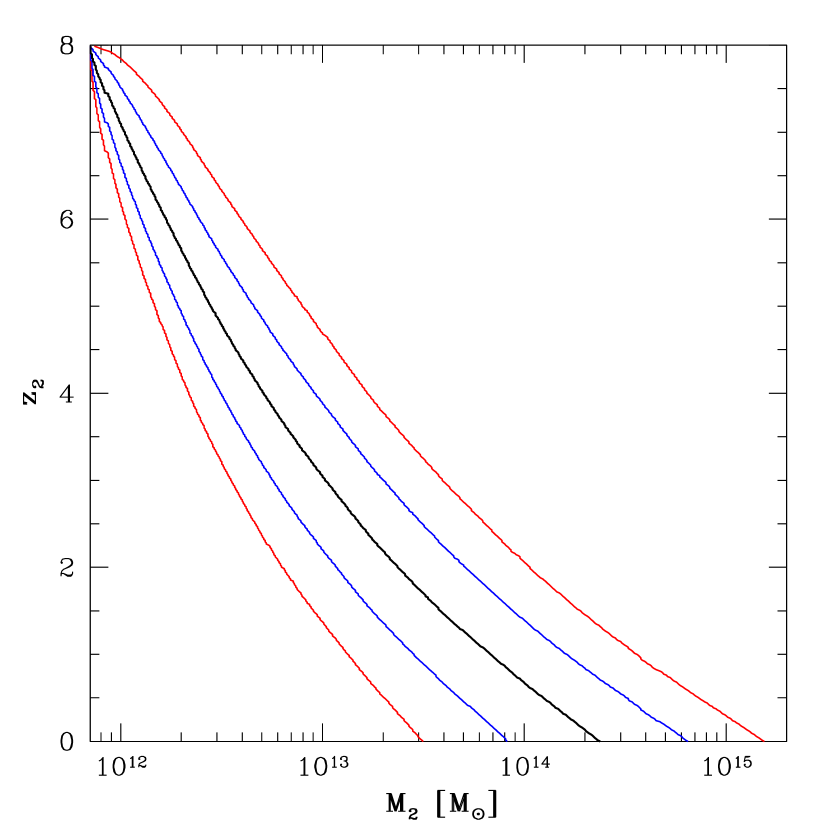
Assuming that the BoRG58 overdensity is composed of galaxies at the same redshift, our modeling gives us insight on the fate of the overdensity as it evolves with time. If the five galaxies are within a sphere of radius comoving Mpc, then the region is already non-linear, with an average overdensity by counting just the mass within the galaxy host halos. From our cosmological simulations, we derive that these galaxies are likely gravitationally bound and will collapse by into a single dark-matter halo (see Figure 7 in Romano-Diaz et al. 2011). This is confirmed by extended Press-Schechter modeling, which takes into account the effects of halo growth and clustering, allowing us to derive the probability that a dark-matter halo of mass at redshift will evolve into a halo with mass at redshift (Lacey & Cole, 1993). We used the extended Press-Schechter code developed in Trenti et al. (2008) to derive the expected mass distribution for the descendants of a BoRG58-like halo (mass ) at lower redshift, as shown in right panel of Figure 7. The figure predicts that the BoRG58 overdensity will evolve into one of the first massive galaxy clusters formed in the universe, with by .
6. Summary and Conclusions
Assuming a correlation between galaxy luminosity and dark-matter halo mass (Vale & Ostriker, 2004; Cooray, 2005; Trenti et al., 2010), a natural prediction of dark-matter clustering is that the brightest galaxies at should be surrounded by an overdensity of fainter galaxies at similar redshift (Muñoz & Loeb, 2008a). In this paper we tested this scenario using multi-band HST data from the BoRG survey (T11). Initial results from the survey identified four bright candidates as -dropout sources from a large area medium-deep survey in four bands (V, Y, J, H), covering arcmin2 to a median sensitivity of . As the four bright candidates in T11 are detected at high confidence (), in this paper we searched for fainter dropouts (detected at ) with the goal of testing whether the faint sources are found preferentially in the fields containing bright candidates. Our extended search (see Section 3 and Table 1) identified 17 additional dropouts within 23 independent fields. Eight of the new sources are located within the four fields that contain a bright -dropout identified by T11. Each of these fields contains at least one faint dropout. By means of Monte-Carlo simulations we established that there is a random chance that this occurs if no correlation between bright and faint dropouts is present. Therefore, the theoretical expectation that such correlation is present is verified from the BoRG survey data at confidence. This result holds independent of the contamination rate and completeness of the -dropout selection. Furthermore, contamination and incompleteness reduce the strength of such correlation (Section 3). Therefore, our result is robust against these effects. The presence of the correlation suggests that the samples of both bright and faint dropouts are not severely affected by contamination, as this would weaken the strength of the cross-correlation signal.
Interestingly, field BoRG58, in which T11 identified the best candidate of the BoRG survey based on the photometric data, shows the strongest overdensity of faint -dropouts: four additional sources are identified in this paper. The other three fields containing a bright candidate from T11 still show an excess of fainter sources compared to the typical BoRG survey number counts, but their overdensities are more modest (one or two faint dropouts per field). There can be several contributing factors that lead to the difference between BoRG58 and the other fields with a bright candidate. First, the bright dropout in field BoRG58 is the one with the highest signal-to-noise detection (). Therefore, this gives the broadest dynamic range among the fields with bright candidates to search for fainter companions with . Another possibility is that this is due to scatter in the halo-mass versus galaxy luminosity relation, typically modeled as a log-normal distribution (Cooray, 2005). In this case, the bright dropout in field BoRG58 might live in a halo with (above) average mass, while the other bright candidates might be over-luminous for their halo mass (and hence not clustered as strongly). This scenario could be favored because of the observational bias toward outliers present in a magnitude-limited sample, in analogy to what has been discussed in the context of the QSOs luminosities by Volonteri & Stark (2011). Finally, the other very bright -dropout of the sample, a galaxy in field BoRG1k, may be a contaminant, as discussed in Section 5.2 of T11. In this respect, it is interesting to note that the next best candidate identified by T11 is in field BoRG0t, which contains the second most significant overdensity of faint dropouts, with two additional sources detected in addition to the galaxy discussed in T11. This galaxy is almost one magnitude fainter than the one in BoRG58, so it is not surprising to find fewer members in the overdensity.
Given the special interest of field BoRG58, we carried out extensive analysis and data interpretation. In Section 4, we quantified by means of extensive testing that the overdensity of five dropouts in field BoRG58 is significant at confidence under Poisson statistics, with the range depending on a priori assumptions. As in the case of the global analysis for correlation among counts in the survey, this result is independent of contamination and completeness. We also quantified the impact of galaxy clustering in the determination of the statistical significance of the overdensity. Under the most conservative scenario of a complete survey with no contamination (this choice maximizes the bias of the -dropout population), we derive that the overdensity of dropouts in BoRG58 lies away from the average number count. To quantify the exact probability associated with this we constructed the number count distribution by tracing a pencil beam through a cosmological simulation as described in Trenti & Stiavelli (2008). We derive that five counts as in the BoRG58 overdensity are associated with a clustered structure at a common redshift with probability .
These results strengthen our confidence that the bright -dropout BoRG58_17871420 is indeed at and lives in a dark-matter halo of mass ( density peak), rather than being a lower redshift contaminant. If that galaxy were at , it would be a low-luminosity galaxy hosted in a common peak which would not be surrounded by an overdensity of similar sources (Muñoz & Loeb, 2008a). Further evidence for the nature of the source is given by Keck-NIRSPEC spectroscopy (Schenker et al., 2011). While no Ly emission line has been detected, to a median equivalent width of , this spectroscopic follow-up rules out that the galaxy is a foreground contaminant at with flux in the J and H bands primarily contributed by strong emission lines, which would have been detected in the spectrum at very high confidence ().
The faint -dropouts in BoRG58 are however at the detection limit of the current data and likely affected by significant contamination and incompleteness (Section 4.2). To confirm beyond reasonable doubt the existence of a physical 3D overdensity, and to explore in more detail its properties, new observations are needed. Deeper HST data, both in the optical and in the near-IR would improve the rejection of contaminants and likely discover new members of the overdensity, as expected from our theoretical/numerical model of the overdensity (Section 5). In this respect, we note that our catalog contains several sources in the field that are candidate -dropouts but are only detected in the J band at confidence. In addition, Spitzer/IRAC observations ( and ) would allow us to exclude to higher confidence dusty and passively evolving contaminants, and more importantly to derive the age and stellar mass for the brightest dropout, BoRG58_17871420. These observations could rule out that this ultra-bright candidate is a young () and not very massive starburst, a scenario which we did not consider in our theoretical modeling of the overdensity. In fact, typical sources have ages of (see Labbé et al. 2010).
Finally, it will be possible to further investigate the nature of the BoRG58 overdensity with the next generation of ground-based, multi-object spectrographs. The Keck observations of Schenker et al. (2011) are only moderately deep, with five hours of integration time split in two different filters to cover the expected wavelength range of Ly emission (as a reference, Lehnert et al. 2010 observed with the VLT SINFONI spectrograph a galaxy for about 15 hours in a single filter). Galaxies at are likely to have smaller Ly equivalent width compared to lower redshift objects. Theoretical predictions suggest that Ly emission should be present with (Dayal & Ferrara, 2011) and that some Ly flux should be transmitted even in case the IGM is neutral because of radiative transfer induced by galactic outflows (Dijkstra & Wyithe, 2010). This limit is within reach of a deeper spectroscopic follow-up from the ground and especially with a multi-object spectrograph such MOSFIRE at Keck, which could provide the definitive evidence that we are witnessing the assembly of one of the first galaxy clusters in the Universe.
References
- Adelberger et al. (1998) Adelberger K. L. et al. 1998, ApJ, 505, 18
- Atek et al. (2011) Atek, H., Siana, B., Scarlata, C., Malkan, M., McCarthy, P., Teplitz, H., Henry, A., Colbert, J., Bridge, C., Bunker, A. J., Dressler, A., Fosbury, R., Hathi, N. P., Martin, C., Ross, N. R., Shim, H. 2011, ApJ, accepted, arxiv:1109.0639
- Bertin & Arnouts (1996) Bertin, E. & Arnouts, S. 1996, A&AS, 117, 393
- Bouwens et al. (2007) Bouwens, R. J., Illingworth, G. D., Franx, M., Ford, H. 2007, ApJ, 670, 928
- Bouwens et al. (2011) Bouwens, R. J., Illingworth, G. D., Labbe, I., Oesch, P. A., Trenti, M., Carollo, C. M., van Dokkum, P. G., Franx, M., Stiavelli, M., González, V., Magee, D., & Bradley, L. 2011, Nature, 469, 504
- Bouwens et al. (2010a) Bouwens, R. J., Illingworth, G. D., Oesch, P. A., Labbe, I., Trenti, M., van Dokkum, P., Franx, M., Stiavelli, M., Carollo, C. M., Magee, D., & Gonzalez, V. 2011, ApJ, 737, 90
- Bouwens et al. (2010b) Bouwens, R. J., Illingworth, G. D., Oesch, P. A., Trenti, M., Stiavelli, M., Carollo, C. M., Franx, M., van Dokkum, P. G., Labbé, I., & Magee, D. 2010b, ApJ, 708, L69
- Bunker et al. (2010) Bunker, A. J., Wilkins, S., Ellis, R. S., Stark, D. P., Lorenzoni, S., Chiu, K., Lacy, M., Jarvis, M. J., Hickey, S. 2010, MNRAS, 409, 855
- Capak et al. (2011a) Capak, P. L. et al. 2011, Nature, 470, 233
- Capak et al. (2011b) Capak, P. L. et al. 2011, ApJ, 730, 68
- Cooke et al. (2008) Cooke, J., Barton, E. J., Bullock, J. S., Stewart, K. R., Wolfe, A. M. 2008, ApJ, 681, 57
- Cooray (2005) Cooray, A. 2005, MNRAS, 364, 303
- Dayal & Ferrara (2011) Dayal, P. & Ferrara, A. 2011, MNRAS, submitted, arxiv:1109.0297
- Dijkstra & Wyithe (2010) Dijkstra, M. and Wyithe, J. S. B. 2010, MNRAS, 408, 352
- Finkelstein et al. (2010) Finkelstein, S. L., Papovich, C., Giavalisco, M., Reddy, N. A., Ferguson, H. C., Koekemoer, A. M., & Dickinson, M. 2010, ApJ, 719, 1250
- Finlator et al. (2011) Finlator, K., Oppenheimer, B. D., & Davé, R. 2011, MNRAS, 410, 1703
- Hoffman & Ribak (1991) Hoffman, Y. & Ribak, E. 1991, ApJ, 380, L5
- Jaacks et al. (2011) Jaacks, J., Choi, J.-H., Nagamine, K., Thompson, R., Varghese, S. 2011, MNRAS, in press, arXiv1104.2345
- Knapp et al. (2004) Knapp, G. R. et al. 2004, AJ, 127, 3553
- Koekemoer et al. (2002) Koekemoer, A. M., Fruchter, A. S., Hook, R. N., & Hack, W. 2002, in The 2002 HST Calibration Workshop : Hubble after the Installation of the ACS and the NICMOS Cooling System, ed. S. Arribas, A. Koekemoer, & B. Whitmore, 337–+
- Komatsu et al. (2009) Komatsu, E., Dunkley, J., Nolta, M. R., Bennett, C. L., Gold, B., Hinshaw, G., Jarosik, N., Larson, D., Limon, M., Page, L., Spergel, D. N., Halpern, M., Hill, R. S., Kogut, A., Meyer, S. S., Tucker, G. S., Weiland, J. L., Wollack, E., & Wright, E. L. 2009, ApJS, 180, 330
- Lacey & Cole (1993) Lacey, C. and Cole, S. 262, 627
- Labbé et al. (2010) Labbé I. et al. 2010, ApJ, 716, 103
- Lee et al. (2006) Lee, K., Giavalisco, M., Gnedin, O. Y., Somerville, R. S., Ferguson, H. C., Dickinson, M., & Ouchi, M. 2006, ApJ, 642, 63
- Lee et al. (2009) Lee, K. et al. 2009, ApJ, 695, 368.
- Lehnert et al. (2010) Lehnert, M. D., Nesvadba, N. P. H., Cuby, J., Swinbank, A. M., Morris, S., Clément, B., Evans, C. J., Bremer, M. N., & Basa, S. 2010, Nature, 467, 940
- Loeb et al. (2005) Loeb, A., Barkana, R. & Hernquist, L. 2005, ApJ, 620, 554
- Malhotra et al. (2005) Malhotra, S. et al. 2005, ApJ, 626, 666
- McLure et al. (2010) McLure, R. J., Dunlop, J. S., Cirasuolo, M., Koekemoer, A. M., Sabbi, E., Stark, D. P., Targett, T. A., & Ellis, R. S. 2010, MNRAS, 403, 960
- McLure et al. (2011) McLure, R. J. et al. 2011, arXiv1102.4881
- Muñoz & Loeb (2008a) Muñoz, J. A. & Loeb, A. 2008, MNRAS, 385, 2175
- Muñoz & Loeb (2008b) Muñoz, J. A. & Loeb, A. 2008, MNRAS, 391, 1341
- Muñoz et al. (2010) Muñoz, J. A., Trac, H. & Loeb, A. 2010, MNRAS, 405, 2001
- Muñoz & Loeb (2011) Muñoz, J. A. & Loeb, A. 2011, ApJ, 729, 99
- Newman & Davis (2002) Newman, J. A. and Davis, M. 2002, ApJ, 564, 567
- Oesch et al. (2007) Oesch, P. A., Stiavelli, M., Carollo, C. M., Bergeron, L. E., Koekemoer, A. M., Lucas, R. A., Pavlovsky, C. M., Trenti, M., Lilly, S. J., Beckwith, S. V. W., Dahlen, T., Ferguson, H. C., Gardner, J. P., Lacey, C., Mobasher, B., Panagia, N., Rix, H.-W. 2007, ApJ, 671, 1212
- Oesch et al. (2009) Oesch, P. A., Carollo, C. M., Stiavelli, M., Trenti, M., Bergeron, L. E., Koekemoer, A. M., Lucas, R. A., Pavlovsky, C. M., Beckwith, S. V. W., Dahlen, T., Ferguson, H. C., Gardner, J. P., Lilly, S. J., Mobasher, B., Panagia, N. 2009, ApJ, 690, 1350
- Oesch et al. (2010) Oesch, P. A., Bouwens, R. J., Illingworth, G. D., Carollo, C. M., Franx, M., Labbé, I., Magee, D., Stiavelli, M., Trenti, M., & van Dokkum, P. G. 2010, ApJ, 709, L16
- Oesch et al. (2011) Oesch, P. et al. 2011, ApJ, in press, arXiv1105.2297
- Oke (1974) Oke, J. B. 1974, ApJS, 27, 21
- Ono et al. (2011) Ono, Y., Ouchi, M., Mobasher, B., Dickinson, M., Penner, K., Shimasaku, K., Weiner, B. J., Kartaltepe, J. S., Nakajima, K., Nayyeri, H., Stern, D., Kashikawa, N., Spinrad, H. 2011, ApJ submitted, arxiv:1107.3159
- Ouchi et al. (2005) Ouchi, M. et al. 2005, ApJ, 620, 1
- Overzier et al. (2006a) Overzier, R. A. et al. 2006, ApJ, 637, 58
- Overzier et al. (2006b) Overzier, R. A., Bouwens, R. J., Illingworth, G. D., & Franx, M. 2006, ApJ, 648, L5
- Overzier et al. (2009) Overzier, R. A. et al. 2009, MNRAS, 395, 577
- Peebles (1980) Peebles, P. J. E. 1980, The large scale structure of the Universe, Princeton University Press, 435 p.
- Pentericci et al. (2011) Pentericci, L., Fontana, A., Vanzella, E., Castellano, M., Grazian, A., Dijkstra, M., Boutsia, K., Cristiani, S., Dickinson, M., Giallongo, E., Giavalisco, M., Maiolino, R., Moorwood, A., Santini, P., 2011, ApJ submitted, arxiv:1107.1376
- Robertson (2010) Robertson, B. E. 2010, ApJ, 229, 234
- Romano-Diaz et al. (2011) Romano-Diaz, E., Shlosman, I., Trenti, M., & Hoffman, Y. 2011, ApJ, 736, 66
- Ryan et al. (2011) Ryan, Jr. R. E. et al. 2011, ApJ, 739, 83
- Salvaterra et al. (2011) Salvaterra, R., Ferrara, A., & Dayal, P. 2011, MNRAS, 414, 847
- Schenker et al. (2011) Schenker, M. A., Stark, D. P, Ellis, R. S., Robertson, B. E., Dunlop, J. S., McLure, R. J., Kneib, J. P., Richard, J. 2011, ApJ submitted, arxiv:1107.1261
- Schlegel et al. (1998) Schlegel, D. J, Finkbeiner, D. P., Davis, M. 1998, ApJ, 500, 525
- Shimasaku et al. (2003) Shimasaku, K. et al. 2003, ApJ, 586, 111
- Somerville et al. (2004) Somerville, R. S., Lee, K., Ferguson, H. C., Gardner, J. P., Moustakas, L. A., & Giavalisco, M. 2004, ApJ, 600, L171
- Stark et al. (2009) Stark, D. P. et al. 2009, ApJ, 697, 1493
- Stark et al. (2010) Stark, D. P. et al. 2010, MNRAS, 408, 1628
- Steidel et al. (1996) Steidel, C. C., Giavalisco, M., Pettini, M., Dickinson, M., & Adelberger, K. L. 1996, ApJ, 462, L17+
- Stiavelli & Trenti (2010) Stiavelli, M. & Trenti, M. 2010, ApJ, 716, L190
- Trenti et al. (2011) Trenti, M., Bradley, L. D., Stiavelli, M., Oesch, P., Treu, T., Bouwens, R. J., Shull, J. M., MacKenty, J. W., Carollo, C. M., & Illingworth, G. D. 2011, ApJ, 727, L39+
- Trenti et al. (2008) Trenti, M., Santos, M. R. & Stiavelli, M. 2008, ApJ, 687, 1
- Trenti et al. (2010a) Trenti, M., Smith, B. D., Hallman, E. J., Skillman, S. W., & Shull, J. M. 2010a, ApJ, 711, 1198
- Trenti & Stiavelli (2007) Trenti, M. & Stiavelli, M. 2007, ApJ, 667, 38
- Trenti & Stiavelli (2008) Trenti, M. & Stiavelli, M. 2008, ApJ, 676, 767
- Trenti et al. (2010) Trenti, M., Stiavelli, M., Bouwens, R. J., Oesch, P., Shull, J. M., Illingworth, G. D., Bradley, L. D., & Carollo, C. M. 2010b, ApJ, 714, L202
- Utsumi et al. (2010) Utsumi, Y. et al. 2010, ApJ, 721, 1680
- Vale & Ostriker (2004) Vale, A. & Ostriker, J. P. 2004, MNRAS, 353, 189
- Venemans et al. (2004) Venemans, B. P. et al. 2004, ApJ, 424, 17
- Volonteri & Stark (2011) Volonteri, M. and Stark, D. P. 2011, MNRAS, 487, 2085
- Wilkins et al. (2010) Wilkins, S. M., Bunker, A. J., Lorenzoni, S., & Caruana, J. 2010, MNRAS, 1867
- Yan et al. (2011) Yan, H., Yan, L., Zamojski, M. A., Windhorst, R. A., McCarthy, P. J., Fan, X., Röttgering, H. J. A., Koekemoer, A. M., Robertson, B. E., Davé, R., & Cai, Z. 2011, ApJ, 728, L22+
- Zheng et al. (2006) Zheng, W. et al. 2006, ApJ, 640, 574
| Field | R.A. | Decl. | ||
|---|---|---|---|---|
| BoRG70 | 26.4 | 5.2 | 157.7291 | +38.0474 |
| BoRG66 | 26.2 | 8.7 | 137.2732 | -0.0297 |
| BoRG66 | 26.5 | 7.0 | 137.2879 | -0.0338 |
| BoRG58 | 25.8 | 13.0 | 219.2107 | +50.7260 |
| BoRG58 | 27.2 | 5.1 | 219.2241 | +50.7260 |
| BoRG58 | 26.9 | 5.5 | 219.2311 | +50.7241 |
| BoRG58 | 27.2 | 5.4 | 219.2203 | +50.7156 |
| BoRG58 | 27.0 | 6.0 | 219.2224 | +50.7081 |
| BoRG2t | 26.6 | 6.8 | 95.9036 | -64.5480 |
| BoRG1v | 26.4 | 5.2 | 187.4776 | +7.8286 |
| BoRG1k | 25.5 | 11.4 | 247.8968 | +37.6039 |
| BoRG1k | 26.9 | 6.1 | 247.8981 | +37.6048 |
| BoRG0y | 27.0 | 6.5 | 177.9196 | +54.6847 |
| BoRG0y | 26.6 | 7.9 | 177.9726 | +54.6995 |
| BoRG0y | 27.2 | 6.3 | 177.9751 | +54.6979 |
| BoRG0j | 26.9 | 5.1 | 178.1887 | +0.9340 |
| BoRG0c | 26.7 | 6.6 | 118.9794 | +30.7178 |
| BoRG0g | 26.5 | 6.1 | 124.8104 | +49.1775 |
| BoRG0t | 26.7 | 8.6 | 117.7142 | +29.2715 |
| BoRG0t | 27.1 | 6.5 | 117.7064 | +29.2977 |
| BoRG0t | 27.0 | 5.9 | 117.6965 | +29.2851 |
Note. — First column: survey field ID. Second column: total magnitude in the J band, including aperture correction (automag). Third column: detection in the J band (isophotal measurement). Fourth and fifth columns: -dropout coordinates (Degrees, J2000 system).
| ID | Position | Photometry [isomag] | |||||
|---|---|---|---|---|---|---|---|
| J125 [automag] | R.A. | Decl. | |||||
| BoRG58_17871420 | 219.2107 | +50.7260 | |||||
| BoRG58_14061418 | 219.2241 | +50.7260 | |||||
| BoRG58_12071332 | 219.2311 | +50.7241 | |||||
| BoRG58_15140953 | 219.2203 | +50.7156 | |||||
| BoRG58_14550613 | 219.2224 | +50.7081 | |||||
Note. — First column: source ID. Second column: total magnitude (J125, including aperture correction (automag). Third/fourth columns: R.A./Decl. (Deg), J2000 system. Final columns: source photometry within detection pixels (isomag), with detection significance within brackets, or upper limits.