22email: jairo@iac.es 33institutetext: European Southern Observatory, Alonso de Córdova 3107, Vitacura, Santiago, Chile 44institutetext: Fundación Galileo Galilei-INAF, Rambla José Ana Fernández Pérez 7, 38712 Breña Baja, Spain 55institutetext: Dipartimento di Astronomia, Università di Padova, vicolo dell’Osservatorio 3, 35122 Padova, Italy 66institutetext: UNINOVA/CA3, Campus da FCT/UNL, Quinta da Torre, 2825-149 Caparica, Portugal 77institutetext: Harvard-Smithsonian Center for Astrophysics, 60 Garden Street, Cambridge, MA 02138, USA 88institutetext: Dipartimento di Fisica-Sezione Astronomia, Università degli Studi di Trieste, via Tiepolo 11, 34143 Trieste, Italy 99institutetext: INAF-Osservatorio Astronomico di Trieste, via Tiepolo 11, 34143 Trieste, Italy 1010institutetext: Instituto de Astrofísica de Andalucia-C.S.I.C., 18008 Granada, Spain 1111institutetext: Centro Astronómico Hispano Alemán, C/ Jesús Durbán Remón 2-2, 04004 Almería, Spain 1212institutetext: INAF-Osservatorio Astronomico di Capodimonte, Salita Moiariello 16, 80131 Napoli, Italy
Fossil groups origins II.
Unveiling the formation of the brightest group galaxies through their scaling relations
Abstract
Context. Fossil systems are galaxy associations dominated by a relatively isolated, bright elliptical galaxy, surrounded by a group of smaller galaxies lacking objects. Because of this extreme environment, fossil groups (FGs) are ideal laboratories to study the mass assembly of brightest group galaxies (BGGs).
Aims. We analyzed the near-infrared photometric and structural properties of a sample of 20 BGGs present in FGs in order to better understand their formation mechanisms. This represent the largest sample studied to date.
Methods. -band deep images were used to study the structural properties of our sample galaxies. Their surface-brightness distribution was fitted to a Sérsic profile using the GASP2D algorithm. Then, the standard scaling relations were derived for the first time for these galaxies and compared with those of normal ellipticals and brightest cluster galaxies in non-fossil systems.
Results. The BGGs presented in this study represent a subset of the most massive galaxies in the Universe. We found that their ellipticity profiles are continuously increasing with the galactocentric radius. Our fossil BCGs follow closely the fundamental plane described by normal ellipticals. However, they depart from both the vs. and vs. relations described by intermediate mass ellipticals. This occurs in the sense that our BGGs have larger effective radii and smaller velocity dispersions than those predicted by these relations. We also found that more elliptical galaxies systematically deviate from the previous relations while more rounder object do not. No similar correlation was found with the Sérsic index.
Conclusions. The derived scaling relations can be interpreted in terms of the formation scenario of the BGGs. Because our BGGs follow the fundamental plane tilt but they have larger effective radii than expected for intermediate mass ellipticals, we suggest that they only went through dissipational mergers in a early stage of their evolution and then assembled the bulk of their mass through subsequent dry mergers, contrary to previous claims that BGGs in FGs were formed mainly by the merging of gas-rich galaxies.
Key Words.:
galaxies: elliptical and lenticular, cD – galaxies: evolution – galaxies: formation – galaxies: fundamental parameters – galaxies: photometry – galaxies: structure1 Introduction
Fossil groups (FGs) are observationally defined as X-ray bright systems ( erg s-1), dominated in the optical by a giant elliptical galaxy at the center, and with an -band difference in the absolute magnitude of (Jones et al., 2003) between the two brightest galaxies located within half the virial radius of the system. These relatively rare systems were first identified by Ponman et al. (1994) and were the target of several studies in the last years (Vikhlinin et al., 1999; Jones et al., 2003; Mendes de Oliveira et al., 2006; Cypriano et al., 2006; Khosroshahi et al., 2006; Mendes de Oliveira et al., 2009; Zibetti et al., 2009; Démoclès et al., 2010; Aguerri et al., 2011).
Observationally, these systems are massive galaxy associations with typical masses of rich groups or poor clusters. They follow also the scaling relations of groups or clusters such as X-ray luminosity () vs. gas temperature (), total mass () vs. , gas entropy vs. , vs. cluster velocity dispersion (), optical luminosity () vs. , vs. , gas fraction () vs. (Khosroshahi et al., 2007; Sun et al., 2009). Some differences have been found in the optical vs. X-ray luminosity (-) relation (Khosroshahi et al., 2007) even if this is still controversial (Voevodkin et al., 2010). Detailed X-ray observations of some FGs also indicate that these systems were assembled at early epochs in high centrally concentrated dark matter (DM) halos with large mass-to-light ratios () (Démoclès et al., 2010). Nevertheless, they do not show cooling cores as those detected in galaxy clusters, which points toward the presence of other heating mechanisms, like active galactic nuclei (AGN) feedback (Sun et al., 2004; Khosroshahi et al., 2004, 2006; Mendes de Oliveira et al., 2009).
From numerical simulations, and due to the interesting nature of these systems, their formation scenarios have been matter of debate in the last years (D’Onghia et al., 2005; Sommer-Larsen, 2006; von Benda-Beckmann et al., 2008; Romeo et al., 2008; Díaz-Giménez et al., 2011; Cui et al., 2011). One scenario attributes their properties to their dynamical history, implying that fossil systems are formed if a group/cluster remains undisturbed for a long period of time. Therefore, if fossil systems were assembled in an early epoch of the Universe throughout a fast and efficient process of merging, they should had time enough for their galaxies to merge, thus producing the observed lack of intermediate-luminosity galaxies and the large magnitude gap between the brightest and the second brightest galaxy of the group (D’Onghia et al., 2005; von Benda-Beckmann et al., 2008). An alternative explanation for FG formation is that such systems are “failed” groups that suffer from a lack of galaxies as an accident of birth (Mulchaey & Zabludoff, 1999). On the other hand, some authors suggest that FGs might represent a transitory phase in the cluster life, with an absence of significant mergers for a long time, enough for cluster relaxation (von Benda-Beckmann et al., 2008; Cui et al., 2011).
The merger history underlying the origin of the central galaxies in FGs continue to be discussed in the literature. Their brightest group galaxies (BGGs) are among the most massive galaxies known in the Universe. Originally, they were thought to be possible results of group evolution as driven by dynamical friction (Ponman et al., 1994; Jones et al., 2003). Recent N-body simulations and semi-analytic calculations have suggested that BGGs formed in a short time-scale as consequence of mergers with low angular momentum (Sommer-Larsen, 2006), pushing dynamical friction to a less likely scenario for the evolution of BGGs.
Observations show that BGGs have also different observational properties than other bright elliptical galaxies. In particular, they present disky isophotes in the center and their luminosities correlate with the velocity dispersions of the groups. These different properties suggest a different formation scenario for bright ellipticals in fossil and non-fossil systems (Khosroshahi et al., 2006). Whereas bright ellipticals in FGs would grow out of gas-rich mergers, giant ellipticals in non-fossil systems would suffer more dry mergers. However, neither recent samples of BGGs (La Barbera et al., 2009) nor numerical simulations (Díaz-Giménez et al., 2008) show these differences (La Barbera et al., 2009). All previous results on fossil systems have the drawback that they were obtained using small samples of FGs. This could be the reason of some contradictory findings found by different studies. The lack of a large and homogeneous statistical study of this kind of systems makes the previous results not conclusive.
In the framework of the Fossil Groups Origins (FOGO) project (Aguerri et al., 2011), which aims to carry out a systematic, multiwavelength study of a sample of 34 FGs selected from the Sloan Digital Sky Survey (SDSS; Santos et al., 2007), near-infrared images in the -band were taken for the central regions of 17 groups using the Long-slit Intermediate Resolution Infrared Spectrograph (LIRIS) at the 4.2-m William Herschel Telescope (WHT). This represent the largest sample of BGGs studied to date at these wavelengths. Near-infrared observations have the advantage of mapping the distribution of the mass-carrying evolved stars and diminish the influence of dust. In this work, we analyze in detail the photometric properties of the BGGs present on these FGs to perform a systematic study of their structural properties and shed light on their formation/evolution scenarios.
The remainder of this paper is as follows: the data sample, observations, and data reduction are summarized in Sect. 2. In Sect. 3 we describe the surface photometry and photometric decomposition. The scaling relations are presented in Sect. 4. The discussion of the results and conclusions are presented in Sects. 5, and 6, respectively.
Throughout this paper we assume a flat cosmology with , , and a Hubble parameter H km s-1 Mpc-1.
2 Data sample, observations, and data reduction
2.1 LIRIS data
Near-infrared imaging of a sample of 17 FG systems belonging to the FOGO project was carried out at the WHT in January 2010. We observed in the -band using the LIRIS imaging mode. LIRIS is a near-infrared (0.9-2.4 m) instrument with an optical system based on a classical camera design (Manchado et al., 2004). The detector is a Hawaii 10241024 HgCdTe array operating at 70 K with a pixel scale of 025 pixel-1.
We exposed a total of 3000 s per field, developing several cycles of a 5 points dithering for each target. The exposure time of individual frames was 10-12 s. The dithering cycling procedure allowed us to estimate and then correct the background contributions of the sky and its significant oscillations. In addition, the dithering and flat frames helped us to clean cosmetic effects of the CCDs. After these corrections, we obtained maximum variations of about 0.4% in the background across the full image.
Data reduction was carried out under IRAF111IRAF is distributed by the National Optical Astronomy Observatories, which are operated by the Association of Universities for Research in Astronomy, Inc., under cooperative agreement with the National Science Foundation. environment and LIRIS specific packages. In order to keep the quality of the point spread function (PSF) across the whole field of view after stacking individual frames, the geometry effect of the distorted field was corrected. In the combined images the PSF is consistent with that of the single ones. This is true even close to the edges of the field.
Our observations were carried out under photometric conditions and within a seeing range of 06-11 (FWHM) as measured by fitting a Moffat PSF to field stars in our images. The photometric calibration was performed by observing United Kingdom Infra-Red Telescope (UKIRT) faint near-infrared standards (Casali & Hawarden, 1992). We have checked our photometric calibration taking the Two Micron All Sky Survey (2MASS) photometry as reference. Our zero-point estimations were in agreement with those of 2MASS within mag.
Finally we identified galaxies in our -band images and measured their magnitudes with the SExtractor package (Bertin & Arnouts, 1996). Objects were identified imposing that they cover a certain minimum area and have a number counts above a limiting threshold taking the local sky background as a reference. The limiting size and flux were 9 pixels and 1.5 standard deviation of the sky counts, respectively. The selected limiting size corresponds to an apparent size of 075, which is about the typical seeing FWHM obtained from our combined images. We performed careful visual inspections of the frames in order to deal with the best combination of the above parameters that removes spurious objects from the catalogues.

Figure 1 shows the -band counts for the fields observed with LIRIS. The counts follow the count-magnitude relation expected for a homogeneous galaxy distribution in a universe with Euclidean geometry. The completeness was computed as the magnitude where the measured counts are less than 10% with respect to the fit, whereas the limit magnitude was assumed to be that of the faintest detected objects. For our sample, the completeness and limit magnitudes correspond to targets with signal-to-noise ratio =5 and 3, and are and 20.3, respectively. The characteristics of the observed sample are listed in Table 1.
2.2 Additional data
2.2.1 UKIDSS data
Since we were not able to observe the whole sample of 34 FGs of the FOGO sample, we carried out a search in the UKIRT Infrared Deep Sky Survey (UKIDSS) eighth data release database to complete our sample. We found 7 galaxies out of 17 already observed with LIRIS. In addition, 5 new groups not previously observed with LIRIS were found.
Since the quality and depth of the UKIDSS data is clearly poorer than those of images obtained using LIRIS, we analyzed the images of the 7 common BGGs (see Table. 1) to understand whether the UKIDSS data could be useful to our scientific purpose. We perform a photometric decomposition of the surface-brightness distribution of the BGGs measured on the UKIDSS images as we did for the LIRIS data (see Sect. 3.1 for details). By comparing the total magnitudes obtained from both fits, we found that only for 4 BGGs (see Table. 1) the results are comparable within 0.2 mag. After analyzing the results of the fits we concluded that in order to obtain a reliable fit we need a suitable combination of surface-brightness dynamical range and Sérsic index, i.e., we found that galaxies with Sérsic index need at least a range of 6 mag arcsec-2 to be well fitted within the observational errors; instead, for we need only a range of 4 mag arcsec-2. Applying these criteria to the 5 images of the BGGs without counterpart in LIRIS we found that three groups (SDSSJ154855.85+085044.3, SDSSJ161431.10+264350.3, SDSSJ225630.04-003210.8) satisfy the conditions and only these were included in the analysis.
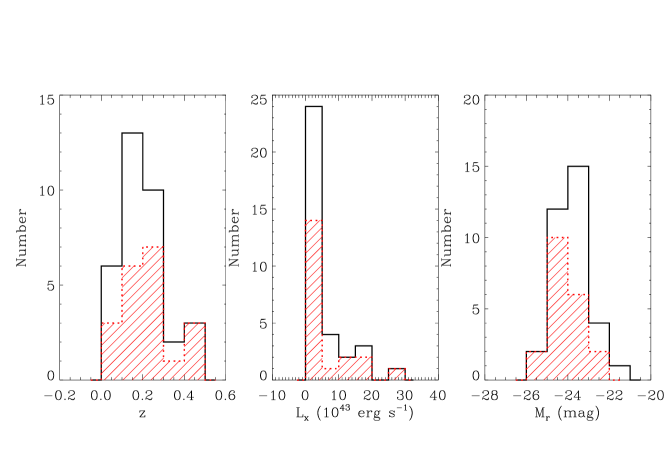
It is worth notice that we are not covering the complete sample of 34 FGs comprised by the FOGO project. This subsample of 20 groups is missing mainly the fainter end of the FOGO sample in both optical magnitude of the BGG and X-ray luminosity of the groups. However, this bias does not affect the results obtained in this article. In Fig. 2 we show the distribution of the complete FOGO sample and that studied in this paper as function of the redshift, X-ray luminosity, and band absolute magnitude.
2.2.2 SDSS data
Since all our BGGs were observed spectroscopically by the Sloan Digital Sky Survey (SDSS), we searched for the presence of velocity dispersion measurements in the SDSS database. We found the stellar velocity dispersions for the whole sample using the SDSS-III eighth data release (Aihara et al., 2011). However, since the SDSS spectroscopy was performed using fibers with of diameter, the measurement of the velocity dispersion could be contaminated by the presence of another objects inside this radius. For this reason, we checked visually the galaxies in order to take into account for this effect and we did not use the velocity dispersions of the BGGs in the SDSSJ084257.55+362159.2, and SDSSJ133559.98-033129.1 groups. Therefore, our final sample of velocity dispersion includes 18 galaxies. The velocity dispersions were corrected for the aperture size effect following the prescription by Jørgensen et al. (1995) and adopting a fixed physical aperture of /8. The measurements after aperture corrections are given in Table 1.
| Group | mr | Source | FWHM | |||
|---|---|---|---|---|---|---|
| (1043 erg/s) | (mag) | (km/s) | (arcsec) | |||
| (1) | (2) | (3) | (4) | (5) | (6) | (7) |
| SDSSJ015021.27-100530.5 | 14.40 | 0.365 | 17.26 | 34144 | L | 0.7 |
| SDSSJ015241.95+010025.5 | 15.10 | 0.230 | 15.72 | 31716 | L,U | 1.1 |
| SDSSJ075244.19+455657.3 | 0.562 | 0.052 | 14.46 | 2215 | L | 0.8 |
| SDSSJ080730.75+340041.6 | 4.210 | 0.208 | 16.38 | 26321 | L | 0.7 |
| SDSSJ084257.55+362159.2 | 29.50 | 0.282 | 16.79 | … | L | 0.8 |
| SDSSJ084449.07+425642.1 | 0.211 | 0.054 | 14.08 | 1574 | L | 0.7 |
| SDSSJ090303.18+273929.3 | 17.40 | 0.489 | 18.06 | 27354 | L,U∗ | 0.7 |
| SDSSJ094829.04+495506.7 | 6.260 | 0.409 | 18.21 | 27030 | L | 0.6 |
| SDSSJ104302.57+005418.2 | 4.990 | 0.125 | 15.98 | 2358 | L,U∗ | 0.9 |
| SDSSJ105452.03+552112.5 | 11.70 | 0.468 | 17.69 | 36561 | L | 0.7 |
| SDSSJ111439.76+403735.1 | 4.190 | 0.202 | 17.14 | 21811 | L | 0.6 |
| SDSSJ112155.27+104923.2 | 3.850 | 0.240 | 16.97 | 25121 | L,U∗ | 0.7 |
| SDSSJ114128.29+055829.5 | 2.190 | 0.188 | 16.03 | 30928 | L,U | 0.8 |
| SDSSJ114647.57+095228.1 | 4.930 | 0.221 | 16.36 | 27618 | L,U∗ | 0.6 |
| SDSSJ124742.07+413137.6 | 0.625 | 0.155 | 15.88 | 24013 | L | 0.6 |
| SDSSJ133559.98-033129.1 | 3.680 | 0.177 | 15.84 | … | L | 0.9 |
| SDSSJ154855.85+085044.3 | 0.509 | 0.072 | 13.50 | 3269 | U | 0.7 |
| SDSSJ161431.10+264350.3 | 2.370 | 0.184 | 15.76 | 27615 | U | 0.7 |
| SDSSJ225630.04-003210.8 | 2.180 | 0.224 | 16.81 | 27420 | U | 0.7 |
| SDSSJ235815.10+150543.5 | 0.926 | 0.178 | 16.08 | 29714 | L,U | 0.8 |
3 Surface photometry
3.1 Photometric decomposition
The two-dimensional photometric decomposition of the sample galaxies was performed using the GASP2D algorithm described in Méndez-Abreu et al. (2008). This algorithm has been successfully applied to several galaxy samples (Morelli et al., 2008; Pizzella et al., 2008; Beifiori et al., 2011; Dalla Bontà et al., 2011). In particular, it has been applied to a large sample of brightest cluster galaxies (BCGs) in non-fossil systems (Ascaso et al., 2011)
The GASP2D algorithm is based on a minimization. Therefore, the choice of the initial trials for free parameters is crucial to obtain a good fit. To this aim, the ellipse-averaged radial profiles of surface brightness, ellipticity, and position angle were analyzed by following the prescriptions by Méndez-Abreu et al. (2008). Starting from these initial trial parameters the different photometric models of the surface brightness were fitted iteratively by GASP2D to the pixels of the galaxy image to derive its photometric structural parameters. Each image pixel was weighted according to the variance of its total observed photon counts due to the contribution of both galaxy and sky, and determined assuming photon noise limitation and taking the detector read-out noise into account. Seeing effects were also taken into account by convolving the model image with a circular Moffat PSF with a FWHM matching the observed one (see Table 1). The convolution was performed as a product in Fourier domain before the least-squares minimization.
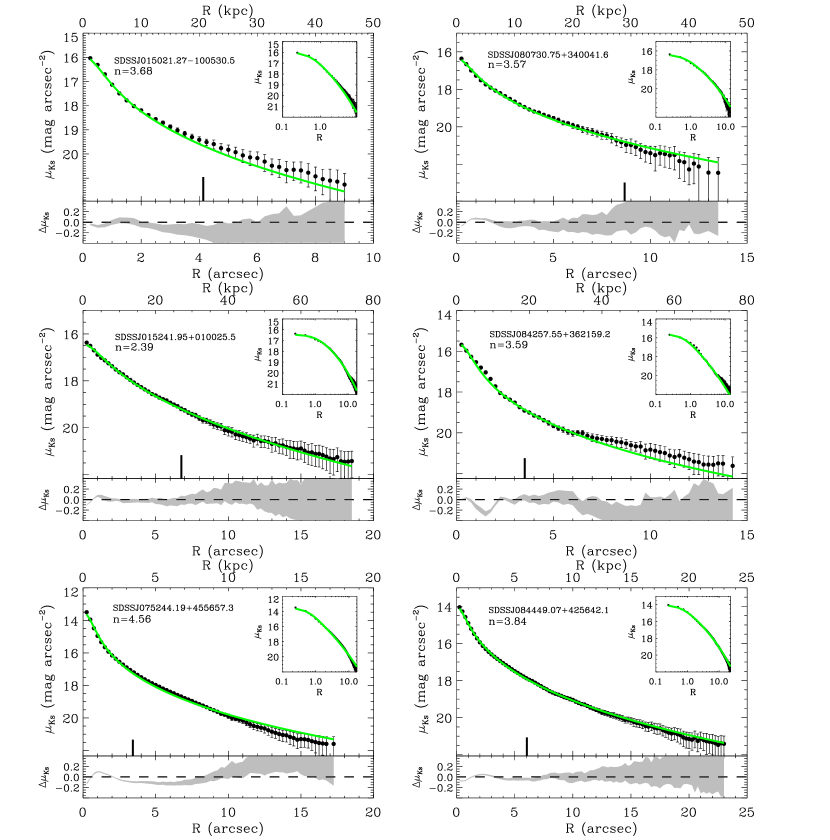
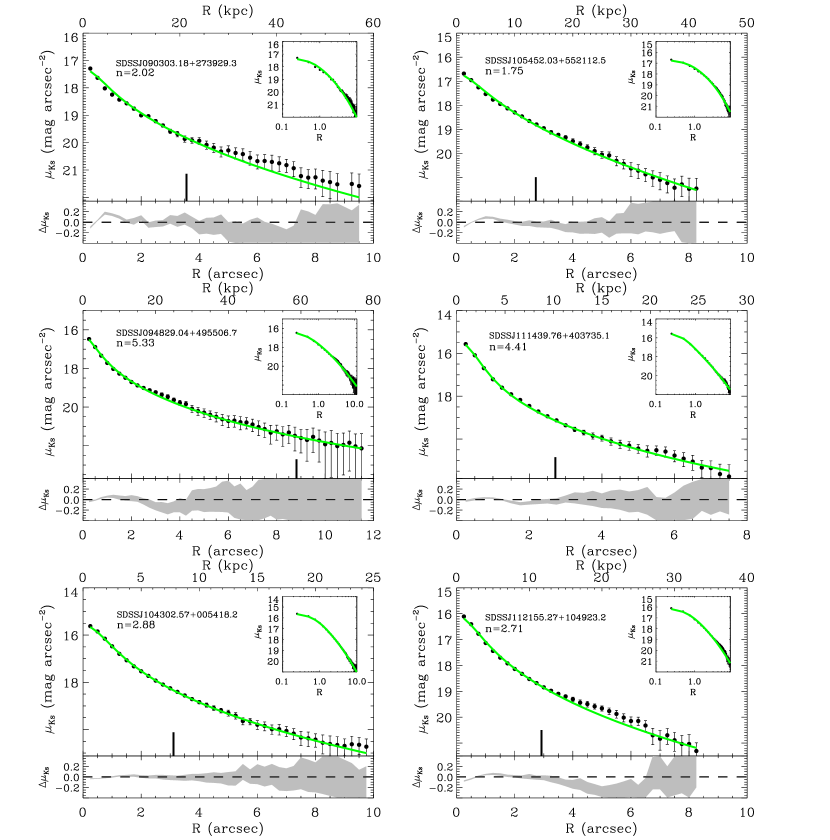
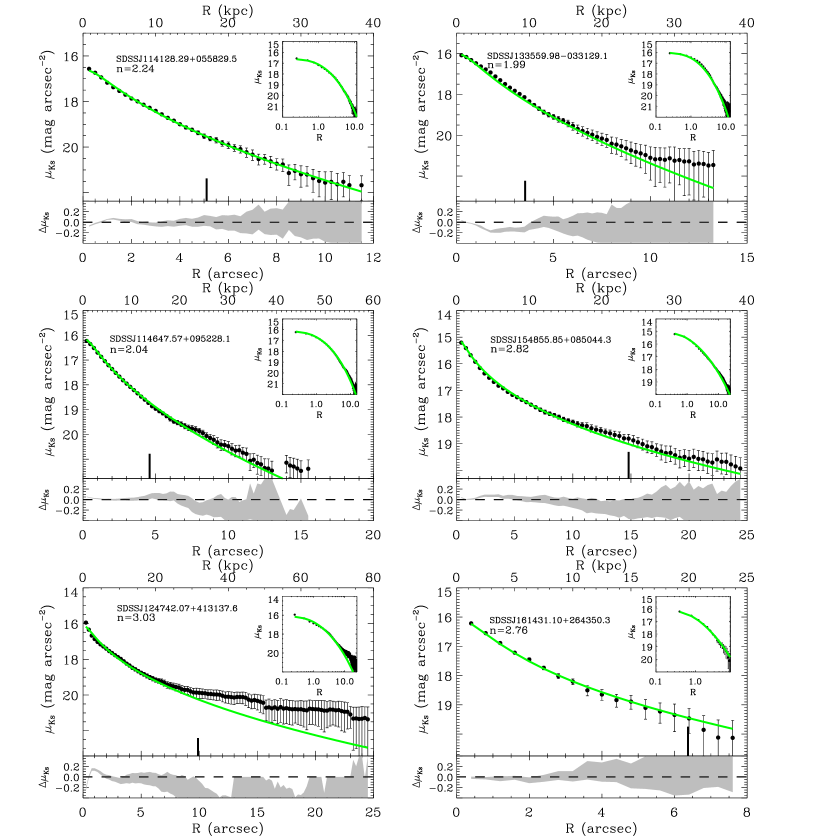
We tested three different parametric models to fit the galaxy surface-brightness distribution. The de Vaucouleurs profile (de Vaucouleurs, 1948) was extensively used to describe the light distribution of elliptical galaxies and to look for central dominant galaxies (cDs) in clusters by searching light excess over the model de Vaucouleurs profile in the outer parts of the profile (Matthews et al., 1964; Schombert, 1987). The Sérsic profile (Sérsic, 1968) is nowadays believed to be the most suitable model to describe the surface-brightness distribution of elliptical galaxies in a wide range of luminosities and masses (e.g., Caon et al., 1993; Graham & Guzmán, 2003; Aguerri et al., 2004; Kormendy et al., 2009). It is parametrized by , Ie, and which are respectively the effective radius, surface brightness at re and a shape parameter describing the curvature of the radial profile. When we recover the de Vaucouleurs profile and for we obtain the exponential one. Figure 3 shows the best fit of the observed surface-brightness radial profile to a Sérsic model obtained for our sample galaxies. In addition to the previous models, we also fitted a two-component (Sérsic+exponential) model to the data. This allowed us to fit the low surface-brightness and extended component that BCGs could present (Nelson et al., 2002; Gonzalez et al., 2003, 2005; Seigar et al., 2007; Liu et al., 2008; Ascaso et al., 2011). We found that 7 galaxies are described by this two-component model, however, since all galaxies can be successfully modelled by a Sérsic profile and in order to work with a self-comparable set of structural parameters, we decided to use only the Sérsic structural parameters in this paper. In addition, we found that a high fraction (14 out of 20) of our sample galaxies are compatible within the errors bars with following a de Vaucouleurs profile. Following the criteria given by Schombert (1987) to identify cDs based on looking for an upward break in the surface-brightness profile with respect to the typical de Vaucouleurs profile, we identified SDSSJ124742.07+413137.6 as the only one candidate to be a cD galaxy. However, this classification should be interpreted as tentative, since the surface-brightness limits reached in our photometry are not directly comparable with those of Schombert (1987).

The parameters derived for the structural components of the sample galaxies using a Sérsic fit are collected in Table 2. The values of this table were corrected for galaxy inclination, cosmological dimming, K-correction, and evolutionary effects. K-correction and evolutionary effect were taken into account using the recipes by Poggianti (1997). All the quantities plotted in the figures of this paper show such corrected values, unless otherwise stated.
| Group | PA | ||||||
|---|---|---|---|---|---|---|---|
| (mag/arcsec2) | (arcsec) | (kpc) | (∘) | ||||
| (1) | (2) | (3) | (4) | (5) | (6) | (7) | (8) |
| SDSSJ015021.27-100530.5 | 19.160.24 | 4.140.73 | 21.03.7 | 3.680.40 | 0.720.02 | 144.44.4 | 14.080.28 |
| SDSSJ015241.95+010025.5 | 19.500.12 | 6.770.51 | 24.91.9 | 2.390.12 | 0.520.01 | 18.50.2 | 13.120.10 |
| SDSSJ075244.19+455657.3 | 17.270.07 | 3.430.14 | 3.5 0.1 | 4.560.10 | 0.950.01 | 125.41.4 | 11.360.09 |
| SDSSJ080730.75+340041.6 | 20.230.39 | 8.672.75 | 29.59.3 | 3.570.48 | 0.800.02 | 73.41.5 | 13.030.32 |
| SDSSJ084257.55+362159.2 | 18.390.42 | 3.511.09 | 15.04.6 | 3.590.73 | 0.820.02 | 89.71.2 | 13.410.33 |
| SDSSJ084449.07+425642.1 | 18.190.15 | 6.050.54 | 6.4 0.6 | 3.840.21 | 0.700.01 | 20.90.1 | 11.150.08 |
| SDSSJ090303.18+273929.3 | 19.140.38 | 3.561.29 | 21.57.8 | 2.020.43 | 0.730.05 | 119.95.3 | 15.080.47 |
| SDSSJ094829.04+495506.7 | 21.000.42 | 8.813.09 | 48.016.8 | 5.330.39 | 0.450.01 | 53.01.1 | 14.220.34 |
| SDSSJ104302.57+005418.2 | 18.360.34 | 3.110.74 | 7.0 1.7 | 2.880.48 | 0.760.02 | 151.03.0 | 13.190.25 |
| SDSSJ105452.03+552112.5 | 18.200.25 | 2.720.62 | 16.03.7 | 1.750.22 | 0.780.02 | 101.33.3 | 14.720.35 |
| SDSSJ111439.76+403735.1 | 18.890.21 | 2.720.41 | 9.0 1.4 | 4.410.39 | 0.930.03 | 82.32.5 | 14.080.27 |
| SDSSJ112155.27+104923.2 | 18.610.34 | 2.920.79 | 11.13.0 | 2.710.41 | 0.800.03 | 100.93.0 | 14.030.34 |
| SDSSJ114128.29+055829.5 | 19.200.37 | 5.101.44 | 16.04.5 | 2.240.44 | 0.760.02 | 100.72.1 | 13.320.31 |
| SDSSJ114647.57+095228.1 | 18.950.15 | 4.580.49 | 16.31.7 | 2.040.17 | 0.540.01 | 55.01.1 | 13.470.19 |
| SDSSJ124742.07+413137.6 | 19.970.46 | 9.893.81 | 26.610.2 | 3.030.63 | 0.580.02 | 149.53.2 | 12.370.36 |
| SDSSJ133559.98-033129.1 | 18.160.25 | 3.530.55 | 10.61.6 | 1.990.30 | 0.800.02 | 131.12.6 | 13.100.21 |
| SDSSJ154855.85+085044.3 | 18.390.03 | 14.800.30 | 20.30.4 | 2.820.03 | 0.630.01 | 59.80.3 | 10.650.06 |
| SDSSJ161431.10+264350.3 | 18.390.08 | 6.370.45 | 19.71.4 | 2.760.14 | 0.780.02 | 20.50.4 | 12.930.18 |
| SDSSJ225630.04-003210.8 | 19.290.08 | 7.750.54 | 27.92.0 | 3.870.19 | 0.680.01 | 128.52.6 | 13.370.18 |
| SDSSJ235815.10+150543.5 | 18.910.33 | 4.911.18 | 14.83.6 | 2.210.39 | 0.690.01 | 97.21.9 | 13.080.27 |
3.2 Internal errors in the structural parameters
The errors given in Table 2 for every structural parameter were obtained through a series of Monte Carlo simulations. Due to the fact that formal errors obtained from the minimization method are usually not representative of the real errors (Méndez-Abreu et al., 2008), we carried out extensive simulations on artificial galaxies in order to give a reliable estimation of these errors. Monte Carlo simulations have also the advantage of getting rid of systematic biases in our measurements, as for example those introduced by the effects of seeing in our images (see Trujillo et al., 2001).
A set of 2000 images of galaxies modeled with a Sérsic profile was generated. The structural parameters of the artificial galaxies were randomly chosen among the following ranges:
| (1) |
In order to mimic the same instrumental setup, we added a background level and photon noise to these artificial images similar to the observed images. They were also convolved simulating the seeing that we have in our observations. Finally, these simulated galaxies were fitted with the same conditions as the real ones. Then, simulated galaxies were used to determine the errors of the fitted structural parameters. To assign to every single galaxy the corresponding error for every structural parameter, we divided our catalogue of artificial galaxies in bins of 0.5 mag, we assumed that the errors were normally distributed, with mean and standard deviation corresponding to the systematic and typical error, respectively. Then, we placed our observed galaxy in its magnitude bin and assigned to every parameter the corresponding error.
3.3 Radial profiles
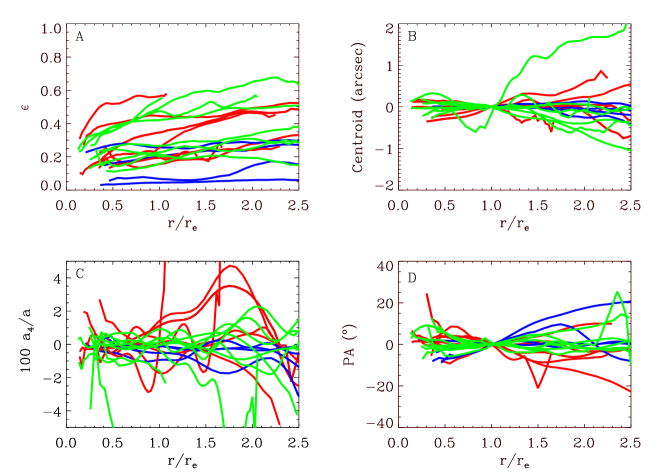
The surface photometry was measured by fitting ellipses to the isophotes of the galaxies using the IRAF task ELLIPSE. This routine fits a large number of free parameters to every isophote using the iterative method described by Jedrzejewski (1987). Bad pixels, foreground stars, and other spurious sources were masked before performing the fit. Figure 4 shows the ellipticity (), centroid position (), fourth order cosine Fourier moment (), and position angle (PA) radial profiles of the isophotes. It is worth noticing that the surface-brightness profiles of 16 galaxies extend at least to at a level of mag arcsec-2 corresponding to of the sky counts, and 9 reach at least , denoting thus the depth of our images.
No galaxies with ellipticities larger than 0.7 were found, in agreement with typical ellipticals (Fig. 4A). We found that in almost all cases the ellipticity profile increases with radius up to large distances. We checked that this effect was neither caused by a bad sky subtraction nor by light contamination from a close object. This behaviour cannot be explained by assuming that these galaxies are oblate (or prolate) spheroids and therefore suggests the presence of another component or a structural distortion in the outer parts (Porter et al., 1991; Méndez-Abreu et al., 2010). There is no correlation with the Sérsic shape parameter, whereas we found a weak dependence of the ellipticity with the galaxy magnitude. Less luminous galaxies are rounder.
The variations of the galaxy centroid do not show any correlation with the magnitude (Fig. 4B). Nevertheless, these variations seem to be larger for radius greater than at least for some galaxies, possibly indicating the presence of distortions in the outer parts of these galaxies.
The fourth order cosine Fourier coefficient is related with the isophotes shape. Negative values indicate boxy isophotes. On the contrary, positive values are related with disky isophotes. For our sample galaxies these profiles are too noisy and this prevented us to assign a single value, or even define a trend (Fig. 4C). Therefore, no obvious correlation was found between this coefficient and either the Sérsic shape parameter or galaxy magnitude.
The position angle profiles are shown in Fig. 4D. We did not find any correlation between these profiles and other galaxy parameters. In addition, the profiles are very flat with variations .
4 Scaling relations
We studied the structural scaling relations for our sample of BGGs in FGs by analyzing the results from the photometric decomposition presented in Sect. 3.1. We also considered the sample of early-type galaxies by Pahre et al. (1998, hereafter P98), described in detail in Pahre (1999), as a control sample. This represents a statistically significant sample of galaxies in clusters and groups observed homogeneously in the band. We selected the P98 BCGs to compare the same type of objects. The P98 BCGs showed in the figures are the followings: NGC 4874 and NGC 4889 (Coma), NGC 545 and NGC 547 (Abell 194), NGC 6166 (Abell 2199), NGC 7720 (Abell 2634), NGC 4696 (Centaurus), NGC 1316 (Fornax), NGC 3309 and NGC 3311 (Hydra), NGC 1272 and NGC 1275 (Perseus), NGC 4486 (Virgo), and NGC 1407 (Eridanus).
4.1 Consistency with P98 data
The P98 data represents a large sample of early-type galaxies observed in the near-infrared with a photometric depth similar to that of our images. Therefore, it is ideal to compare with our sample of BGGs in fossil systems. However, their structural parameters (, , and ) were derived from circular aperture photometry which differs from our approach of performing two-dimensional photometric decompositions.
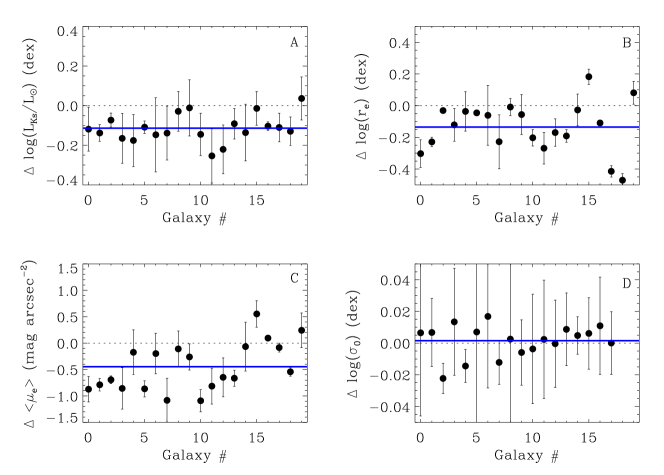
In order to check for possible biases between the two datasets that could contaminate our results, we calculate the structural parameters for our sample data using also circular aperture photometry onto our images. The actual computation was done using the IRAF package ELLIPSE, as done by P98. Figure 5 shows the results from this comparison. A clear bias appears in all the photometric parameters under study. The luminosity (), effective radius (), and mean effective surface-brightness () derived by the photometric decomposition are 0.11 dex, 0.13 dex , and 0.44 mag arcsec-2 larger than those derived by aperture photometry, respectively. These differences are not unexpected and have been pointed out in other studies. For instance, Aguerri et al. (2005) and Trujillo & Aguerri (2004) found that the differences in magnitudes between the two methods is never larger that 0.5 mag, in agreement with our result. The main reason for these differences is that models used in the photometric decomposition approach are extrapolated to the infinite, therefore given larger magnitudes, effective radius and effective surface-brightness.
Figure 5 also shows the comparison between the central velocity dispersion of the galaxies using P98 and this work. As explained in Sect. 2.2.2, we corrected our velocity dispersions using a physical aperture of /8 whereas P98 used a physical scale of 1.53 kpc. These different aperture corrections do not introduce a bias between the two samples and it only could increase the scatter in the relations.
These biases must be kept in mind in the following but they are not enough to change the results presented in this work. In fact, most of the differences are within the error bars of the measurements. To avoid confusions, we have corrected for these biases in all the figures where we compare our measurements with P98 data.
4.2 Structural parameters vs. luminosity
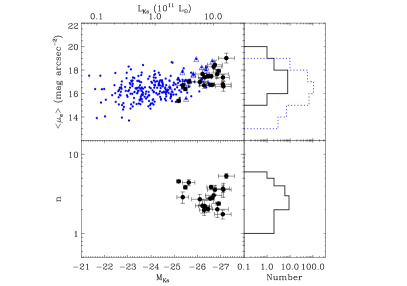
Figure 6 shows the relation between the absolute rest-frame magnitude in -band (or equivalently also the -band luminosity in solar units) obtained from the Sérsic fit to the surface-brightness distribution of the sample galaxies and the mean effective surface brightness, or Sérsic shape parameter.
Notice that some of our sample galaxies are among the brightest galaxies located in cluster/group environments in the Universe. They are brighter than the BCGs present in nearby clusters such as Virgo or Coma, which are represented by triangle symbols. However, they are neither the most concentrated, nor posses the highest central surface brightness. In fact, the mean effective surface brightness correlates well with the galaxy magnitude and follows the same trend of normal ellipticals and BCGs.
The P98 sample does not provide information about the shape of the surface-brightness profile, which in our case is represented by the Sérsic index, and therefore we can not make a direct comparison. However, it is worth noticing the wide range of Sérsic index values obtained for our BGGs, ranging from 1.7 to 5.3 with a mean value of 3.0. This indicates that the shape of the surface-brightness profile can be very different from a typical de Vaucouleurs profile.
4.3 Fundamental plane
It is well known that the structural parameters of classical bulges and elliptical galaxies follow a tight relation called the Fundamental Plane (FP; Djorgovski & Davis, 1987; Dressler et al., 1987) among the effective radius (), mean effective surface brightness () and central stellar velocity dispersion (). The small intrinsic dispersion of the FP relation is a consequence of the virial theorem and demonstrate that these systems are in dynamical equilibrium. Possible deviations from the FP are related to a variation of the mass-luminosity ratio with the luminosity and/or a non-homology in the structure of these galaxies throughout the whole range of luminosities (Trujillo et al., 2004). The FP has been widely used as a powerful tool in measuring galactic distances and also in studies of galaxy formation and evolution (Kjaergaard et al., 1993; Jørgensen et al., 1996, 1999; Kelson et al., 1997).
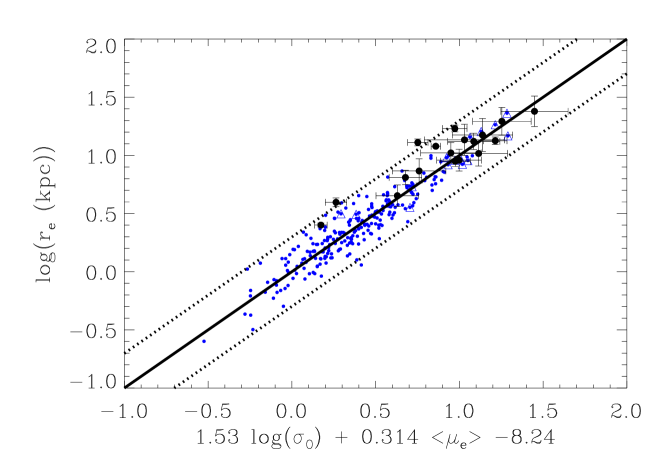
Figure 7 shows the distribution of our sample galaxies in the FP relation defined by the sample of P98. Our BGGs follow a FP compatible within the errors with that of normal ellipticals and BCGs, therefore implying that in the innermost regions () they are relaxed systems similar to normal ellipticals.
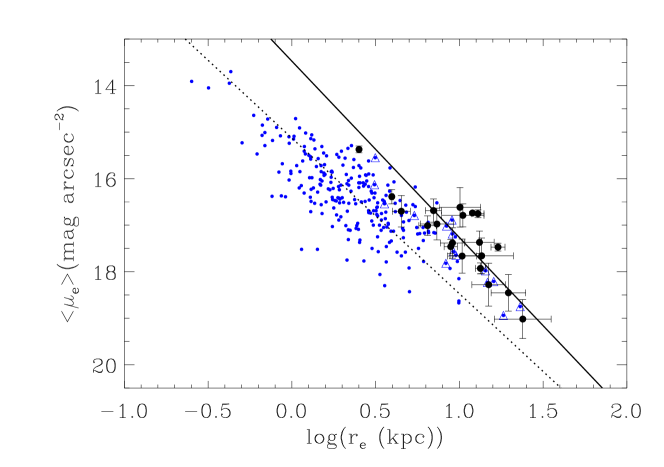
4.4 Kormendy relation
The effective radius and mean surface brightness of elliptical galaxies are correlated through the so-called Kormendy relation (KR; Kormendy, 1977) which represents a projection of the FP.
Figure 8 shows the position of our BGGs in the KR with respect to the control sample of P98. The fit to the data points was done using the FITEXY routine (Press et al., 1992) implemented in IDL444Interactive Data Language is distributed by ITT Visual Information Solutions., which estimates the parameters of a straight-line fit taking into account for data errors on both variables. The best fitted KR to the P98 sample is given by
| (2) |
Our galaxies are systematically above the best-fit relation obtained for the P98 sample, even if both relations are similar once the errors are taken into account. The relation obtained by fitting only our galaxies is
| (3) |
Several works studied the KR in galaxy clusters demonstrating that the intrinsic dispersion is approximately 0.4 mag arcsec-2 in (Hoessel et al., 1987; Sandage & Perelmuter, 1991; La Barbera et al., 2003). This high intrinsic dispersion can be interpreted in different ways: by the fact that the KR does not consider the third parameter of FP (i.e., velocity dispersion, Ziegler et al. 1999); because of the measurement errors as well as the systematic errors due to the photometric calibration and also due to the corrections introduced for different biases (e.g., zero point and color transformation, K-correction and reddening); or because the position of the galaxies in the KR depends on their magnitude (Nigoche-Netro et al., 2008).
In the case of our BGGs, we suggest that since our galaxies represent the brightest galaxies located in cluster/groups, the different position of the BGGs in the KR is produced only by their higher luminosity. In fact, galaxies with increasing magnitudes are placed parallel to the KR but with higher values of the mean surface brightness for a given effective radius, as it is the case of our sample galaxies. In addition, the coefficients of our fit are poorly constrained due to our small number statistics, and both samples are consistent within the errors.
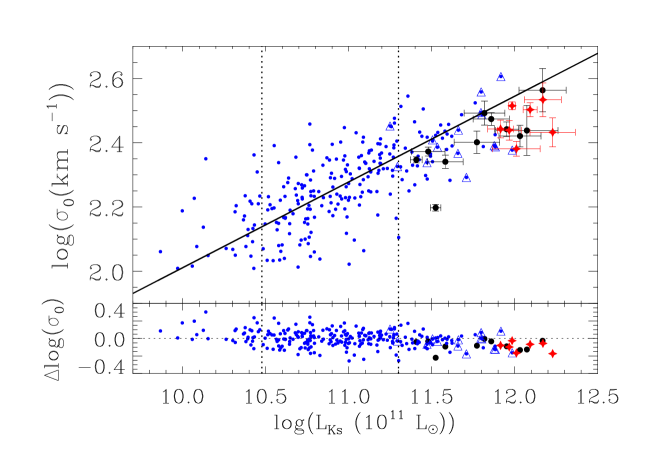
4.5 Faber-Jackson relation
The Faber-Jackson relation (FJ; Faber & Jackson, 1976) represents another physically significant projection of the FP. It correlates the galaxy magnitude with the stellar velocity dispersion and for this reason it is observationally more expensive to obtain than the KR since it requires for spectroscopic data. For the sake of clarity, in Fig. 9 we plot the total luminosity in the -band instead of the magnitude. The -band luminosities of a given stellar population are less affected by metallicity effects than those in optical passbands. In addition, they are a good proxy of the total stellar mass since the typical for an old stellar population (e.g., Bruzual & Charlot, 2003).
Figure 9 represents the FJ relation for the P98 sample and our sample of BGGs. Recently, Bernardi et al. (2011a, b) have demonstrated that the scaling relations of early-type galaxies present a change in their slope at a characteristic stellar mass ( M☉, see also Tortora et al. 2009). Interestingly, this curvature of the scaling relations is not present when the stellar mass of the galaxies is replaced by the central velocity dispersion. In particular, they find that galaxies with masses higher than 2 1011 M☉ have smaller velocity dispersions and larger effective radius for a given mass than their counterparts in the mass range 31010M 21011.
Our sample galaxies represent a subset of the most massive galaxies of the Universe. Some of them probably fall in the Bernardi’s sample (Bernardi et al., 2011a, b) since they have SDSS information. Unfortunately, we cannot compare directly with their work since they have optical photometry whereas we have near-infrared photometry. In Fig. 9 we plot the FJ fit to the range of masses where Bernardi et al. (2011b) consider that the relation is linear. Most of our BGGs follows the expected curvature in the vs. relation, confirming and extending the results by Bernardi et al. (2011b).
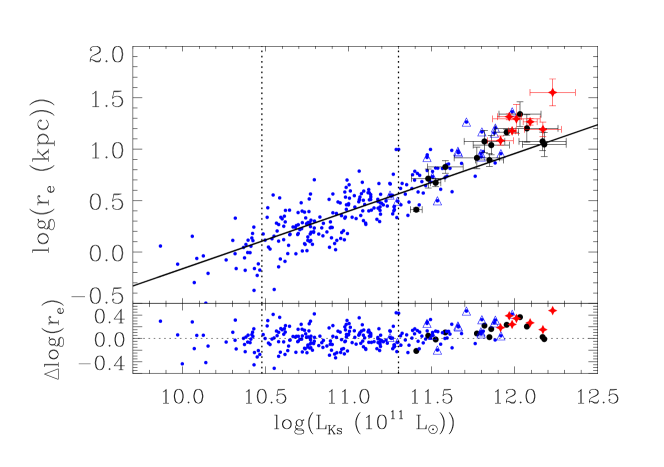
4.6 Effective radius vs. luminosity
Figure 10 shows the relation between the -band luminosity in solar units obtained from the Sérsic fit to the surface brightness and the effective radius of the galaxies.
As done in the previous section, we tested the results of Bernardi et al. (2011b) with our sample of massive BGGs. We fitted a straight line in logarithmic scale to the data in the mass range 310M21011 and extrapolated such a fit to larger masses. From our data, it is clear that most of our BGGs follow the expected curvature in the vs. relation, i.e., galaxies with masses higher than 2 1011M☉ have larger effective radius for a given mass than their counterparts in the mass range between 3101011, in agreement with Bernardi et al. (2011b).
5 Discussion
The BGGs of the fossil systems presented in this study represent a subset of the brightest and most massive galaxies in the Universe. This can be seen by looking at both their -band luminosities and central stellar velocity dispersions. However, they closely follow the FP scaling relation defined by normal elliptical galaxies and other BCGs, suggesting that they are dynamically relaxed systems at least in their central regions.
FGs are believed to be created fast and in an early epoch of the Universe by the efficient merger of galaxies inside DM halos (D’Onghia et al., 2005; Díaz-Giménez et al., 2011). In this scenario, the BGGs observed at low redshift had time to reach a virialized status although some remnant of their merger phase could still be present. The different relaxation time scales between the inner and outer regions imply that the outskirts of galaxies may have fossil information about their past formation. The continuously increasing ellipticity profile observed in almost all galaxies of our sample could be a hint of such a merger history. Porter et al. (1991) reported on this behaviour of the ellipticity profiles in a sample of BCGs, they found that 50% of the BCGs in rich clusters present these characteristics and associated them with the observed absence of rotation in luminous ellipticals (Davies et al., 1983; Carter et al., 1985). This result might be consistent with our findings if the increasing ellipticity profiles are correlated with galaxy luminosity. In addition, Boylan-Kolchin et al. (2006) demonstrated by using numerical simulations that these ellipticity trends can be explained in terms of a high fraction of radial collisions, indicating a preferential direction in the orbits of the mergers.
Assuming that FGs were formed in an early epoch (Dariush et al., 2007; Díaz-Giménez et al., 2011) and then passively evolved for a long time in order to reach a relaxed state, it is customary to consider that dissipational mergers with a high fraction of gas should be predominant in the formation of these systems (Díaz-Giménez et al., 2008). Recent works by Robertson et al. (2006) and Hopkins et al. (2008) have demonstrated through simulations and observations, respectively, how the observed tilt of the FP can be explained in terms of the amount of dissipation involved in the formation of elliptical galaxies. They conclude that galaxies formed through dissipationless mergers perfectly follow the FP defined by the virial theorem () whereas ellipticals formed through dissipational mergers will present a FP tilt depending on the fraction of gas involved in the merger. Our galaxies, as normal ellipticals, are well described by a tilted FP, thus showing some indications that most of them could be the remnants of mergers with a high gas fraction. In addition, numerical simulations show that gas-rich mergers at an early stage of the formation of BGGs are needed to account for the observed properties of elliptical galaxies (Hernquist et al., 1993; Naab & Ostriker, 2009).
However, numerical simulations of gas-rich mergers also predict that the remnants will be round and compact galaxies (i.e., with small effective radius) where the stellar velocity dispersions should increase (e.g., Khochfar & Silk, 2006; Naab et al., 2007; Hopkins et al., 2008). Recent observational works on early type galaxies by Bernardi et al. (2011a, b) have shown a change in the slope of different scaling relations that involve the stellar mass. This trend is interpreted by the authors in terms of the kind of mergers that have been involved in the formation of these systems. Major dissipationless mergers between galaxies are mechanisms expected to increase the final size of the resulting galaxy but not its central velocity dispersion; however, if minor dry mergers are the predominant mechanism, they are expected to change both the size and velocity dispersion (Bernardi et al., 2011a). Therefore, Bernardi et al. (2011b) claimed that the most feasible scenario is that galaxies with 1011M☉ formed mainly by major dissipationless mergers. It is clear that most of our BGGs follow the expected curvature in both the vs. (Fig. 9) and vs. (Fig. 10) relations, confirming the observational trend found by Bernardi et al. (2011b). This interpretation contradicts the previous one hinting toward a formation scenario where most of our BGGs formed through major gas-rich merger (Khosroshahi et al., 2006).
Another commonly used proxy to understand the formation mechanisms of early-type galaxies is the Sérsic index. Numerical simulations predict Sérsic indexes for the remnants of dry mergers in the range (González-García & Balcells, 2005; Naab & Trujillo, 2006), whereas in dissipational mergers they would be in the range (Hopkins et al., 2009; Kormendy et al., 2009). We have tentatively divided our sample in galaxies with and 3 in order to understand whether the shape of the surface-brightness profiles could be used to distinguish among the different formation scenarios. We did not find any relation between the departure from the intermediate-mass scaling relations and Sérsic index. Similarly, several works based on numerical simulations found that the shape of the isophotes can be also used to trace the merger history of elliptical galaxies (Naab & Burkert, 2003; Khochfar & Burkert, 2005; Naab et al., 2006). These studies found out that disky isophotes are the result of gas-rich mergers whereas boxy isophotes are preferentially formed in dissipationless collisions. Supported by these results, Khosroshahi et al. (2006) claim that BGGs in fossil systems were formed through dissipational mergers since they show non-boxy isophotes. We measured the isophote shapes by means of the coefficient, however, their noisy profiles (Fig. 4) prevented us to extract conclusions about the merger history of our BGGs based on the isophotes shape.
Interestingly, we found that the ellipticity turned out to be a good indicator of the kind of merger involved in the formation of BGGs. Numerical simulations show that the remnants of dissipational mergers are rounder on average when compared to remnants of dissipationless mergers (Cox et al., 2004). In fact, the ellipticity distribution of dissipational merger remnants peaks at about 0.2 which is in sharp contrast to the dissipationless remnants whose distribution of ellipticities peaks at about 0.4. We used this information to separate our BGGs in galaxies with and . We measured the ellipticities at to mimic simulations. The results are shown in Figs. 9 and 10. It is clear that BGGs with larger ellipticities systematically deviate from the intermediate-mass scaling relation, whereas rounder galaxies are also distributed near to this relation. Therefore, we interpret this result as a further hint that dissipationless mergers () are the main processes driven the evolution of BGGs.
We conclude that BGGs in fossil systems suffered major dissipational mergers in an early epoch of their formation, but the bulk of their mass is assembled latter in subsequent dissipationless mergers that increase the BGGs size.
6 Conclusions
We analyzed the near-infrared -band photometric properties of a sample of 20 BGGs observed within the framework of the FOGO project (Aguerri et al., 2011). So far, this represent the largest sample of BGGs in fossil systems studied in the near-infrared. Here we summarize our results:
-
•
The structural parameters of the sample galaxies were derived using the GASP2D algorithm (Méndez-Abreu et al., 2008) by fitting a Sérsic model to the their surface-brightness distribution. This model provides a good description for all the galaxies and allows a straightforward comparison with the results available in literature.
-
•
Only one sample BGG is a candidate to be a cD galaxy since it shows an upward break in the surface-brightness profile with respect to a de Vaucouleurs profile.
-
•
The ellipticity profile of most of our galaxies is an increasing function of the radius. This can be related to the fact that our galaxies represent the very bright end of the luminosity function. The trend in the ellipticity profile cannot be explained in terms of a oblate/prolate spheroid. Together with the variation observed in the galaxy centroid and position angle radial profiles, it might indicate the presence of preferential direction in the orbits of the mergers.
-
•
We built the -band scaling relations (FP, KR, and FJ) for our sample of BGGs and we compared them with those of normal elliptical and BCGs. We did not find any significant difference between the FP defined by BGGs and those of ellipticals or BCGs. This suggests that the central regions of BGGs are relaxed with structure similar to those of normal ellipticals. However, we found a change of the slope in the FJ and in the vs. relation for our massive galaxies.
These observational results can be interpreted in terms of the formation scenario of the BGGs. Our BGGs sample follows the FP of ellipticals and therefore are well reproduced by a tilted FP. Therefore, this supports that most of our BGGs probably suffered dissipational mergers during their formation. However, the curvature found in the scaling relation involving the mass of the galaxies can be interpreted as an indication that the stellar mass of these systems grew mainly by dissipationless mergers. Therefore, we suggest that BGGs in fossil system suffered major dissipational mergers in an early epoch of their formation, but the bulk of their mass is assembled latter in subsequent dissipationless mergers that increase the BGGs size.
Acknowledgements.
We acknowledge the anonymous referee for the positive comments which helped us to improve the paper. JMA, JIP, and JVM are partially funded by the Spanish MICINN under the Consolider-Ingenio 2010 Program grant CSD2006-00070: First Science with the GTC (http://www.iac.es/consolider-ingenio-gtc). JMA and JALA are partially funded by the Spanish MICINN (grants AYA2007-67965-C03-01 and AYA2010-21887-C04-04). JIP and JVM are partially funded by the Spanish MICINN (grants AYA2007-67965-C03-02 and AYA2010-21887-C04-01). EMC is supported by the University of Padua through grants CPDA089220, 60A02-1283/10, and 60A02-5052/11 and by the Italian Space Agency (ASI) through grant ASI-INAF I/009/10/0. This article is based on observations made with the William Herschel Telescope operated on the island of La Palma, in the Spanish Observatorio del Roque de los Muchachos of the Instituto de Astrofísica de Canarias. This work is based in part on data obtained as part of the UKIRT Infrared Deep Sky Survey.References
- Aguerri et al. (2011) Aguerri, J. A. L., Girardi, M., Boschin, W., et al. 2011, A&A, 527, A143
- Aguerri et al. (2004) Aguerri, J. A. L., Iglesias-Paramo, J., Vilchez, J. M., & Muñoz-Tuñón, C. 2004, AJ, 127, 1344
- Aguerri et al. (2005) Aguerri, J. A. L., Iglesias-Páramo, J., Vílchez, J. M., Muñoz-Tuñón, C., & Sánchez-Janssen, R. 2005, AJ, 130, 475
- Aihara et al. (2011) Aihara, Allende Prieto, C., An, D., et al. 2011, ArXiv e-prints
- Ascaso et al. (2011) Ascaso, B., Aguerri, J. A. L., Varela, J., et al. 2011, ApJ, 726, 69
- Beifiori et al. (2011) Beifiori, A., Courteau, S., Corsini, E. M., & Zhu, Y. 2011, MNRAS, submitted
- Bernardi et al. (2011a) Bernardi, M., Roche, N., Shankar, F., & Sheth, R. K. 2011a, MNRAS, 412, 684
- Bernardi et al. (2011b) Bernardi, M., Roche, N., Shankar, F., & Sheth, R. K. 2011b, MNRAS, 412, L6
- Bertin & Arnouts (1996) Bertin, E. & Arnouts, S. 1996, A&AS, 117, 393
- Boylan-Kolchin et al. (2006) Boylan-Kolchin, M., Ma, C.-P., & Quataert, E. 2006, MNRAS, 369, 1081
- Bruzual & Charlot (2003) Bruzual, G. & Charlot, S. 2003, MNRAS, 344, 1000
- Caon et al. (1993) Caon, N., Capaccioli, M., & D’Onofrio, M. 1993, MNRAS, 265, 1013
- Carter et al. (1985) Carter, D., Inglis, I., Ellis, R. S., Efstathiou, G., & Godwin, J. G. 1985, MNRAS, 212, 471
- Casali & Hawarden (1992) Casali, M. M. & Hawarden, T. G. 1992, in UKIRT Newsletter, UKIRT Newsletter
- Cox et al. (2004) Cox, T. J., Primack, J., Jonsson, P., & Somerville, R. S. 2004, ApJ, 607, L87
- Cui et al. (2011) Cui, W., Springel, V., Yang, X., De Lucia, G., & Borgani, S. 2011, ArXiv e-prints
- Cypriano et al. (2006) Cypriano, E. S., Mendes de Oliveira, C. L., & Sodré, Jr., L. 2006, AJ, 132, 514
- Dalla Bontà et al. (2011) Dalla Bontà, E., Houghton, R., Davies, R. L., & et al. 2011, MNRAS, in preparation
- Dariush et al. (2007) Dariush, A., Khosroshahi, H. G., Ponman, T. J., et al. 2007, MNRAS, 382, 433
- Davies et al. (1983) Davies, R. L., Efstathiou, G., Fall, S. M., Illingworth, G., & Schechter, P. L. 1983, ApJ, 266, 41
- de Vaucouleurs (1948) de Vaucouleurs, G. 1948, Annales d’Astrophysique, 11, 247
- Démoclès et al. (2010) Démoclès, J., Pratt, G. W., Pierini, D., et al. 2010, A&A, 517, A52
- Díaz-Giménez et al. (2008) Díaz-Giménez, E., Muriel, H., & Mendes de Oliveira, C. 2008, A&A, 490, 965
- Díaz-Giménez et al. (2011) Díaz-Giménez, E., Zandivarez, A., Proctor, R., Mendes de Oliveira, C., & Abramo, L. R. 2011, A&A, 527, A129
- Djorgovski & Davis (1987) Djorgovski, S. & Davis, M. 1987, ApJ, 313, 59
- D’Onghia et al. (2005) D’Onghia, E., Sommer-Larsen, J., Romeo, A. D., et al. 2005, ApJ, 630, L109
- Dressler et al. (1987) Dressler, A., Lynden-Bell, D., Burstein, D., et al. 1987, ApJ, 313, 42
- Faber & Jackson (1976) Faber, S. M. & Jackson, R. E. 1976, ApJ, 204, 668
- Gonzalez et al. (2003) Gonzalez, A. H., Zabludoff, A. I., & Zaritsky, D. 2003, Ap&SS, 285, 67
- Gonzalez et al. (2005) Gonzalez, A. H., Zabludoff, A. I., & Zaritsky, D. 2005, ApJ, 618, 195
- González-García & Balcells (2005) González-García, A. C. & Balcells, M. 2005, MNRAS, 357, 753
- Graham & Guzmán (2003) Graham, A. W. & Guzmán, R. 2003, AJ, 125, 2936
- Hernquist et al. (1993) Hernquist, L., Spergel, D. N., & Heyl, J. S. 1993, ApJ, 416, 415
- Hoessel et al. (1987) Hoessel, J. G., Oegerle, W. R., & Schneider, D. P. 1987, AJ, 94, 1111
- Hopkins et al. (2009) Hopkins, P. F., Cox, T. J., Dutta, S. N., et al. 2009, ApJS, 181, 135
- Hopkins et al. (2008) Hopkins, P. F., Cox, T. J., & Hernquist, L. 2008, ApJ, 689, 17
- Jedrzejewski (1987) Jedrzejewski, R. I. 1987, MNRAS, 226, 747
- Jones et al. (2003) Jones, L. R., Ponman, T. J., Horton, A., et al. 2003, MNRAS, 343, 627
- Jørgensen et al. (1999) Jørgensen, I., Franx, M., Hjorth, J., & van Dokkum, P. G. 1999, MNRAS, 308, 833
- Jørgensen et al. (1995) Jørgensen, I., Franx, M., & Kjaergaard, P. 1995, MNRAS, 276, 1341
- Jørgensen et al. (1996) Jørgensen, I., Franx, M., & Kjaergaard, P. 1996, MNRAS, 280, 167
- Kelson et al. (1997) Kelson, D. D., van Dokkum, P. G., Franx, M., Illingworth, G. D., & Fabricant, D. 1997, ApJ, 478, L13+
- Khochfar & Burkert (2005) Khochfar, S. & Burkert, A. 2005, MNRAS, 359, 1379
- Khochfar & Silk (2006) Khochfar, S. & Silk, J. 2006, ApJ, 648, L21
- Khosroshahi et al. (2006) Khosroshahi, H. G., Maughan, B. J., Ponman, T. J., & Jones, L. R. 2006, MNRAS, 369, 1211
- Khosroshahi et al. (2007) Khosroshahi, H. G., Ponman, T. J., & Jones, L. R. 2007, MNRAS, 377, 595
- Khosroshahi et al. (2004) Khosroshahi, H. G., Raychaudhury, S., Ponman, T. J., Miles, T. A., & Forbes, D. A. 2004, MNRAS, 349, 527
- Kjaergaard et al. (1993) Kjaergaard, P., Jorgensen, I., & Moles, M. 1993, ApJ, 418, 617
- Kormendy (1977) Kormendy, J. 1977, ApJ, 218, 333
- Kormendy et al. (2009) Kormendy, J., Fisher, D. B., Cornell, M. E., & Bender, R. 2009, ApJS, 182, 216
- La Barbera et al. (2003) La Barbera, F., Busarello, G., Merluzzi, P., Massarotti, M., & Capaccioli, M. 2003, ApJ, 595, 127
- La Barbera et al. (2009) La Barbera, F., de Carvalho, R. R., de la Rosa, I. G., et al. 2009, AJ, 137, 3942
- Liu et al. (2008) Liu, F. S., Xia, X. Y., Mao, S., Wu, H., & Deng, Z. G. 2008, MNRAS, 385, 23
- Manchado et al. (2004) Manchado, A., Barreto, M., Acosta-Pulido, J., et al. 2004, in Society of Photo-Optical Instrumentation Engineers (SPIE) Conference Series, Vol. 5492, Society of Photo-Optical Instrumentation Engineers (SPIE) Conference Series, ed. A. F. M. Moorwood & M. Iye, 1094–1104
- Matthews et al. (1964) Matthews, T. A., Morgan, W. W., & Schmidt, M. 1964, ApJ, 140, 35
- Mendes de Oliveira et al. (2009) Mendes de Oliveira, C. L., Cypriano, E. S., Dupke, R. A., & Sodré, L. 2009, AJ, 138, 502
- Mendes de Oliveira et al. (2006) Mendes de Oliveira, C. L., Cypriano, E. S., & Sodré, Jr., L. 2006, AJ, 131, 158
- Méndez-Abreu et al. (2008) Méndez-Abreu, J., Aguerri, J. A. L., Corsini, E. M., & Simonneau, E. 2008, A&A, 478, 353
- Méndez-Abreu et al. (2010) Méndez-Abreu, J., Simonneau, E., Aguerri, J. A. L., & Corsini, E. M. 2010, A&A, 521, A71+
- Morelli et al. (2008) Morelli, L., Pompei, E., Pizzella, A., et al. 2008, MNRAS, 389, 341
- Mulchaey & Zabludoff (1999) Mulchaey, J. S. & Zabludoff, A. I. 1999, ApJ, 514, 133
- Naab & Burkert (2003) Naab, T. & Burkert, A. 2003, ApJ, 597, 893
- Naab et al. (2006) Naab, T., Jesseit, R., & Burkert, A. 2006, MNRAS, 372, 839
- Naab et al. (2007) Naab, T., Johansson, P. H., Ostriker, J. P., & Efstathiou, G. 2007, ApJ, 658, 710
- Naab & Ostriker (2009) Naab, T. & Ostriker, J. P. 2009, ApJ, 690, 1452
- Naab & Trujillo (2006) Naab, T. & Trujillo, I. 2006, MNRAS, 369, 625
- Nelson et al. (2002) Nelson, A. E., Simard, L., Zaritsky, D., Dalcanton, J. J., & Gonzalez, A. H. 2002, ApJ, 567, 144
- Nigoche-Netro et al. (2008) Nigoche-Netro, A., Ruelas-Mayorga, A., & Franco-Balderas, A. 2008, A&A, 491, 731
- Pahre (1999) Pahre, M. A. 1999, ApJS, 124, 127
- Pahre et al. (1998) Pahre, M. A., Djorgovski, S. G., & de Carvalho, R. R. 1998, AJ, 116, 1591 [P98]
- Pizzella et al. (2008) Pizzella, A., Corsini, E. M., Sarzi, M., et al. 2008, MNRAS, 387, 1099
- Poggianti (1997) Poggianti, B. M. 1997, A&AS, 122, 399
- Ponman et al. (1994) Ponman, T. J., Allan, D. J., Jones, L. R., et al. 1994, Nature, 369, 462
- Porter et al. (1991) Porter, A. C., Schneider, D. P., & Hoessel, J. G. 1991, AJ, 101, 1561
- Press et al. (1992) Press, W. H., Teukolsky, S. A., Vetterling, W. T., & Flannery, B. P. 1992, Numerical recipes in FORTRAN. The art of scientific computing, ed. Press, W. H., Teukolsky, S. A., Vetterling, W. T., & Flannery, B. P.
- Robertson et al. (2006) Robertson, B., Cox, T. J., Hernquist, L., et al. 2006, ApJ, 641, 21
- Romeo et al. (2008) Romeo, A. D., Napolitano, N. R., Covone, G., et al. 2008, MNRAS, 389, 13
- Sandage & Perelmuter (1991) Sandage, A. & Perelmuter, J. 1991, ApJ, 370, 455
- Santos et al. (2007) Santos, W. A., Mendes de Oliveira, C., & Sodré, Jr., L. 2007, AJ, 134, 1551
- Schombert (1987) Schombert, J. M. 1987, ApJS, 64, 643
- Seigar et al. (2007) Seigar, M. S., Graham, A. W., & Jerjen, H. 2007, MNRAS, 378, 1575
- Sérsic (1968) Sérsic, J. L. 1968, Atlas de galaxias australes, ed. Sersic, J. L.
- Sommer-Larsen (2006) Sommer-Larsen, J. 2006, MNRAS, 369, 958
- Sun et al. (2004) Sun, M., Forman, W., Vikhlinin, A., et al. 2004, ApJ, 612, 805
- Sun et al. (2009) Sun, M., Voit, G. M., Donahue, M., et al. 2009, ApJ, 693, 1142
- Tortora et al. (2009) Tortora, C., Napolitano, N. R., Romanowsky, A. J., Capaccioli, M., & Covone, G. 2009, MNRAS, 396, 1132
- Trujillo & Aguerri (2004) Trujillo, I. & Aguerri, J. A. L. 2004, MNRAS, 355, 82
- Trujillo et al. (2001) Trujillo, I., Aguerri, J. A. L., Cepa, J., & Gutiérrez, C. M. 2001, MNRAS, 328, 977
- Trujillo et al. (2004) Trujillo, I., Burkert, A., & Bell, E. F. 2004, ApJ, 600, L39
- Vikhlinin et al. (1999) Vikhlinin, A., McNamara, B. R., Hornstrup, A., et al. 1999, ApJ, 520, L1
- Voevodkin et al. (2010) Voevodkin, A., Borozdin, K., Heitmann, K., et al. 2010, ApJ, 708, 1376
- von Benda-Beckmann et al. (2008) von Benda-Beckmann, A. M., D’Onghia, E., Gottlöber, S., et al. 2008, MNRAS, 386, 2345
- Zibetti et al. (2009) Zibetti, S., Pierini, D., & Pratt, G. W. 2009, MNRAS, 392, 525
- Ziegler et al. (1999) Ziegler, B. L., Saglia, R. P., Bender, R., et al. 1999, A&A, 346, 13