Robust artificial neural networks and outlier detection.
Technical report
Abstract
Large outliers break down linear and nonlinear regression models. Robust regression methods allow one to filter out the outliers when building a model. By replacing the traditional least squares criterion with the least trimmed squares criterion, in which half of data is treated as potential outliers, one can fit accurate regression models to strongly contaminated data. High-breakdown methods have become very well established in linear regression, but have started being applied for non-linear regression only recently. In this work, we examine the problem of fitting artificial neural networks to contaminated data using least trimmed squares criterion. We introduce a penalized least trimmed squares criterion which prevents unnecessary removal of valid data. Training of ANNs leads to a challenging non-smooth global optimization problem. We compare the efficiency of several derivative-free optimization methods in solving it, and show that our approach identifies the outliers correctly when ANNs are used for nonlinear regression.
Keywords Global optimization; Non-smooth optimization; Robust regression; Neural networks, Least trimmed squares.
1 Introduction
We consider the problem of function approximation with artificial neural networks (ANNs). This generic task has many applications in science and engineering, such as signal processing, pattern recognition, and control. The goal is to model an unknown nonlinear function based on observed input-output pairs. ANNs are universal function approximators [19], and usually they deliver good performance in applications.
Error-free data are rarely provided in applications. First, the data are usually contaminated by noise, which reflects inaccuracies in observations and stochastic nature of the underlying process. ANNs and other function approximators deal with such noise quite efficiently, by minimising the sum of squared differences between the observed and predicted values, or a more sophisticated fitting criterion, such as Huber-type functions, which are the basis of M-estimators in statistics [20].
The second type of data contamination has to do with either gross observation errors (e.g., equipment malfunction, or notorious replacing missing values with zeroes, wrong decimal points and other blunders), or the data reflecting a mixture of different phenomena. These data, which usually take aberrant values, are called outliers. It has been noted that typically the occurrence of outliers in routine data ranges from 1% to 10%. When fitting a model to the data, outliers need to be identified and eliminated, or, alternatively, examined closely, as they may be of the main interest themselves. Notable examples are intrusion and cyberattack detection, detection of harmful chemicals and cancerous cells.
The methods of function approximation based on the least squares (or, more generally, maximum likelihood principle) are not robust against outliers. In fact just one aberrant value can make the model’s bias infinite (it is said that the method breaks down). This phenomenon is well known in linear regression [47, 30], where a number of robust high-breakdown methods have been developed. The popular methods of least median of squares (LMS) and least trimmed squares (LTS) [46] discard half of the data as potential outliers and fit a model to the remaining half. These methods determine numerically which half of the data should be discarded in order to obtain the smallest value of the respective objectives. That way, up to half of the data can be outliers but they do not break down the method. It is said that their (asymptotic) breakdown point is . The outliers themselves can be identified by their large residuals, something that cannot be achieved when using the least squares estimators, or maximum likelihood estimators (called M-estimators), because of the masking effect (i.e., the outliers affect the fitted model so much that their residuals do not stand out).
Much less work has been devoted to non-linear high-breakdown regression. There are very few papers dealing with the LTS method applied to ANNs, see for example, [57]. More recently, Liano [26] used M-estimators to study the mechanism by which outliers affect the resulting ANNs. Chen and et. al [8] also used M-estimators as a robust estimator in the presence of outliers. The Least Trimmed Squares estimator was discussed in [23, 49, 50]. A robust LTS backpropagation algorithm based on simulated annealing was considered in [50].
It is known that fitting the LTS or LMS criterion is an NP-hard problem even in linear regression. The objective has a large number of local minima and is non-smooth. The problem becomes even more complicated for ANNs, because
-
(a)
the dimensionality of the problem increases even further with the number of hidden neurons used, and
-
(b)
the ANN training is an NP-hard problem even when using the traditional least squares criterion.
Training ANNs with LTS or LMS criterion is very challenging because of a much higher number of local minima as well as non-applicability of the traditional fast backpropagation algorithm because of non-smoothness of the objective.
In this article we advance the methods for robust fitting of ANNs using LTS and related fitting criteria. Our first contribution is to design a hybrid algorithm, which combines a derivative free optimisation method for initial training of ANN, removal of the detected outliers, and then fine tuning of ANN weights using clean data and backpropagation. The second contribution is the design of an improved fitting criterion, called Penalised CLTS (PCLTS), which prevents unnecessary removal of valid data. The LTS and LMS criteria have this undesirable effect, illustrated in our experiments. The PCLTS criterion prevents unnecessary removals by imposing a penalty on removal of every datum.
This article is structured as follows. In Section 2, we introduce the problem of robust regression, recall the definitions and the main features of several existing high-breakdown estimators, and discuss the associated optimization problem. In Section 3 we introduce the PCLTS criterion for ANN fitting. In Section 4, we outline the existing approaches to solution of the related optimization problem and present three new methods we use in this study. Section 5 is devoted to a comparative numerical study of the optimization methods using several data sets. Section 6 concludes the article.
2 High-breakdown robust estimators
In this section, we briefly introduce a statistical problem which is in the origin of the non-smooth global optimization problem treated in this paper. We start the discussion with high-breakdown linear regression, which will be followed by nonlinear regression.
2.1 Robust linear regression
Consider the standard multiple linear regression model
| (1) |
where for regression with an intercept term. Here is the matrix of explanatory variables of full column rank, and is a -vector of independent and identically distributed random errors with zero mean and (unknown) variance . The goal is to determine the vector of unknown parameters . The goodness of fit is expressed in terms of the residuals , namely the sum for the ordinary least squares (OLS) and for the least absolute deviations (LAD) methods.
As we mentioned in the introduction, the OLS and LAD are very sensitive to large outliers in the data. Just one grossly atypical datum can affect the model. A breakdown point of a regression estimator is the smallest proportion of contaminated data that can make the estimator’s bias arbitrarily large (see [16], [47], p.10). The breakdown point of the OLS and LAD methods tends to zero as with the increasing sample size , and is said to be 0%.
To overcome the lack of robustness of OLS and LAD estimators, Rousseeuw [46] introduced the least median of squares and least trimmed squares estimators. The methods of the least trimmed absolute deviations (LTA) and the maximum trimmed likelihood (MTL) were advocated in [56, 17, 14]. These methods are robust to leverage points, and allow up to a half of the data to be contaminated without affecting the regression model. Atypical data are then detected by their large residuals. For recent accounts of the state-of-the-art in high-breakdown robust regression, see [47, 30].
Essentially, the LTS, LTA and MTL methods work in the following way. Half of the sample is discarded, and a regression model is built using the other half. The sum of the residuals is then evaluated. The objective is to find the optimal partition of the data into two halves, so that the sum of the (squared or absolute) residuals is the smallest. This is a combinatorial formulation of the problem. Evidently the solution is feasible only for small data sets.
The same problem can be formulated as a continuous non-smooth optimization problem:
| (2) |
where the residuals are ordered in the increasing order , and , where is the floor function. The variables in this model are the regression coefficients . For small to moderate dimension but large data sets this model offers significant numerical advantages. It is the basis of fast heuristic algorithms in high-breakdown regression [48]. Several recent methods based on this formulation, including evolutionary and semidefinite programming, were presented in [35, 34, 7, 51, 3].
The four methods mentioned above achieve the highest attainable asymptotic breakdown point of , which means that up to a half of the data can be contaminated without affecting the estimator. Consequently, the outliers can be easily detected by their large residuals, and either eliminated, or alternatively, examined more closely in the cases where the outliers themselves are of the main interest.
It is shown in [5] that computation of the high-breakdown estimators is an NP-hard problem. Indeed, the objective in the methods mentioned above has multiple local minima. Consider, for instance, the LTS estimator. The problem (2) can be written as
where is a permutation of the vector . Subsequently we write it as
The inner optimization problem is convex, and has a unique minimum (potentially, multiple minimizers). Then problem (2) will potentially have as many as local minima (the number of permutations which result in distinct sums for any fixed ).
In addition to determining the breakdown point of an estimator, it is also essential to ivestigate its efficiency. It is customary to evaluate the efficiency by comparing it to that of the OLS estimator. A fully efficient estimator should deliver the same accuracy as the maximum likelihood based estimator (which is OLS when the noise is Gaussian) when the data set contains no outliers. The relative efficiency of the LMS, LTS and LTA methods for normally distributed data is low [30, 47]. However, fully efficient high-breakdown estimators exist. The reweighted least squares estimator (REWLSE) is one such estimator presented in [13].
To improve the efficiency, while preserving the breakdown point, Gervini and Yohai [13] use a two-step process: an initial high-breakdown estimator (like LMS, or LTS) provides a robust estimate of scale used to re-weigh the data. The weights are given by the formula
| (3) |
where is the adaptive cutoff value beyond which the sample proportion of absolute residuals exceeds the theoretical proportion. The weights given by (3) effectively remove all outliers. The adaptive estimate REWLSE is then computed as a weighted OLS: with .
The two-step process in REWLSE computes fully efficient estimators when the data are normally distributed, as no data are unnecessarily removed. REWLSE inherits the breakdown point of the initial estimator and combines it with full efficiency of the final LS estimator.
2.2 Nonlinear robust regression
We now consider a nonlinear regression model
| (4) |
where is an arbitrary (nonlinear) function, is a set of parameters (it may vary depending on the particular specification of a class of regression models), are the fixed data points or inputs and are the outputs. Regression neural networks give us examples of such functions. For instance, each neural network with one hidden layer and one output defines a function of the form
where (and ) are the hidden (respectively, input) layer weights, is the size of the hidden layer, is the number of inputs plus one (the bias term), and is a transfer function. Altogether, has parameters represented by .
For regression ANNs, the OLS fitting criterion is typically used, i.e., the weights are found by minimising
| (5) |
with the residuals . Backpropagation is usually the algorithm of choice for minimising , although Levenberg Marquardt is also used [15, 31]. In both cases, a randomly chosen initial weighting vector is needed, and often both methods are combined with random start heuristic, because has multiple local minima. The number of local minima of grows exponentially with the length of .
As in the case of linear regression, the OLS criterion is not robust against outliers. This can be clearly demonstrated by replacing one or more data with very large or very small values, see examples in Section 5. Unlike in the case of linear regression, where the whole regression model is shifted towards the abnormal value, models provided by regression ANNs exhibit wild oscillations at the abnormal datum, which significantly affect the rest of the data.
There have been attempts to use more robust Huber-type criterion (which is used in M-estimators) [8, 26]. Here the squared residuals in (5) are replaced with , where is an non-negative monotone increasing function with , whose growth decreases with the size of the argument. This way very large residuals have a limited effect on the objective . The objective itself becomes more complex, as even in linear regression, when depend on linearly, is the sum of quasi-convex terms, which is not quasi-convex itself. Huber-type functions also have another problem. The scale of their argument has to be either determined a priori, or be data-dependent. In the former case the estimator is not scale invariant, whereas in the latter case a robust estimation of the scale parameter is needed. When estimation of the scale is not robust (for example, taking as the mean of the absolute residuals and evaluating ), the M-estimator will not be robust.
The LTS criterion (2) was also used in ANN training [49]. It allows one to discard up to half of the data as potential outliers, and therefore make ANN model robust against largely abnormal data. Unlike in the case of linear regression, however, the LTS criterion may also discard good data together with the outliers. When there are no outliers in the data, it treats good data as outliers, and builds wrong regression models. We illustrate this on several examples in Section 5.
3 A new high-breakdown criterion for ANNs
In this section, we introduce a new fitting criterion, which has allowed us to overcome the deficiencies of the M-type and LTS criteria mentioned in the previous section. We propose this new criterion, called Penalised CLTS (PCLTS), with the following aims in mind
-
(A1)
We need to discard data with unusually large residuals as outliers.
-
(A2)
We need to penalise unnecessary removal of data.
-
(A3)
We need to keep all data with residuals which are comparatively small.
-
(A4)
For the purposes of optimising the criterion, we need it to be based on a Lipschitz-continuous function.
PCLTS is based on the CLTS criterion [3], in which the data are discarded if their absolute residuals are times larger than the median residual. The choice of corresponds to the LTS criterion, but values of larger than one lead to better efficiency of the estimator compared to OLS in the absence of outliers.
We propose the following objective, which addresses the aims (A1) to (A4) indicated above:
| (6) |
where , is the median of absolute residuals , and
| (7) |
where is a constant factor, is a small positive number, and is a parameter controlling the penalty for removal of data with large residuals. Since
is a linear interpolation between the points and , it is clear that the function is Lipschitz-continuous. When , and , we obtain a function which coincides with the LTS criterion almost everywhere. When , we obtain a Huber-type function, which is properly scaled, because the median is a robust estimator of the scale of the residuals (i.e., it is not affected by very large residuals).
4 Optimization methods
First, we will make a few general observations about the objective in (6). This function is non-convex and non-smooth, although it is Lipschitz-continuous. Compared to the LTS criterion (2), it has equally complex structure, although our experiments with the CLTS criterion in linear regression [3] indicated that the landscape of CLTS is less rugged compared to that of LTS. While the OLS criterion leads to a complex objective when training the standard ANNs (multiple local minima), backpropagation seems to be quite efficient in locating local minima of the OLS (5). Neither backpropagation nor Levenberg Marquardt will work with the new objective (6) directly. Therefore we studied several alternative minimisation methods.
Specifically, we focused on the following derivative free optimisation methods, which have shown good potential when applied to robust linear regression [3].
-
NEWUOA method of [40], combined with random start.
Powell’s NEWUOA is a derivative free method for smooth functions, based on quadratic model of the objective, obtained by interpolation of function values at a subset of previous trial points. While our objective is non-smooth (although it is piecewise smooth), we applied NEWUOA because this method is faster than proper non-smooth optimisation [27] methods like DFBM. Multiple local minima of the objective mean that we have to make several starts of the algorithm from different starting points, where speed becomes an issue. DSO was chosen because in previous studies [29, 28, 59] it delivered good performance when the objectives had a large number of variables. We also tried other derivative free methods (Nelder-Mead simplex method, pattern search APPSPACK [33, 44, 32]), but they were not competitive and were discarded in favour of those mentioned above.
All mentioned methods could detect the outliers effectively, but they were not numerically efficient nor sufficiently accurate when building regression models. We explain this by a relatively large number of variables – the weights of the ANN. Therefore we decided to design a hybrid method by combining detection and removal of outliers by using PCLTS objective, and subsequent training by backpropagation using cleaned data. This approach is in line with Gervini and Yohai’s REWLSE method for linear regression [13], in which an initial high-breakdown estimator is improved by fully efficient OLS on cleaned data. This proved to deliver accurate predictions for all data sets we have considered.
Thus our ANN training algorithm has the following steps.
-
I.
Use one of the mentioned oprimisation methods with PCLTS objective (6).
-
II.
Clean the data by removing the data with the residuals larger than .
-
III.
Use standard backpropagation with the OLS objective to train ANN on clean data.
The most time consuming step here is Step I. It requires multiple evaluations of the objective at a large number of points (typically of order of in our experiments). Step III is standard in ANN training, and it was executed using standard ANN training library with default parameters (in our studies we used nnet package in R software [45]). It took negligible CPU time compared to Step I. Step II is trivial.
We used implementations of NEWUOA, DFBM and DSO in C++ language (DFBM and DSO taken form GANSO library [4], and a translation of NEWUOA from Fortran to C). All methods have few overheads, and the main complexity was in evaluating the objective. In order to achieve competitive CPU time, we parallelised calculation of the objective and offloaded it to a graphics processing unit (GPU), NVIDIA’s Tesla C2050 [37, 36]. General Purpose GPUs have recently become a valuable alternative to traditional CPUs and CPU clusters. Tesla C2050 has 448 GPU cores and 3 GB of RAM, and can execute thousands of threads at a time. GPUs have limitations too, in particular it is Single Instruction Multiple Threads (SIMT) paradigm, which means that instructions in different threads (of the same thread block) need to be almost identical. For parallel calculation of the residuals this is not an issue, as this task is trivially parallel, and is executed using for_all primitive [18, 52]. Calculation of the median is done in parallel using either GPU parallel sorting [54, 6], or a specific GPU selection algorithm [2]. Summation is performed in parallel using GPU reduction [18, 52, 38].
5 Numerical experiments
5.1 Data sets
We generated several artificial data sets using test functions considered in several previous papers on robust ANNs, and also used several real world data sets to which we introduced outliers. The artificial data sets are described below in Data Sets 1 through to 10. In all of these examples, the independent variables were considered in , where the dimension took on the values . The values of were chosen uniformly at random in the segment indicated below in describing each data set of the corresponding example. The target variable was determined using the formula
| (8) |
where . In all data sets, the noise level adopted the values . The sizes of the samples in each data set were taken as . Then we replaced a proportion of the points with five subsets of outliers. The outliers were divided into 5 subsets of equal size. Each subset was centered at a point with the first coordinates chosen uniformly at random in the same segment as the explanatory variables, and with the last coordinate equal to 10,000 + N(0,0.01). For Data Sets 1 to 10 indicated below, we examined all combinations of the dimension , proportion of outliers , and noise level .
Data Set 1 uses the model (8) with the function given by the equation
| (9) |
where stands for the Euclidean norm of and where the explanatory variables are again chosen uniformly at random in the segment . Earlier, the robustness of ANN for this function and data with outliers was investigated in [9], [53] and [12] in the case where and .
Data Set 2 deals with the model (8) using the function given by the equation
| (10) |
where the explanatory variables are again chosen uniformly at random in the segment . This function was earlier considered in [12].
Data Set 3 is defined by the model (8) using the function given by the formula
| (11) |
where the explanatory variables are again chosen uniformly at random in the segment . The function (11) was considered in numerous articles. For example, it was investigated in [8], [9] and [55].
Data Set 4 uses the model (8) with the function given by equation
| (12) |
where and is the sample size. Earlier, the robustness of ANN for this function was investigated in [10] and [11].
Data Set 5 is given by the model (8) with the following function
| (13) |
where the explanatory variables are uniformly chosen in the segment . This function was investigated in [11], [24] and [39].
Data Set 6 deals with the model (8) given by the following function
| (14) |
where the explanatory variables are uniformly chosen in the segment . This function was investigated in [24] and [11].
Data Set 7 is defined by the model (8) with the function given by the formula
| (15) |
where . Earlier, this function was considered in [11], for only one value of .
Data Set 8 is given by the model (8) with the function defined by the equation
| (16) |
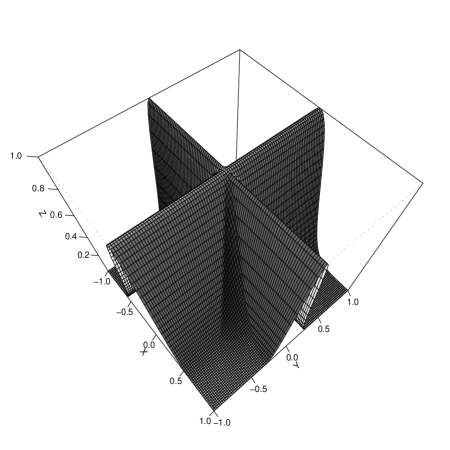
where . Earlier, this function was investigated in [11].
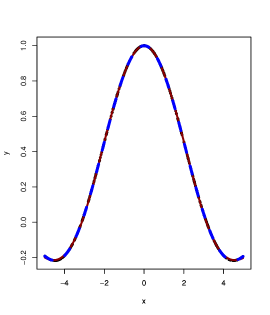
This function has an interesting surface plot in two variables, illustrated in Figure 1.
Data Set 10 is defined by the model (8) with the following function
| (18) |
where . It was considered in [25].
Data Set 11 is a real world data set from the standardized benchmark collection for neural networks Proben 1 publicly available from [43]. Proben 1 was considered in many articles, for example, [21, 22, 41, 42, 58]. The Data Set 11 is the set ‘building’ with 4208 instances, where the value of hourly electricity consumption is regarded as a function of 14 input variables and has to be predicted. Outliers have been introduced by replacing several values of the dependent variable with very large values (10,000).
Data Set 12 is also a real world data set from Proben 1. It uses the values of output variable ‘cold water consumption’ viewed as a function of 14 input variables, see [43, 41].
5.2 Parameters of the algorithms
We varied two parameters of the PCLTS objective: and . We took . The value (with ) corresponds to the LTS criterion, and it was interesting to observe the difference larger values of made. The value of the second parameter were chosen in . Here we studied the influence of the penalty for removing the data when cleaning the data set.
As far as the parameters of optimisation algorithms are concerned, we fixed them in order to give each method approximately the same CPU budget as the others. We fixed the number of random starts of NEWUOA and DFBM at 200. DFBM ran with the maximum number of iterations set to 1000.
We used nnet package in R to perform the final stage of ANN training with cleaned data with default parameters.
5.3 Benchmarking criteria
As it is customary in data analysis literature, we used the Root Mean Squared Error (RMSE) to measure the quality of approximation. The data were split into training and test subsets. The training subset contained noisy data with or without outliers. The test subset contained noiseless data, i.e. the accurate values of the test functions at uniformly distributed data within the domain of each function we considered. The size of each test sample was equal to that of the corresponding training sample. The test data set was generated separately and was not provided to the training algorithm. We report the RMSE on the test data set, which is the most important characteristic, reflecting ANN’s generalisation ability.
We also report the average CPU time taken by the PCLTS and the nnet procedures. The CPU time did not depend much on the test function, nor the Gaussian noise level or proportion of outliers, but rather on the dimension of the problem. Therefore we averaged the CPU time over different experiments.
5.4 Results and discussion
In the Appendix we presented detailed results for each of the test function we considered. In Tables 1–10 we compare RMSE values for PCLTS and standard backpropagation (nnet). The values in bold indicate the cases the method broke down.
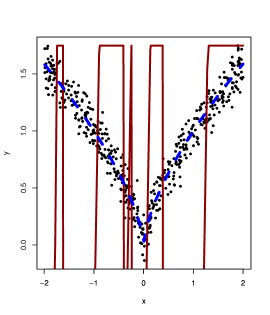
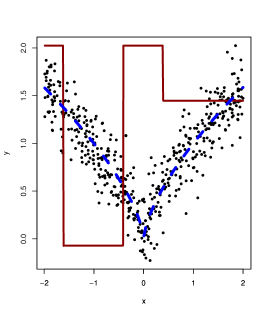
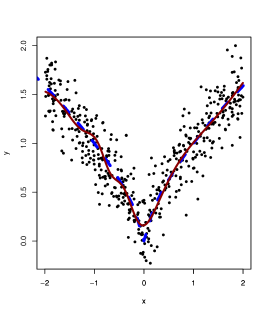
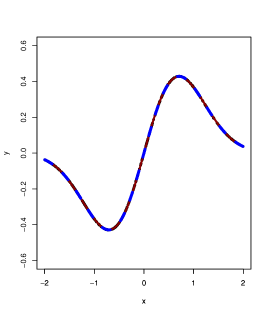
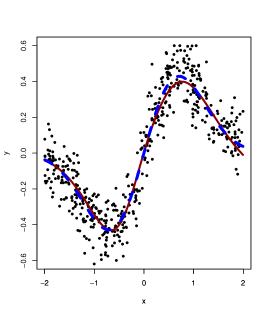
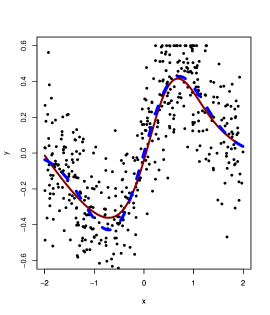
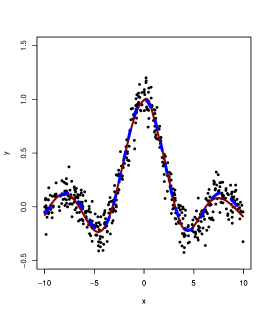
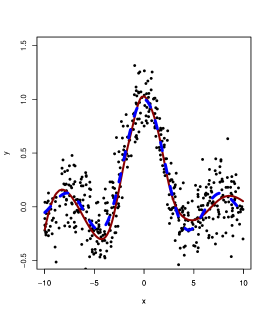
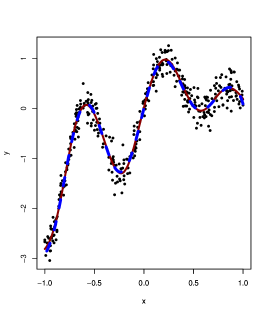
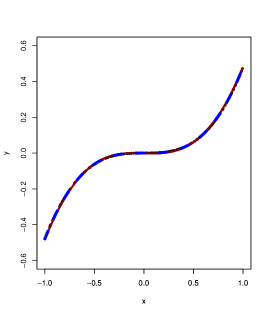
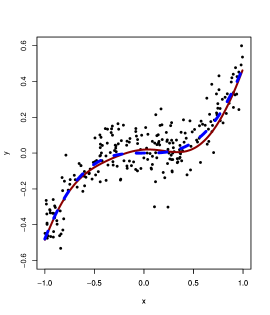
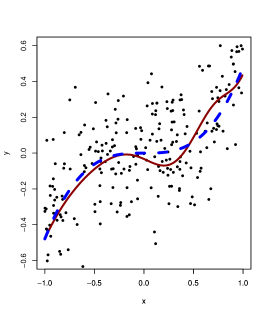
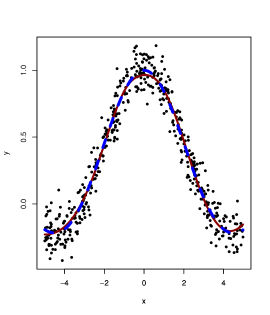
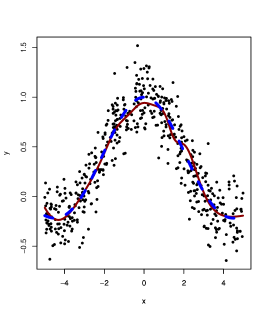
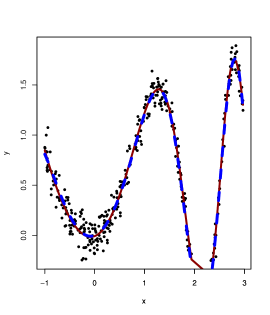
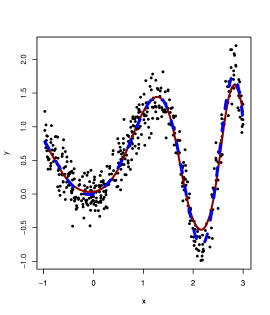
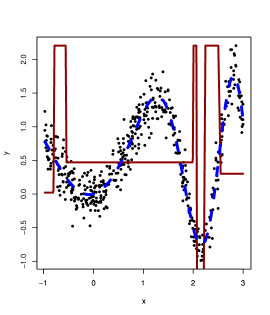
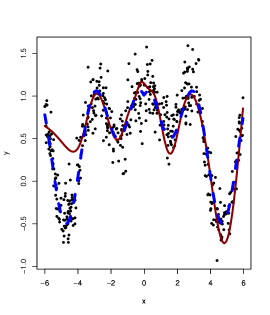
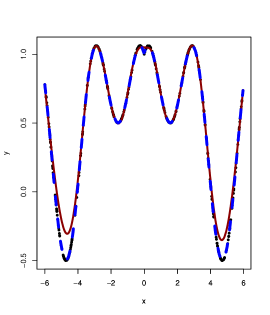
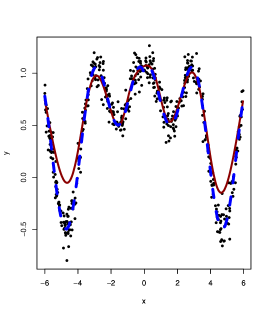
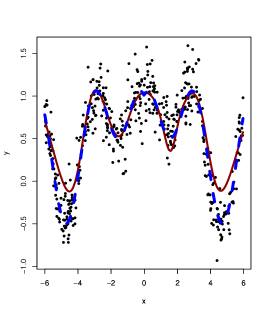
Two facts are apparent from these tables. First, it is the failure of the traditional ANN training to predict the test data sets. This can be viewed in Figure 2, top row, where the predictions are not even close to the majority of the train data, nor the test data. Similar pictures were obtained for other data sets, e.g. Figure 10,c). This is reflected in very large RMSE in the tables, which is consistent across the tables. Second, it is the ability of our method based on the PCLTS objective to filter out the outliers. We note that the RMSE are practically the same as RMSE of backpropagation in the absence of outliers (the values in nnet column not in boldface). This indicates that all outliers were filtered out, and only few, if any, good data were removed. So our method achieves the same accuracy when using contaminated data, as nnet when using only clean data, as if the outliers were not there. This is repeated across all data sets we used.
Furthermore, when there are no outliers in the data, our method delivers the same RMSE as backpropagation, which means that no (or almost no) data were unnecessarily removed.
Table 15 show the CPU time of PCLTS and backpropagation. We see that PCLTS takes 1,000-10,000 times longer to train the ANN, compared to backpropagation. We do not observe a clear pattern of rising CPU cost with the increased size of the data set. This can be explained, on one hand, by a smaller number of iterations of the optimisation algorithm for larger data, as the objective becomes less rough, and by the use of GPU to offload calculation of the residuals. We have used 448 cores for these calculations, and for 5000 data GPU calculations did not reach the saturation point. While as expected, PCLTS takes much longer, this time is compensated by the quality of the result. On the other hand, the CPU appears not to be excessive.
Tables 11–14 contain RMSE and CPU time for the real world data sets we considered. Again, we observe that standard backpropagation breaks down, while our method based on PCLTS objective provides a very good fit, comparable to backpropagation in the absence of outliers. CPU times are consistent with those reached in the examples with artificial data sets.
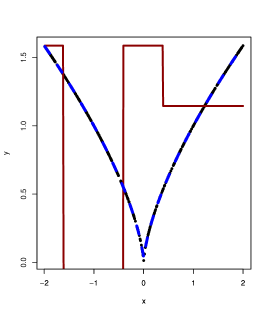
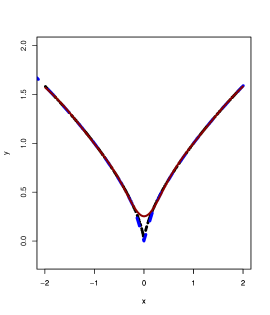
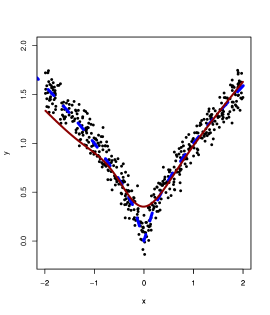
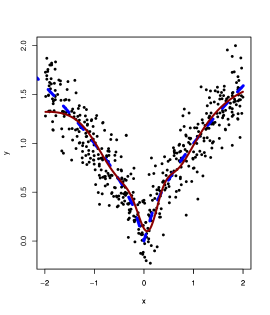
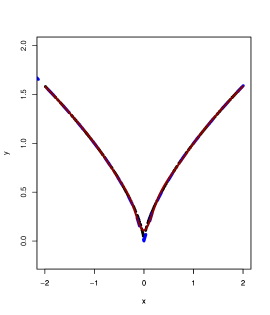
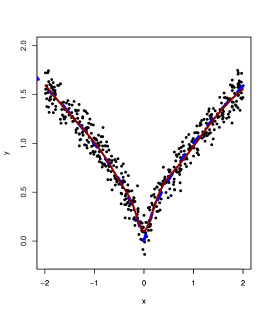
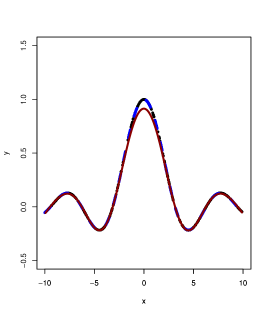
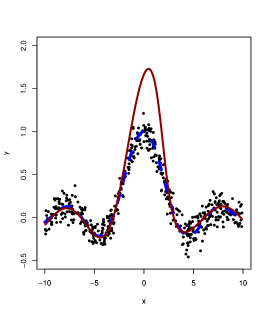
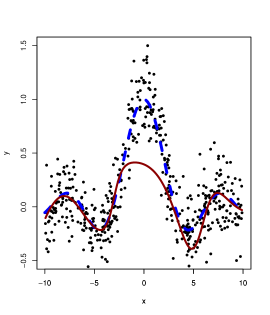
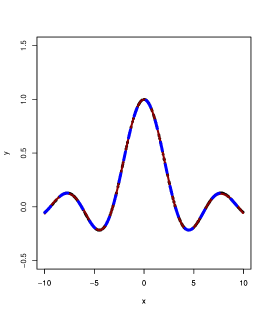
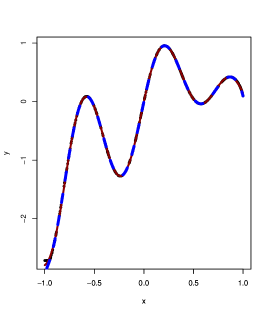
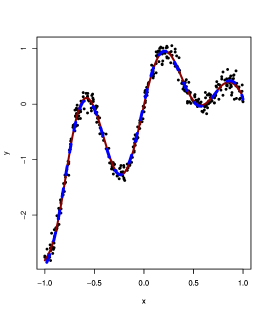
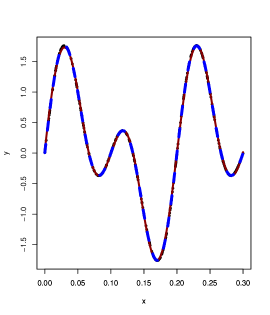
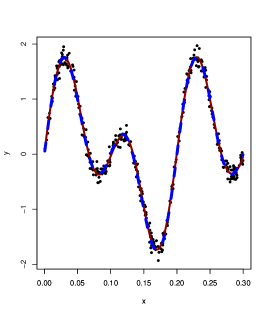
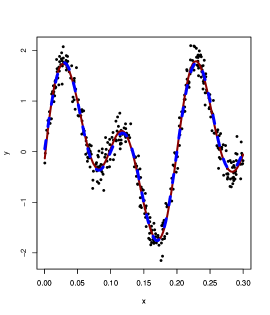
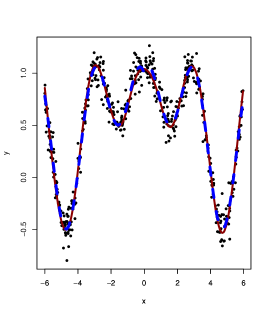
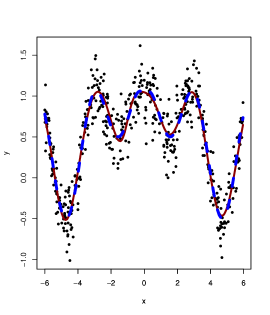
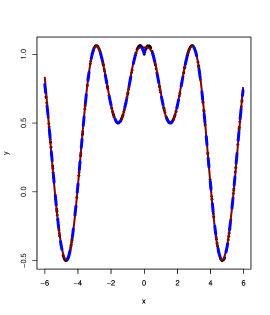
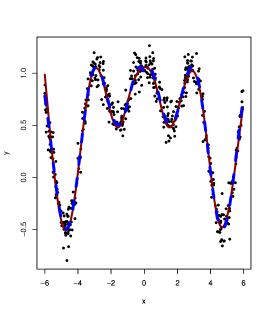
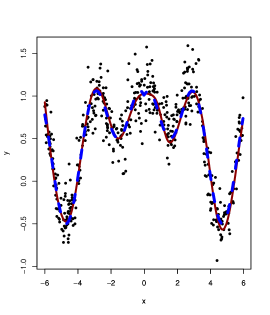
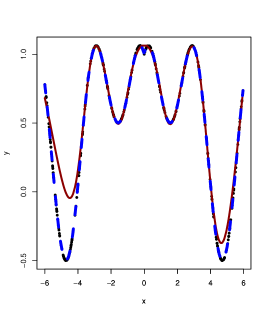
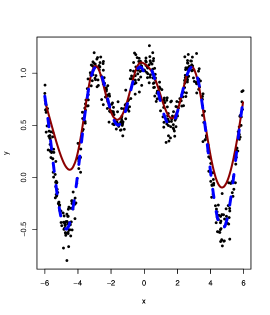
Let us now look at the figures. As we mentioned, Figures 2 illustrate the inability of the standard ANNs to predict the correct model, and the ability of the robust training based on LTS and PCLTS to remove the outliers. Figures 3 and 5 (see also Figures 11 and12) illustrate the difference between the LTS and PCLTS criteria. Note that using LTS (top row), the cusp of the graph of the model function near the origin is lost. The reason is that LTS criterion treated the data near the cusp as outliers. This is of course undesirable. The modified criterion PCLTS (bottom row) gave a much better (in fact, nearly perfect) prediction. Hence PCLTS achieved its aim to block unnecessary removal of data, by imposing a penalty for every removal. In Figures 11,12 the same effect is visible at both ends of the domain of the data. Thus we conclude that the addition of the penalty term in PCLTS criterion was justified.
As far as the optimisation methods are concerned, we noticed that the method DSO reliably detected the outliers, and its CPU was significantly smaller than that of the other two methods. CPU of random start with NEWUOA was on average six times higher, and CPU of random start with DFBM was twelve to fifteen times higher than that of DSO. On a few occasions random start with NEWUOA or DFBM have failed to deliver a model that identified the outliers correctly. Therefore we concluded that for our objective, DSO was the most suitable method among the alternatives we studied, and we concentrated on studying this method in greater detail. The tables in the Appendix give CPU and RMSE for the DSO method.
6 Conclusion
In this paper we investigated robust training of ANNs and detection of outliers in the data from two perspectives. First, we illustrated the inability of the classical least squares criterion to produce regression models not sensitive to outliers in the data. We investigated the use of the least trimmed criterion and found that it delivered robust regression models. We benchmarked various derivative free optimisation algorithms for optimising the LTS criterion and found that the method based on dynamical systems optimisation (DSO) was superior to several alternative methods. A contributing factor here is relatively large number of variables, which ranged from ten to one hundred. We produced a hybrid algorithm, combining detection of outliers by optimising the LTS criterion, their removal and subsequent fine tuning of the ANN by backpropagation.
Second, we investigated an undesirable feature of the LTS criterion, unjustified removal of valid data, and subsequent loss of accuracy. We introduced a new criterion, called Penalised CLTS, which imposes a penalty for removing the data. By optimising PCLTS criterion, we achieved a high degree of accuracy of the resulting regression model. Our method pinpoints and filters out the outliers reliably, and its computational cost is reasonable.
References
- [1] A. Bagirov. A method for minimization of quasidifferentiable functions. Optimization Methods and Software, 17:31–60, 2002.
- [2] G. Beliakov. Parallel calculation of the median and order statistics on GPUs with application to robust regression. Technical report, arxiv :1104.2732, 2011.
- [3] G. Beliakov and A. Kelarev. Global non-smooth optimization in robust multivariate regression. Optimization Methods and Software, page to appear, 2012.
- [4] G. Beliakov and J. Ugon. Implementation of novel methods of global and non-smooth optimization: GANSO programming library. Optimization, 56:543–546, 2007.
- [5] T. Bernholt. Robust estimators are hard to compute. Technical Report http://www.statistik.tu-dortmund.de/fileadmin/user_upload/ Lehrstuehle/MSind/SFB_475/2005/tr52-05.pdf, University of Dortmund, 2005.
- [6] D. Cederman and P. Tsigas. GPU-Quicksort: A practical quicksort algorithm for graphics processors. ACM Journal of Experimental Algorithmics, 14:1.4.1–1.4.24, 2009.
- [7] A. Cerioli. Multivariate outlier detection with high-breakdown estimators. Journal of the American Statistical Association, 105:147–156, 2010.
- [8] D.S. Chen and R.C. Jain. A robust back-propagation learning algorithm for function approximation. IEEE Trans. Neural Networks, 5:467–479, 1994.
- [9] C.-C. Chuang, J.-T. Jeng, and P.-T. Lin. Annealing robust radial basis function networks for function approximation with outliers. Neurocomputing, 56:123–139, 2004.
- [10] C.C. Chuang, S.F. Su, and C.C. Hsiao. The annealing robust backpropagation (ARBP) learning algorithm. IEEE Trans. Neural Networks, 11:1067–1077, 2000.
- [11] C.C. Chuong and J.T. Jeng. CPBUM neural network for modeling with outliers and noise. Applied Soft Computing, 7:957–967, 2007.
- [12] M. El-Melegy, M. Essai, and A. Ali. Robust training of artificial feedforward neural networks. In A. Hassanien, A. Abraham, A. Vasilakos, and W. Pedrycz, editors, Foundations of Computational Intelligence, volume 201 of Studies in Computational Intelligence, pages 217–242. Springer Berlin / Heidelberg, 2009.
- [13] D. Gervini and V.J. Yohai. A class of robust and fully efficient regression estimators. Ann. Statist., 30:583–616, 2002.
- [14] A.S. Hadi and A. Luceño. Maximum trimmed likelihood estimators: a unified approach, examples, and algorithms. Computational Statistics and Data Analysis, 25:251–272, 1997.
- [15] M.T. Hagan and M.B. Menhaj. Training feedforward networks with the Marquardt algorithm. IEEE Trans. on Neural Networks, 5:989–993, 1994.
- [16] F.R. Hampel. A general qualitative definition of robustness. Annals of Math. Statistics, 42:1887–1896, 1971.
- [17] D.M. Hawkins and D.J. Olive. Applications and algorithms for least trimmed sum of absolute deviations regression. Computational Statistics and Data Analysis, 32:119–134, 1999.
- [18] J. Hoberock and N. Bell. Thrust: A parallel template library, http://www.meganewtons.com/, 2010.
- [19] K. Hornik, M. Stinchcombe, and H. White. Multilayer feedforward networks are universal approximators. Neural Networks, 2:359–366, 1989.
- [20] P.J. Huber. Robust Statistics. Wiley, New York, 2003.
- [21] C. Igel and M. Hüsken. Empirical evaluation of the improved Rprop learning algorithms. Neurocomputing, 50:105–123, 2003.
- [22] J. Ilonen, J.-K. Kamarainen, and J. Lampinen. Differential evolution training algorithm for Feed-Forward Neural Networks. Neural Processing Letters, 17:93–105, 2003.
- [23] J.-T. Jeng, C-T. Chuang, and C.-C. Chuang. Least trimmed squares based CPBUM neural networks. In International Conference on System Science and Engineering, pages 187–192. IEEE, 2011.
- [24] J.T. Jeng and T.T. Lee. Control of magnetic bearing systems via the Chebyshev polunomial-based unified model (CPBUM) neural network. IEEE Trans. Man Cybernetics, Part B: Cybernet., 30:85–92, 2000.
- [25] C.-C. Lee, P.-C. Chung, J.-R. Tsai, and C.-I. Chang. Robust radial basis function neural networks. IEEE Trans. Systems, Man, Cybernetics. Part B: Cybernetics, 29:674–685, 1999.
- [26] K. Liano. Robust error measure for supervised neural network learning with outliers. IEEE Trans. on Neural Networks, 7:246–250, 1996.
- [27] M.M. Makela and P. Neittaanmaki. Nonsmooth Optimization: Analysis and Algorithms With Applications to Optimal Control. World Scientific, River Edge, NJ, 1992.
- [28] M. Mammadov, A. Rubinov, and J. Yearwood. The study of drug-reaction relationships using global optimization techniques. Optimization Methods and Software, 22:99–126, 2007.
- [29] M.A. Mammadov, A. Rubinov, and J. Yearwood. Dynamical systems described by relational elasticities with applications to global optimization. In A. Rubinov and V. Jeyakumar, editors, Continuous Optimisation: Current Trends and Modern Applications, pages 365–385. Springer, New York, 2005.
- [30] R. Maronna, R. Martin, and V. Yohai. Robust Statistics: Theory and Methods. Wiley, New York, 2006.
- [31] T. Masters. Advanced algorithms for neural networks: a C++ sourcebook. Wiley, New York, 1995.
- [32] J.J Moré and S.M. Wild. Benchmarking derivative-free optimization algorithms. SIAM J. Optim., 20:172–191, 2009.
- [33] J. A. Nelder and R. Mead. A simplex method for function minimization. Computer Journal, 7:308–313, 1965.
- [34] T.D. Nguyen and R. Welsch. Outlier detection and least trimmed squares approximation using semi-definite programming. Computational Statistics and Data Analysis, 12:3212–3226, 2010.
- [35] R. Nunkesser and O. Morell. An evolutionary algorithm for robust regression. Computational Statistics and Data Analysis, 54:3242–3248, 2010.
- [36] NVIDIA. http://developer.nvidia.com/object/cuda_4_0_rc_downloads.html, accessed 20 March, 2011.
- [37] NVIDIA. Tesla datasheet, http://www.nvidia.com/docs/io/43395/ nv_ds_tesla_psc_us_nov08_lowres.pdf, accessed 1 December, 2010, accessed 1 July 2011.
- [38] NVIDIA. http://developer.download.nvidia.com/compute/cuda/1_1/website/data-parallel_algorithms.html, accessed 1 june, 2010, accessed 1 June 2011.
- [39] Y.C. Pati and P.S. Krishnaprasad. Analysis and synthesis of feedforward neural networks using discrete affine wavelet transformations. IEEE Trans. Neural Networks, 4:72–85, 1993.
- [40] M.J.D. Powell. The NEWUOA software for unconstrained optimization without derivatives. In Large-Scale Nonlinear Optimization, Nonconvex Optimization and Its Applications, pages 255–297. Springer US, 2006.
- [41] L. Prechelt. PROBEN 1 - a set of benchmarks and benchmarking rules for neural network training algorithms. Technical report, Technical Report 21/94, Universität Karlsruhe, D-76128 Jarlsruhem Germany, September 1994, http://digbib.ubka.uni-karlsruhe.de/eva/ira/1994/21, 1994.
- [42] L. Prechelt. Automatic early stopping using cross validation: quantifying the criteria. Neural Networks, 11:761–767, 1998.
- [43] L. Prechelt. PROBEN 1 – a standardized benchmark collection for neural network algorithms, 1994, available from ftp://ftp.ira.uka.de/pub/neuron/proben1.tar.gz, 2010.
- [44] A.H. Press, S.A. Teukolsky, W.T. Vetterling, and B.P. Flannery. Numerical Recipes in C: The Art of Scientific Computing. Cambridge University Press, New York, 2002.
- [45] R software. http://www.r-project.org/, 2012.
- [46] P.J. Rousseeuw. Least median of squares regression. J. Amer. Statist. Assoc, 79:871–880, 1984.
- [47] P.J. Rousseeuw and A.M. Leroy. Robust Regression and Outlier Detection. Wiley, New York, 2003.
- [48] P.J. Rousseeuw and K. Van Driessen. Computing LTS regression for large data sets. Data Mining and Knowledge Discovery, 12:29–45, 2006.
- [49] A. Rusiecki. Robust LTS backpropagation learning algorithm. In F. Sandoval, A. Prieto, J. Cabestany, and M. Graã a, editors, Computational and Ambient Intelligence, volume 4507 of Lecture Notes in Computer Science, pages 102–109. Springer Berlin / Heidelberg, 2007.
- [50] A. Rusiecki. Robust MCD-based backpropagation learning algorithm. In L. Rutkowski, R. Tadeusiewicz, L. Zadeh, and J. Zurada, editors, Artificial Intelligence and Soft Computing, ICAISC 2008, volume 5097 of Lecture Notes in Computer Science, pages 154–163. Springer Berlin / Heidelberg, 2008.
- [51] M. Schyns, G. Haesbroeck, and F. Critchley. RelaxMCD: Smooth optimisation for the minimum covariance determinant estimator. Comput. Stat. Data Anal., 54:843–857, 2010.
- [52] S. Sengupta, M. Harris, Y. Zhang, and J. D. Owens. Scan primitives for GPU computing. Graphics Hardware, pages 97–106, 2007.
- [53] H.-L. Shieh, Y.-K. Yang, P.-L. Chang, and J.-T. Jeng. Robust neural-fuzzy method for function approximation. Expert Systems with Applications, 36:6903–6913, 2009.
- [54] E. Sintorn and U. Assarsson. Fast parallel GPU-sorting using a hybrid algorithm. J. of Parallel and Distributed Computing, 68:1381–1388, 2008.
- [55] A.J. Smola and B. Schölkopf. From regularzation operators to support vector kernels. Neural Inf. Process. Syst., 10:343–349, 1998.
- [56] A.J. Stromberg, O. Hossjer, and D.M. Hawkins. The least trimmed differences regression estimator and alternatives. J. Amer. Statist. Assoc, 95:853–864, 2000.
- [57] A.J. Stromberg and D. Ruppert. Breakdown in nonlinear regression. J. of the American Statistical Association, 87:991–997, 1992.
- [58] D. Tomandl and A. Schober. A Modified General Regression Neural Network (MGRNN) with new, efficient training algorithms as a robust black box-tool for data analysis. Neural Networks, 14:1023–1034, 2001.
- [59] M. Zukerman, M. Mammadov, L. Tan, I. Ouveysi, and Lachlan A.L. To be fair or efficient or a bit of both. Computers and Operations Research, 35:3787–3806, 2008.
Appendix
| Input | Proportion | Size of the | Noise level =0 | Noise level=0.1 | Noise level=0.2 | |||
|---|---|---|---|---|---|---|---|---|
| dimension | of outliers | data set | pclts | nnet | pclts | nnet | pclts | nnet |
| 1 | 0 | 100 | 0.021 | 0.020 | 0.035 | 0.035 | 0.071 | 0.071 |
| 1 | 0 | 500 | 0.011 | 0.011 | 0.016 | 0.016 | 0.042 | 0.042 |
| 1 | 0 | 5000 | 0.006 | 0.006 | 0.008 | 0.008 | 0.010 | 0.009 |
| 1 | 0.2 | 100 | 0.013 | 1109.050 | 0.035 | 2151.400 | 0.076 | 2221.849 |
| 1 | 0.2 | 500 | 0.012 | 1626.452 | 0.018 | 1447.013 | 0.044 | 1018.946 |
| 1 | 0.2 | 5000 | 0.007 | 1020.319 | 0.419 | 1742.355 | 0.014 | 1545.335 |
| 1 | 0.4 | 100 | 0.027 | 3246.146 | 0.067 | 3041.953 | 0.110 | 2585.175 |
| 1 | 0.4 | 500 | 0.013 | 2937.150 | 0.022 | 2982.020 | 0.028 | 2406.259 |
| 1 | 0.4 | 5000 | 0.007 | 1203.257 | 0.013 | 2622.065 | 0.015 | 1243.061 |
| 1 | 0.5 | 100 | 0.029 | 4843.302 | 0.073 | 2844.756 | 0.102 | 4410.803 |
| 1 | 0.5 | 500 | 0.015 | 3671.261 | 0.029 | 2880.355 | 0.044 | 1776.429 |
| 1 | 0.5 | 5000 | 0.008 | 4831.715 | 0.009 | 3736.112 | 0.017 | 3299.489 |
| 2 | 0 | 100 | 0.024 | 0.024 | 0.136 | 0.139 | 0.208 | 0.234 |
| 2 | 0 | 500 | 0.020 | 0.019 | 0.036 | 0.040 | 0.072 | 0.067 |
| 2 | 0 | 5000 | 0.019 | 0.019 | 0.023 | 0.026 | 0.028 | 0.029 |
| 2 | 0.2 | 100 | 0.023 | 2992.371 | 0.109 | 3760.125 | 0.270 | 2715.137 |
| 2 | 0.2 | 500 | 0.025 | 1474.736 | 0.046 | 1845.146 | 0.080 | 2013.107 |
| 2 | 0.2 | 5000 | 0.021 | 1785.524 | 0.024 | 2207.706 | 0.032 | 1555.451 |
| 2 | 0.4 | 100 | 0.029 | 4212.044 | 0.086 | 3437.521 | 0.240 | 5209.511 |
| 2 | 0.4 | 500 | 0.029 | 1983.814 | 0.042 | 3162.076 | 0.094 | 2498.807 |
| 2 | 0.4 | 5000 | 0.018 | 3016.362 | 0.024 | 2795.595 | 0.037 | 2039.607 |
| 2 | 0.5 | 100 | 0.047 | 3479.871 | 0.272 | 4305.459 | 0.215 | 4167.711 |
| 2 | 0.5 | 500 | 0.025 | 3865.850 | 0.054 | 2350.706 | 0.092 | 2995.097 |
| 2 | 0.5 | 5000 | 0.018 | 2628.596 | 0.025 | 2670.277 | 0.034 | 3380.372 |
| 3 | 0 | 100 | 0.070 | 0.095 | 0.171 | 0.133 | 0.284 | 0.269 |
| 3 | 0 | 500 | 0.027 | 0.026 | 0.052 | 0.051 | 0.073 | 0.078 |
| 3 | 0 | 5000 | 0.024 | 0.035 | 0.031 | 0.028 | 0.037 | 0.036 |
| 3 | 0.2 | 100 | 0.063 | 3424.539 | 0.163 | 3456.296 | 0.461 | 2754.772 |
| 3 | 0.2 | 500 | 0.025 | 1876.883 | 0.055 | 2126.971 | 0.101 | 2288.269 |
| 3 | 0.2 | 5000 | 0.024 | 437.679 | 0.027 | 2458.412 | 0.048 | 913.914 |
| 3 | 0.4 | 100 | 0.096 | 3626.761 | 0.278 | 3593.988 | 0.437 | 4328.172 |
| 3 | 0.4 | 500 | 0.026 | 3051.583 | 0.060 | 2778.413 | 0.123 | 3218.664 |
| 3 | 0.4 | 5000 | 0.026 | 1952.740 | 0.039 | 2583.106 | 0.046 | 3696.025 |
| 3 | 0.5 | 100 | 0.127 | 3307.094 | 0.382 | 3786.831 | 0.591 | 3711.280 |
| 3 | 0.5 | 500 | 0.037 | 3240.812 | 0.061 | 2787.930 | 0.125 | 3445.775 |
| 3 | 0.5 | 5000 | 0.029 | 3042.017 | 0.034 | 2916.196 | 0.048 | 1602.479 |
| 5 | 0 | 100 | 0.081 | 0.078 | 0.260 | 0.147 | 0.499 | 0.401 |
| 5 | 0 | 500 | 0.057 | 0.052 | 0.079 | 0.080 | 0.110 | 0.119 |
| 5 | 0 | 5000 | 0.041 | 0.041 | 0.045 | 0.043 | 0.051 | 0.050 |
| 5 | 0.2 | 100 | 0.094 | 3891.054 | 0.308 | 3232.645 | 0.469 | 3732.648 |
| 5 | 0.2 | 500 | 0.050 | 2265.408 | 0.092 | 2270.477 | 0.150 | 2258.718 |
| 5 | 0.2 | 5000 | 0.040 | 1692.358 | 0.043 | 307.011 | 0.057 | 2128.485 |
| 5 | 0.4 | 100 | 0.171 | 3787.225 | 0.294 | 4359.977 | 0.534 | 3681.744 |
| 5 | 0.4 | 500 | 0.054 | 2397.568 | 0.096 | 1838.333 | 0.155 | 2902.272 |
| 5 | 0.4 | 5000 | 0.040 | 1614.782 | 0.046 | 1545.807 | 0.273 | 1990.707 |
| 5 | 0.5 | 100 | 0.280 | 4795.451 | 0.275 | 3706.393 | 0.421 | 4067.282 |
| 5 | 0.5 | 500 | 0.069 | 2573.188 | 0.098 | 2675.592 | 0.179 | 2648.058 |
| 5 | 0.5 | 5000 | 0.042 | 2844.733 | 0.046 | 2809.447 | 0.063 | 2857.316 |
| 10 | 0 | 100 | 0.306 | 0.299 | 0.270 | 0.314 | 0.329 | 0.361 |
| 10 | 0 | 500 | 0.159 | 0.115 | 0.254 | 0.178 | 0.296 | 0.290 |
| 10 | 0 | 5000 | 0.109 | 0.108 | 0.132 | 0.135 | 0.137 | 0.121 |
| 10 | 0.2 | 100 | 0.277 | 3236.948 | 0.315 | 4121.937 | 0.326 | 2894.181 |
| 10 | 0.2 | 500 | 0.113 | 1617.721 | 0.184 | 1895.575 | 0.278 | 2504.313 |
| 10 | 0.2 | 5000 | 0.231 | 1265.473 | 0.084 | 1572.269 | 0.231 | 1780.300 |
| 10 | 0.4 | 100 | 0.289 | 4101.092 | 0.308 | 4113.396 | 0.382 | 4037.487 |
| 10 | 0.4 | 500 | 0.260 | 1507.686 | 0.251 | 1854.632 | 0.345 | 2078.722 |
| 10 | 0.4 | 5000 | 0.082 | 1918.855 | 0.231 | 1971.229 | 0.231 | 2159.798 |
| 10 | 0.5 | 100 | 0.290 | 4977.258 | 0.264 | 3979.261 | 0.352 | 3930.745 |
| 10 | 0.5 | 500 | 0.274 | 3068.391 | 0.296 | 3154.727 | 0.427 | 2949.967 |
| 10 | 0.5 | 5000 | 0.135 | 1899.810 | 0.116 | 2224.139 | 0.127 | 1190.993 |
| Input | Proportion | Size of the | Noise level =0 | Noise level=0.1 | Noise level=0.2 | |||
|---|---|---|---|---|---|---|---|---|
| dimension | of outliers | data set | pclts | nnet | pclts | nnet | pclts | nnet |
| 1 | 0 | 100 | 0.013 | 0.012 | 0.048 | 0.034 | 0.061 | 0.061 |
| 1 | 0 | 500 | 0.001 | 0.002 | 0.016 | 0.014 | 0.030 | 0.030 |
| 1 | 0 | 5000 | 0.000 | 0.000 | 0.005 | 0.005 | 0.011 | 0.010 |
| 1 | 0.2 | 100 | 0.010 | 2148.754 | 0.033 | 2.417 | 0.080 | 2400.194 |
| 1 | 0.2 | 500 | 0.001 | 2602.706 | 0.020 | 2604.085 | 0.031 | 2276.562 |
| 1 | 0.2 | 5000 | 0.000 | 2334.587 | 0.006 | 2887.469 | 0.013 | 2337.995 |
| 1 | 0.4 | 100 | 0.011 | 2596.561 | 0.042 | 1599.617 | 0.123 | 2828.158 |
| 1 | 0.4 | 500 | 0.001 | 3578.435 | 0.005 | 2605.814 | 0.042 | 2673.687 |
| 1 | 0.4 | 5000 | 0.000 | 2687.385 | 0.005 | 2832.465 | 0.007 | 2847.874 |
| 1 | 0.5 | 100 | 0.011 | 5176.776 | 0.049 | 2482.051 | 0.166 | 4171.906 |
| 1 | 0.5 | 500 | 0.001 | 2380.363 | 0.029 | 2499.944 | 0.033 | 4288.795 |
| 1 | 0.5 | 5000 | 0.000 | 3951.128 | 0.006 | 3039.429 | 0.017 | 2806.767 |
| 2 | 0 | 100 | 0.009 | 0.009 | 0.069 | 0.059 | 0.253 | 0.134 |
| 2 | 0 | 500 | 0.006 | 0.006 | 0.035 | 0.033 | 0.060 | 0.062 |
| 2 | 0 | 5000 | 0.005 | 0.003 | 0.011 | 0.011 | 0.018 | 0.020 |
| 2 | 0.2 | 100 | 0.011 | 2668.408 | 0.129 | 3288.958 | 0.241 | 2467.441 |
| 2 | 0.2 | 500 | 0.005 | 1914.969 | 0.034 | 1589.997 | 0.071 | 2400.486 |
| 2 | 0.2 | 5000 | 0.007 | 2234.668 | 0.010 | 2160.805 | 0.019 | 1422.155 |
| 2 | 0.4 | 100 | 0.040 | 2864.933 | 0.262 | 3479.801 | 0.280 | 4933.606 |
| 2 | 0.4 | 500 | 0.006 | 3074.300 | 0.033 | 2467.063 | 0.081 | 2423.949 |
| 2 | 0.4 | 5000 | 0.005 | 3090.935 | 0.013 | 2469.559 | 0.026 | 1853.020 |
| 2 | 0.5 | 100 | 0.069 | 7185.250 | 0.154 | 2.134 | 0.360 | 5569.739 |
| 2 | 0.5 | 500 | 0.007 | 4942.917 | 0.041 | 2364.485 | 0.113 | 4999.988 |
| 2 | 0.5 | 5000 | 0.004 | 2479.056 | 0.015 | 3596.367 | 0.031 | 3080.130 |
| 3 | 0 | 100 | 0.044 | 0.037 | 0.227 | 0.098 | 0.268 | 0.226 |
| 3 | 0 | 500 | 0.031 | 0.032 | 0.056 | 0.047 | 0.104 | 0.083 |
| 3 | 0 | 5000 | 0.023 | 0.028 | 0.029 | 0.027 | 0.037 | 0.030 |
| 3 | 0.2 | 100 | 0.063 | 2626.567 | 0.177 | 1834.107 | 0.309 | 3995.105 |
| 3 | 0.2 | 500 | 0.033 | 1661.228 | 0.060 | 1446.461 | 0.141 | 2012.120 |
| 3 | 0.2 | 5000 | 0.024 | 1703.977 | 0.027 | 1352.354 | 0.040 | 1199.587 |
| 3 | 0.4 | 100 | 0.084 | 3809.952 | 0.199 | 2427.211 | 0.343 | 3210.537 |
| 3 | 0.4 | 500 | 0.031 | 2513.025 | 0.068 | 3769.689 | 0.116 | 3696.497 |
| 3 | 0.4 | 5000 | 0.027 | 1294.315 | 0.031 | 1629.493 | 0.041 | 2063.066 |
| 3 | 0.5 | 100 | 0.177 | 4845.271 | 0.365 | 3040.607 | 0.654 | 3017.996 |
| 3 | 0.5 | 500 | 0.034 | 2605.272 | 0.083 | 1065.010 | 0.132 | 1689.498 |
| 3 | 0.5 | 5000 | 0.030 | 2077.777 | 0.031 | 1191.266 | 0.045 | 3005.893 |
| 5 | 0 | 100 | 0.031 | 0.030 | 0.205 | 0.085 | 0.305 | 0.354 |
| 5 | 0 | 500 | 0.018 | 0.018 | 0.060 | 0.054 | 0.118 | 0.125 |
| 5 | 0 | 5000 | 0.018 | 0.019 | 0.025 | 0.025 | 0.038 | 0.040 |
| 5 | 0.2 | 100 | 0.064 | 3564.496 | 0.212 | 1673.425 | 0.567 | 2573.004 |
| 5 | 0.2 | 500 | 0.026 | 1820.677 | 0.072 | 2316.268 | 0.122 | 2358.980 |
| 5 | 0.2 | 5000 | 0.019 | 1929.773 | 0.029 | 955.324 | 0.042 | 1275.134 |
| 5 | 0.4 | 100 | 0.029 | 4086.133 | 0.243 | 2086.533 | 0.718 | 3580.618 |
| 5 | 0.4 | 500 | 0.025 | 2382.771 | 0.075 | 1338.828 | 0.173 | 3114.589 |
| 5 | 0.4 | 5000 | 0.020 | 2748.883 | 0.033 | 770.710 | 0.052 | 1182.186 |
| 5 | 0.5 | 100 | 0.086 | 3790.846 | 0.293 | 1010.225 | 0.369 | 4958.779 |
| 5 | 0.5 | 500 | 0.027 | 2907.051 | 0.077 | 1990.227 | 0.196 | 3573.141 |
| 5 | 0.5 | 5000 | 0.019 | 2045.978 | 0.031 | 1345.384 | 0.056 | 2574.422 |
| 10 | 0 | 100 | 0.001 | 0.000 | 0.179 | 0.096 | 0.341 | 0.314 |
| 10 | 0 | 500 | 0.002 | 0.002 | 0.072 | 0.065 | 0.178 | 0.163 |
| 10 | 0 | 5000 | 0.001 | 0.001 | 0.025 | 0.025 | 0.057 | 0.056 |
| 10 | 0.2 | 100 | 0.001 | 3768.071 | 0.124 | 1333.593 | 0.235 | 3366.499 |
| 10 | 0.2 | 500 | 0.001 | 1593.702 | 0.097 | 1391.395 | 0.197 | 1733.066 |
| 10 | 0.2 | 5000 | 0.002 | 1023.063 | 0.027 | 468.724 | 0.062 | 1024.444 |
| 10 | 0.4 | 100 | 0.001 | 5155.331 | 0.151 | 1383.604 | 0.258 | 4460.762 |
| 10 | 0.4 | 500 | 0.002 | 2485.255 | 0.121 | 957.925 | 0.252 | 1898.246 |
| 10 | 0.4 | 5000 | 0.001 | 1958.776 | 0.034 | 1480.955 | 0.067 | 2200.060 |
| 10 | 0.5 | 100 | 0.001 | 4896.077 | 0.108 | 1447.494 | 0.247 | 4022.098 |
| 10 | 0.5 | 500 | 0.001 | 2489.607 | 0.133 | 748.545 | 0.235 | 2685.403 |
| 10 | 0.5 | 5000 | 0.001 | 1657.014 | 0.037 | 1481.272 | 0.069 | 1545.069 |
| Input | Proportion | Size of the | Noise level =0 | Noise level=0.1 | Noise level=0.2 | |||
|---|---|---|---|---|---|---|---|---|
| dimension | of outliers | data set | pclts | nnet | pclts | nnet | pclts | nnet |
| 1 | 0 | 100 | 0.004 | 0.004 | 0.024 | 0.024 | 0.087 | 0.087 |
| 1 | 0 | 500 | 0.002 | 0.002 | 0.019 | 0.021 | 0.041 | 0.042 |
| 1 | 0 | 5000 | 0.002 | 0.002 | 0.007 | 0.007 | 0.011 | 0.011 |
| 1 | 0.2 | 100 | 0.005 | 2350.122 | 0.049 | 2621.706 | 0.147 | 3816.212 |
| 1 | 0.2 | 500 | 0.003 | 2331.880 | 0.019 | 2326.221 | 0.044 | 1604.963 |
| 1 | 0.2 | 5000 | 0.002 | 2341.197 | 0.007 | 1742.731 | 0.012 | 1800.171 |
| 1 | 0.4 | 100 | 0.005 | 3597.764 | 0.037 | 3944.581 | 0.128 | 4194.846 |
| 1 | 0.4 | 500 | 0.003 | 4163.724 | 0.021 | 2782.759 | 0.074 | 3177.079 |
| 1 | 0.4 | 5000 | 0.002 | 3098.375 | 0.007 | 3013.109 | 0.014 | 2580.344 |
| 1 | 0.5 | 100 | 0.006 | 3529.499 | 0.057 | 4373.620 | 0.105 | 4765.754 |
| 1 | 0.5 | 500 | 0.003 | 4624.554 | 0.020 | 4061.011 | 0.043 | 3433.221 |
| 1 | 0.5 | 5000 | 0.002 | 3929.220 | 0.007 | 3459.508 | 0.022 | 2633.235 |
| 2 | 0 | 100 | 0.213 | 0.235 | 0.194 | 0.192 | 0.306 | 0.299 |
| 2 | 0 | 500 | 0.113 | 0.124 | 0.137 | 0.111 | 0.155 | 0.156 |
| 2 | 0 | 5000 | 0.137 | 0.120 | 0.125 | 0.106 | 0.116 | 0.126 |
| 2 | 0.2 | 100 | 0.153 | 2228.151 | 0.182 | 2832.608 | 0.251 | 2789.265 |
| 2 | 0.2 | 500 | 0.129 | 2642.140 | 0.121 | 2600.507 | 0.149 | 2240.002 |
| 2 | 0.2 | 5000 | 0.101 | 1893.284 | 0.104 | 1739.531 | 0.103 | 1105.706 |
| 2 | 0.4 | 100 | 0.242 | 4119.934 | 0.153 | 2703.814 | 0.526 | 2607.311 |
| 2 | 0.4 | 500 | 0.104 | 3329.441 | 0.157 | 1819.683 | 0.147 | 3477.685 |
| 2 | 0.4 | 5000 | 0.124 | 1929.861 | 0.124 | 2637.915 | 0.124 | 2188.142 |
| 2 | 0.5 | 100 | 0.374 | 5241.557 | 0.586 | 4483.093 | 0.686 | 5173.547 |
| 2 | 0.5 | 500 | 0.121 | 4163.781 | 0.140 | 4309.859 | 0.248 | 3575.090 |
| 2 | 0.5 | 5000 | 0.102 | 3816.314 | 0.117 | 3355.438 | 0.123 | 3505.115 |
| 3 | 0 | 100 | 0.141 | 0.157 | 0.226 | 0.252 | 0.373 | 0.308 |
| 3 | 0 | 500 | 0.090 | 0.097 | 0.122 | 0.118 | 0.144 | 0.152 |
| 3 | 0 | 5000 | 0.097 | 0.098 | 0.097 | 0.096 | 0.101 | 0.100 |
| 3 | 0.2 | 100 | 0.165 | 2639.393 | 0.253 | 3277.018 | 0.278 | 3293.440 |
| 3 | 0.2 | 500 | 0.096 | 2203.427 | 0.118 | 2349.472 | 0.145 | 2490.728 |
| 3 | 0.2 | 5000 | 0.099 | 2014.125 | 0.096 | 1175.255 | 0.102 | 2337.995 |
| 3 | 0.4 | 100 | 0.191 | 3651.088 | 0.316 | 5745.046 | 0.890 | 5678.132 |
| 3 | 0.4 | 500 | 0.138 | 3493.979 | 0.136 | 4131.168 | 0.165 | 3744.782 |
| 3 | 0.4 | 5000 | 0.095 | 3160.637 | 0.103 | 2465.031 | 0.109 | 2335.938 |
| 3 | 0.5 | 100 | 0.249 | 4320.711 | 0.463 | 5487.510 | 0.393 | 4463.659 |
| 3 | 0.5 | 500 | 0.204 | 4163.605 | 0.155 | 3222.509 | 0.185 | 3841.434 |
| 3 | 0.5 | 5000 | 0.097 | 2823.495 | 0.099 | 2639.243 | 0.106 | 2852.204 |
| 5 | 0 | 100 | 0.170 | 0.190 | 0.199 | 0.253 | 0.283 | 0.374 |
| 5 | 0 | 500 | 0.071 | 0.067 | 0.096 | 0.094 | 0.136 | 0.129 |
| 5 | 0 | 5000 | 0.062 | 0.062 | 0.065 | 0.066 | 0.071 | 0.072 |
| 5 | 0.2 | 100 | 0.158 | 3729.847 | 0.188 | 4256.721 | 0.427 | 3468.235 |
| 5 | 0.2 | 500 | 0.076 | 2454.542 | 0.104 | 2685.809 | 0.163 | 2798.478 |
| 5 | 0.2 | 5000 | 0.063 | 2249.592 | 0.067 | 1812.338 | 0.076 | 2452.946 |
| 5 | 0.4 | 100 | 0.272 | 4857.011 | 0.271 | 4332.243 | 0.447 | 4287.117 |
| 5 | 0.4 | 500 | 0.079 | 3119.092 | 0.113 | 3492.228 | 0.215 | 3114.469 |
| 5 | 0.4 | 5000 | 0.063 | 2598.163 | 0.068 | 2194.720 | 0.078 | 2898.332 |
| 5 | 0.5 | 100 | 0.128 | 6815.194 | 0.197 | 5605.187 | 0.350 | 4941.879 |
| 5 | 0.5 | 500 | 0.076 | 3687.907 | 0.144 | 3850.660 | 0.190 | 3004.257 |
| 5 | 0.5 | 5000 | 0.065 | 2154.409 | 0.068 | 2644.636 | 0.082 | 2407.882 |
| 10 | 0 | 100 | 0.087 | 0.090 | 0.171 | 0.153 | 0.223 | 0.251 |
| 10 | 0 | 500 | 0.055 | 0.055 | 0.098 | 0.102 | 0.184 | 0.182 |
| 10 | 0 | 5000 | 0.042 | 0.042 | 0.049 | 0.051 | 0.066 | 0.069 |
| 10 | 0.2 | 100 | 0.067 | 3501.659 | 0.132 | 2868.290 | 0.253 | 4808.624 |
| 10 | 0.2 | 500 | 0.059 | 2483.304 | 0.106 | 2536.081 | 0.176 | 2663.667 |
| 10 | 0.2 | 5000 | 0.042 | 2165.896 | 0.052 | 2108.236 | 0.072 | 2317.155 |
| 10 | 0.4 | 100 | 0.072 | 4120.702 | 0.105 | 4050.738 | 0.180 | 4108.175 |
| 10 | 0.4 | 500 | 0.066 | 3529.293 | 0.111 | 3495.990 | 0.211 | 3028.767 |
| 10 | 0.4 | 5000 | 0.042 | 2087.143 | 0.056 | 2467.652 | 0.078 | 3474.176 |
| 10 | 0.5 | 100 | 0.074 | 4311.713 | 0.123 | 5123.136 | 0.194 | 5716.768 |
| 10 | 0.5 | 500 | 0.070 | 3970.424 | 0.144 | 4147.082 | 0.216 | 3956.990 |
| 10 | 0.5 | 5000 | 0.043 | 3940.671 | 0.057 | 3887.353 | 0.091 | 3131.611 |
| Input | Proportion | Size of the | Noise level =0 | Noise level=0.1 | Noise level=0.2 | |||
|---|---|---|---|---|---|---|---|---|
| dimension | of outliers | data set | pclts | nnet | pclts | nnet | pclts | nnet |
| 1 | 0 | 100 | 0.018 | 0.018 | 0.039 | 0.039 | 0.051 | 0.051 |
| 1 | 0 | 500 | 0.009 | 0.010 | 0.021 | 0.020 | 0.040 | 0.043 |
| 1 | 0 | 5000 | 0.004 | 0.004 | 0.005 | 0.005 | 0.007 | 0.007 |
| 1 | 0.2 | 100 | 0.029 | 2536.255 | 0.051 | 2281.526 | 0.102 | 2113.818 |
| 1 | 0.2 | 500 | 0.011 | 2349.493 | 0.022 | 2460.206 | 0.023 | 2480.789 |
| 1 | 0.2 | 5000 | 0.005 | 2392.121 | 0.008 | 2311.305 | 0.015 | 2314.949 |
| 1 | 0.4 | 100 | 0.030 | 4239.727 | 0.064 | 4106.509 | 0.126 | 4000.216 |
| 1 | 0.4 | 500 | 0.018 | 3530.495 | 0.032 | 3052.685 | 0.044 | 3297.092 |
| 1 | 0.4 | 5000 | 0.006 | 3176.655 | 0.010 | 3735.902 | 0.014 | 3269.429 |
| 1 | 0.5 | 100 | 0.028 | 4263.198 | 0.054 | 5049.940 | 0.092 | 4746.733 |
| 1 | 0.5 | 500 | 0.016 | 2580.103 | 0.032 | 2569.031 | 0.042 | 2647.607 |
| 1 | 0.5 | 5000 | 0.006 | 3551.199 | 0.011 | 4125.981 | 0.012 | 4018.541 |
| 2 | 0 | 100 | 0.034 | 0.012 | 0.106 | 0.068 | 0.277 | 0.126 |
| 2 | 0 | 500 | 0.021 | 0.004 | 0.027 | 0.028 | 0.077 | 0.062 |
| 2 | 0 | 5000 | 0.007 | 0.004 | 0.020 | 0.009 | 0.050 | 0.015 |
| 2 | 0.2 | 100 | 0.026 | 2079.406 | 0.106 | 2766.112 | 0.305 | 1647.538 |
| 2 | 0.2 | 500 | 0.013 | 2392.766 | 0.036 | 2230.080 | 0.078 | 2035.472 |
| 2 | 0.2 | 5000 | 0.004 | 1516.034 | 0.011 | 2012.758 | 0.019 | 2222.601 |
| 2 | 0.4 | 100 | 0.217 | 3776.502 | 0.166 | 3623.230 | 0.218 | 3357.269 |
| 2 | 0.4 | 500 | 0.013 | 3487.636 | 0.038 | 3904.750 | 0.077 | 3819.065 |
| 2 | 0.4 | 5000 | 0.011 | 3875.903 | 0.013 | 3236.840 | 0.026 | 3041.187 |
| 2 | 0.5 | 100 | 0.032 | 4903.982 | 0.177 | 4857.142 | 0.392 | 4316.709 |
| 2 | 0.5 | 500 | 0.025 | 3163.898 | 0.042 | 4069.601 | 0.106 | 3667.355 |
| 2 | 0.5 | 5000 | 0.004 | 3237.522 | 0.011 | 2907.177 | 0.023 | 2974.508 |
| 3 | 0 | 100 | 0.342 | 0.010 | 0.374 | 0.104 | 0.352 | 0.326 |
| 3 | 0 | 500 | 0.090 | 0.010 | 0.122 | 0.044 | 0.113 | 0.065 |
| 3 | 0 | 5000 | 0.033 | 0.002 | 0.030 | 0.010 | 0.040 | 0.023 |
| 3 | 0.2 | 100 | 0.012 | 3067.202 | 0.114 | 3447.140 | 0.212 | 2831.374 |
| 3 | 0.2 | 500 | 0.009 | 2400.870 | 0.049 | 2364.360 | 0.101 | 2842.156 |
| 3 | 0.2 | 5000 | 0.001 | 1758.720 | 0.025 | 1789.520 | 0.031 | 955.202 |
| 3 | 0.4 | 100 | 0.068 | 3865.061 | 0.328 | 3973.309 | 0.586 | 4215.913 |
| 3 | 0.4 | 500 | 0.004 | 1357.572 | 0.048 | 2916.741 | 0.115 | 2578.019 |
| 3 | 0.4 | 5000 | 0.002 | 2789.135 | 0.020 | 2175.677 | 0.031 | 3921.980 |
| 3 | 0.5 | 100 | 0.135 | 4766.508 | 0.336 | 4434.943 | 0.673 | 5798.994 |
| 3 | 0.5 | 500 | 0.014 | 4538.512 | 0.051 | 2313.418 | 0.148 | 2139.502 |
| 3 | 0.5 | 5000 | 0.002 | 5000.027 | 0.017 | 3813.185 | 0.033 | 1967.654 |
| 5 | 0 | 100 | 0.012 | 0.012 | 0.194 | 0.219 | 0.540 | 0.376 |
| 5 | 0 | 500 | 0.046 | 0.020 | 0.091 | 0.075 | 0.131 | 0.115 |
| 5 | 0 | 5000 | 0.013 | 0.001 | 0.029 | 0.013 | 0.051 | 0.027 |
| 5 | 0.2 | 100 | 0.108 | 3277.295 | 0.267 | 2904.899 | 0.683 | 3171.092 |
| 5 | 0.2 | 500 | 0.021 | 2495.375 | 0.061 | 2276.714 | 0.176 | 2815.507 |
| 5 | 0.2 | 5000 | 0.001 | 1205.789 | 0.015 | 1280.940 | 0.032 | 1291.738 |
| 5 | 0.4 | 100 | 0.080 | 4332.911 | 0.374 | 4125.551 | 0.483 | 3805.763 |
| 5 | 0.4 | 500 | 0.014 | 2790.017 | 0.106 | 2868.925 | 0.208 | 2844.327 |
| 5 | 0.4 | 5000 | 0.002 | 3515.828 | 0.018 | 3309.866 | 0.037 | 3484.278 |
| 5 | 0.5 | 100 | 0.281 | 2816.417 | 0.382 | 4602.732 | 0.460 | 4259.719 |
| 5 | 0.5 | 500 | 0.015 | 2104.453 | 0.083 | 3811.765 | 0.191 | 3906.009 |
| 5 | 0.5 | 5000 | 0.003 | 2894.022 | 0.020 | 3040.731 | 0.045 | 4454.273 |
| 10 | 0 | 100 | 0.076 | 0.073 | 0.163 | 0.190 | 0.282 | 0.382 |
| 10 | 0 | 500 | 0.006 | 0.005 | 0.092 | 0.090 | 0.175 | 0.177 |
| 10 | 0 | 5000 | 0.008 | 0.002 | 0.064 | 0.021 | 0.062 | 0.045 |
| 10 | 0.2 | 100 | 0.096 | 2479.386 | 0.247 | 3074.441 | 0.333 | 2769.212 |
| 10 | 0.2 | 500 | 0.032 | 2149.944 | 0.111 | 2020.406 | 0.275 | 1628.117 |
| 10 | 0.2 | 5000 | 0.018 | 1188.203 | 0.050 | 1418.530 | 0.064 | 1124.796 |
| 10 | 0.4 | 100 | 0.142 | 4294.269 | 0.320 | 4584.641 | 0.380 | 5419.008 |
| 10 | 0.4 | 500 | 0.008 | 2687.737 | 0.128 | 2747.985 | 0.233 | 2280.057 |
| 10 | 0.4 | 5000 | 0.012 | 1435.511 | 0.032 | 1796.314 | 0.053 | 1084.804 |
| 10 | 0.5 | 100 | 0.131 | 5618.802 | 0.218 | 5878.293 | 0.352 | 3522.455 |
| 10 | 0.5 | 500 | 0.011 | 2305.005 | 0.146 | 1813.095 | 0.309 | 2832.694 |
| 10 | 0.5 | 5000 | 0.005 | 2462.356 | 0.034 | 1895.321 | 0.064 | 3647.127 |
| Input | Proportion | Size of the | Noise level =0 | Noise level=0.1 | Noise level=0.2 | |||
|---|---|---|---|---|---|---|---|---|
| dimension | of outliers | data set | pclts | nnet | pclts | nnet | pclts | nnet |
| 1 | 0 | 100 | 0.114 | 0.109 | 0.075 | 0.056 | 0.148 | 0.146 |
| 1 | 0 | 500 | 0.012 | 0.012 | 0.014 | 0.027 | 0.040 | 0.037 |
| 1 | 0 | 5000 | 0.007 | 0.007 | 0.008 | 0.012 | 0.011 | 0.011 |
| 1 | 0.2 | 100 | 0.129 | 2324.811 | 0.133 | 2504.451 | 0.178 | 1986.435 |
| 1 | 0.2 | 500 | 0.015 | 2376.646 | 0.027 | 2306.402 | 0.042 | 2510.584 |
| 1 | 0.2 | 5000 | 0.007 | 2139.114 | 0.008 | 2391.442 | 0.017 | 2139.109 |
| 1 | 0.4 | 100 | 0.152 | 3651.923 | 0.100 | 3999.753 | 0.768 | 3853.757 |
| 1 | 0.4 | 500 | 0.057 | 3999.893 | 0.026 | 3777.028 | 0.027 | 3850.540 |
| 1 | 0.4 | 5000 | 0.007 | 3924.929 | 0.014 | 3758.631 | 0.019 | 4042.885 |
| 1 | 0.5 | 100 | 0.990 | 4999.880 | 0.990 | 4940.837 | 0.159 | 4692.107 |
| 1 | 0.5 | 500 | 0.024 | 4800.461 | 0.020 | 4715.383 | 0.062 | 4999.829 |
| 1 | 0.5 | 5000 | 0.007 | 4394.916 | 0.014 | 4781.846 | 0.014 | 4444.855 |
| 2 | 0 | 100 | 0.512 | 0.545 | 0.503 | 0.461 | 0.546 | 0.492 |
| 2 | 0 | 500 | 0.382 | 0.273 | 0.271 | 0.313 | 0.482 | 0.272 |
| 2 | 0 | 5000 | 0.360 | 0.237 | 0.433 | 0.430 | 0.262 | 0.286 |
| 2 | 0.2 | 100 | 1.035 | 2550.246 | 0.867 | 3749.684 | 0.702 | 3782.985 |
| 2 | 0.2 | 500 | 0.278 | 2299.506 | 0.343 | 2517.519 | 0.274 | 2756.165 |
| 2 | 0.2 | 5000 | 0.369 | 2000.004 | 0.287 | 1999.960 | 0.257 | 1999.971 |
| 2 | 0.4 | 100 | 1.026 | 3999.961 | 0.492 | 5108.289 | 0.985 | 4009.890 |
| 2 | 0.4 | 500 | 0.367 | 3410.284 | 0.399 | 3419.954 | 0.245 | 4137.776 |
| 2 | 0.4 | 5000 | 0.187 | 3999.981 | 0.245 | 3999.979 | 0.314 | 3999.975 |
| 2 | 0.5 | 100 | 1.107 | 4939.112 | 1.019 | 5352.378 | 1.198 | 4672.057 |
| 2 | 0.5 | 500 | 0.467 | 5000.044 | 0.321 | 4806.901 | 0.377 | 4625.523 |
| 2 | 0.5 | 5000 | 0.427 | 4592.563 | 0.239 | 5000.005 | 0.327 | 4172.253 |
| 3 | 0 | 100 | 0.923 | 0.899 | 0.914 | 0.896 | 0.836 | 0.872 |
| 3 | 0 | 500 | 0.537 | 0.538 | 0.621 | 0.532 | 0.576 | 0.508 |
| 3 | 0 | 5000 | 0.532 | 0.569 | 0.618 | 0.606 | 0.518 | 0.571 |
| 3 | 0.2 | 100 | 1.112 | 3685.097 | 1.078 | 3289.962 | 0.948 | 3511.934 |
| 3 | 0.2 | 500 | 0.610 | 2670.319 | 0.813 | 2151.187 | 0.604 | 2310.767 |
| 3 | 0.2 | 5000 | 0.619 | 2444.609 | 0.594 | 2401.731 | 0.968 | 2407.185 |
| 3 | 0.4 | 100 | 1.879 | 3616.500 | 2.217 | 3999.951 | 1.818 | 4000.008 |
| 3 | 0.4 | 500 | 0.688 | 3804.583 | 0.705 | 4073.334 | 0.647 | 3611.136 |
| 3 | 0.4 | 5000 | 0.536 | 3632.560 | 0.588 | 3018.323 | 0.544 | 3355.282 |
| 3 | 0.5 | 100 | 1.397 | 4549.170 | 1.960 | 5318.391 | 2.206 | 4640.306 |
| 3 | 0.5 | 500 | 0.969 | 5000.056 | 0.712 | 4149.362 | 0.733 | 4883.820 |
| 3 | 0.5 | 5000 | 0.627 | 3770.222 | 0.553 | 5000.095 | 0.542 | 4101.688 |
| 5 | 0 | 100 | 2.937 | 1.470 | 2.353 | 1.346 | 1.302 | 1.587 |
| 5 | 0 | 500 | 0.843 | 0.895 | 0.877 | 0.759 | 0.799 | 0.758 |
| 5 | 0 | 5000 | 0.756 | 0.680 | 0.726 | 0.625 | 0.657 | 0.708 |
| 5 | 0.2 | 100 | 1.553 | 3379.579 | 1.388 | 2908.166 | 1.797 | 2591.612 |
| 5 | 0.2 | 500 | 0.820 | 2614.763 | 1.079 | 2503.772 | 0.839 | 2289.500 |
| 5 | 0.2 | 5000 | 0.738 | 2364.317 | 0.655 | 2321.339 | 0.785 | 2069.539 |
| 5 | 0.4 | 100 | 3.402 | 3592.035 | 3.272 | 4186.407 | 2.596 | 3999.992 |
| 5 | 0.4 | 500 | 1.008 | 2898.579 | 0.868 | 3530.747 | 0.895 | 3552.943 |
| 5 | 0.4 | 5000 | 0.617 | 2111.821 | 0.745 | 2664.957 | 0.684 | 3646.537 |
| 5 | 0.5 | 100 | 1.737 | 4921.612 | 1.433 | 3565.847 | 1.640 | 4081.125 |
| 5 | 0.5 | 500 | 0.881 | 4999.977 | 1.007 | 4295.574 | 0.941 | 4055.324 |
| 5 | 0.5 | 5000 | 0.672 | 5000.007 | 0.680 | 4999.978 | 0.691 | 2703.705 |
| 10 | 0 | 100 | 2.166 | 2.433 | 2.290 | 2.257 | 1.891 | 1.990 |
| 10 | 0 | 500 | 1.024 | 1.005 | 1.162 | 0.963 | 1.157 | 1.646 |
| 10 | 0 | 5000 | 0.794 | 0.749 | 0.739 | 0.752 | 0.748 | 0.732 |
| 10 | 0.2 | 100 | 1.539 | 2894.798 | 1.579 | 2000.302 | 1.588 | 3023.632 |
| 10 | 0.2 | 500 | 1.066 | 2033.224 | 1.079 | 2447.593 | 1.061 | 2386.692 |
| 10 | 0.2 | 5000 | 0.737 | 1684.153 | 0.766 | 1899.151 | 0.705 | 2151.272 |
| 10 | 0.4 | 100 | 1.661 | 4012.751 | 1.607 | 3727.007 | 1.646 | 3553.068 |
| 10 | 0.4 | 500 | 1.225 | 4000.000 | 1.615 | 4000.019 | 1.066 | 4000.013 |
| 10 | 0.4 | 5000 | 0.846 | 3271.505 | 0.763 | 4000.034 | 0.773 | 2552.102 |
| 10 | 0.5 | 100 | 1.989 | 4120.718 | 2.008 | 4003.421 | 1.865 | 5000.024 |
| 10 | 0.5 | 500 | 1.387 | 4999.992 | 1.631 | 3008.089 | 1.395 | 2166.410 |
| 10 | 0.5 | 5000 | 0.825 | 5000.025 | 0.800 | 3568.897 | 0.801 | 3801.738 |
| Input | Proportion | Size of the | Noise level =0 | Noise level=0.1 | Noise level=0.2 | |||
|---|---|---|---|---|---|---|---|---|
| dimension | of outliers | data set | pclts | nnet | pclts | nnet | pclts | nnet |
| 1 | 0 | 100 | 0.011 | 0.011 | 0.032 | 0.031 | 0.116 | 0.129 |
| 1 | 0 | 500 | 0.033 | 0.004 | 0.047 | 0.013 | 0.032 | 0.029 |
| 1 | 0 | 5000 | 0.012 | 0.001 | 0.049 | 0.005 | 0.016 | 0.013 |
| 1 | 0.2 | 100 | 0.086 | 1428.515 | 0.205 | 1244.780 | 0.139 | 2210.010 |
| 1 | 0.2 | 500 | 0.004 | 2050.179 | 0.020 | 2343.837 | 0.041 | 2274.445 |
| 1 | 0.2 | 5000 | 0.001 | 2131.853 | 0.007 | 1964.621 | 0.011 | 1938.302 |
| 1 | 0.4 | 100 | 0.006 | 3071.073 | 0.055 | 2601.291 | 0.112 | 2573.349 |
| 1 | 0.4 | 500 | 0.005 | 3175.624 | 0.016 | 3928.369 | 0.039 | 2944.073 |
| 1 | 0.4 | 5000 | 0.001 | 3518.383 | 0.006 | 2769.465 | 0.022 | 4001.567 |
| 1 | 0.5 | 100 | 0.010 | 4480.236 | 0.067 | 3453.947 | 0.094 | 4059.283 |
| 1 | 0.5 | 500 | 0.005 | 3400.442 | 0.019 | 3038.613 | 0.045 | 2985.368 |
| 1 | 0.5 | 5000 | 0.002 | 3771.652 | 0.007 | 4254.330 | 0.019 | 3896.209 |
| 2 | 0 | 100 | 0.041 | 0.032 | 0.063 | 0.069 | 0.185 | 0.207 |
| 2 | 0 | 500 | 0.019 | 0.013 | 0.034 | 0.031 | 0.069 | 0.066 |
| 2 | 0 | 5000 | 0.008 | 0.006 | 0.010 | 0.010 | 0.014 | 0.016 |
| 2 | 0.2 | 100 | 0.036 | 2727.134 | 0.115 | 3232.341 | 0.341 | 3343.561 |
| 2 | 0.2 | 500 | 0.013 | 2347.874 | 0.040 | 2106.149 | 0.070 | 1871.573 |
| 2 | 0.2 | 5000 | 0.006 | 1733.387 | 0.013 | 1684.584 | 0.021 | 1835.099 |
| 2 | 0.4 | 100 | 0.065 | 4100.837 | 0.280 | 3534.314 | 0.304 | 2983.691 |
| 2 | 0.4 | 500 | 0.022 | 1424.309 | 0.047 | 2387.109 | 0.093 | 2216.498 |
| 2 | 0.4 | 5000 | 0.009 | 1962.566 | 0.014 | 2761.497 | 0.027 | 2200.297 |
| 2 | 0.5 | 100 | 0.060 | 4457.908 | 0.167 | 4871.504 | 0.521 | 4488.219 |
| 2 | 0.5 | 500 | 0.023 | 3960.387 | 0.046 | 3739.904 | 0.130 | 3238.984 |
| 2 | 0.5 | 5000 | 0.009 | 2236.145 | 0.015 | 2715.766 | 0.029 | 3676.229 |
| 3 | 0 | 100 | 0.485 | 0.055 | 0.423 | 0.164 | 1.025 | 0.253 |
| 3 | 0 | 500 | 0.220 | 0.025 | 0.249 | 0.052 | 0.264 | 0.077 |
| 3 | 0 | 5000 | 0.123 | 0.010 | 0.140 | 0.022 | 0.240 | 0.026 |
| 3 | 0.2 | 100 | 1.129 | 3717.613 | 1.395 | 2779.470 | 2.981 | 2989.171 |
| 3 | 0.2 | 500 | 0.036 | 2028.797 | 0.091 | 1600.051 | 0.115 | 2268.236 |
| 3 | 0.2 | 5000 | 0.028 | 1058.039 | 0.024 | 1527.461 | 0.035 | 1587.201 |
| 3 | 0.4 | 100 | 0.314 | 4793.372 | 0.363 | 4047.600 | 0.532 | 4194.754 |
| 3 | 0.4 | 500 | 0.097 | 3610.365 | 0.141 | 2508.087 | 0.131 | 3132.982 |
| 3 | 0.4 | 5000 | 0.020 | 2033.151 | 0.053 | 1966.833 | 0.041 | 2651.994 |
| 3 | 0.5 | 100 | 2.137 | 4825.086 | 1.099 | 4296.795 | 0.831 | 5327.959 |
| 3 | 0.5 | 500 | 0.028 | 3375.964 | 0.065 | 3420.456 | 0.176 | 3534.288 |
| 3 | 0.5 | 5000 | 0.012 | 2710.242 | 0.023 | 2105.679 | 0.037 | 2188.200 |
| 5 | 0 | 100 | 1.408 | 0.839 | 4.929 | 4.684 | 4.230 | 1.005 |
| 5 | 0 | 500 | 0.363 | 0.195 | 0.536 | 0.296 | 0.625 | 0.238 |
| 5 | 0 | 5000 | 0.156 | 0.078 | 0.214 | 0.104 | 0.207 | 2.488 |
| 5 | 0.2 | 100 | 3.461 | 2913.071 | 4.988 | 3044.410 | 5.467 | 2610.414 |
| 5 | 0.2 | 500 | 0.365 | 2134.386 | 0.256 | 2426.132 | 0.274 | 1557.945 |
| 5 | 0.2 | 5000 | 0.302 | 916.923 | 0.448 | 1953.074 | 0.282 | 1825.487 |
| 5 | 0.4 | 100 | 7.364 | 4303.066 | 2.038 | 4712.548 | 3.855 | 3613.974 |
| 5 | 0.4 | 500 | 0.201 | 2389.376 | 0.243 | 1608.493 | 0.297 | 2897.463 |
| 5 | 0.4 | 5000 | 2.472 | 1535.051 | 0.409 | 982.122 | 0.186 | 2710.593 |
| 5 | 0.5 | 100 | 2.620 | 5777.409 | 2.659 | 3981.915 | 3.004 | 4552.276 |
| 5 | 0.5 | 500 | 0.334 | 2959.721 | 0.386 | 3587.578 | 0.387 | 3820.604 |
| 5 | 0.5 | 5000 | 0.083 | 1486.899 | 0.339 | 1860.152 | 0.110 | 3650.581 |
| 10 | 0 | 100 | 7.693 | 18.996 | 14.509 | 14.780 | 9.206 | 19.782 |
| 10 | 0 | 500 | 3.459 | 3.393 | 3.518 | 1.502 | 1.458 | 2.586 |
| 10 | 0 | 5000 | 1.454 | 3.134 | 1.342 | 1.166 | 1.853 | 0.877 |
| 10 | 0.2 | 100 | 11.088 | 4958.813 | 11.139 | 3430.718 | 12.938 | 3779.233 |
| 10 | 0.2 | 500 | 7.437 | 2102.617 | 5.793 | 2146.722 | 8.225 | 1560.623 |
| 10 | 0.2 | 5000 | 1.361 | 914.675 | 1.373 | 1440.426 | 1.529 | 1741.527 |
| 10 | 0.4 | 100 | 9.915 | 3334.080 | 9.532 | 5060.621 | 10.702 | 3418.132 |
| 10 | 0.4 | 500 | 9.291 | 2923.122 | 11.039 | 2665.132 | 12.791 | 2930.661 |
| 10 | 0.4 | 5000 | 1.348 | 1230.987 | 3.820 | 1214.258 | 3.818 | 2165.092 |
| 10 | 0.5 | 100 | 10.992 | 4883.367 | 10.502 | 5012.351 | 11.335 | 4846.822 |
| 10 | 0.5 | 500 | 4.795 | 2404.714 | 8.024 | 3607.545 | 10.387 | 2444.654 |
| 10 | 0.5 | 5000 | 2.268 | 2333.182 | 3.807 | 2318.265 | 1.090 | 1417.052 |
| Input | Proportion | Size of the | Noise level =0 | Noise level=0.1 | Noise level=0.2 | |||
|---|---|---|---|---|---|---|---|---|
| dimension | of outliers | data set | pclts | nnet | pclts | nnet | pclts | nnet |
| 1 | 0 | 100 | 0.009 | 0.009 | 0.054 | 0.054 | 0.106 | 0.113 |
| 1 | 0 | 500 | 0.002 | 0.002 | 0.016 | 0.016 | 0.049 | 0.047 |
| 1 | 0 | 5000 | 0.000 | 0.000 | 0.005 | 0.005 | 0.013 | 0.013 |
| 1 | 0.2 | 100 | 0.008 | 1765.182 | 0.050 | 1758.972 | 0.055 | 2102.820 |
| 1 | 0.2 | 500 | 0.002 | 2188.202 | 0.016 | 2113.608 | 0.042 | 2097.431 |
| 1 | 0.2 | 5000 | 0.001 | 1826.183 | 0.004 | 1980.115 | 0.010 | 2050.203 |
| 1 | 0.4 | 100 | 0.010 | 3364.341 | 0.063 | 4039.035 | 0.089 | 3449.219 |
| 1 | 0.4 | 500 | 0.003 | 2817.924 | 0.018 | 3713.575 | 0.046 | 3421.399 |
| 1 | 0.4 | 5000 | 0.001 | 1480.301 | 0.010 | 2625.622 | 0.009 | 1438.434 |
| 1 | 0.5 | 100 | 0.014 | 2993.168 | 0.062 | 5208.375 | 0.238 | 4399.353 |
| 1 | 0.5 | 500 | 0.003 | 3157.996 | 0.027 | 3659.850 | 0.052 | 3452.964 |
| 1 | 0.5 | 5000 | 0.001 | 3970.096 | 0.005 | 1666.382 | 0.020 | 2975.661 |
| 2 | 0 | 100 | 0.028 | 0.022 | 0.100 | 0.094 | 0.188 | 0.219 |
| 2 | 0 | 500 | 0.011 | 0.012 | 0.033 | 0.032 | 0.078 | 0.072 |
| 2 | 0 | 5000 | 0.011 | 0.026 | 0.015 | 0.039 | 0.042 | 0.021 |
| 2 | 0.2 | 100 | 0.023 | 2420.006 | 0.134 | 2812.395 | 0.246 | 2563.617 |
| 2 | 0.2 | 500 | 0.011 | 2279.412 | 0.036 | 1869.458 | 0.074 | 2704.868 |
| 2 | 0.2 | 5000 | 0.008 | 2101.774 | 0.017 | 1884.560 | 0.040 | 1319.015 |
| 2 | 0.4 | 100 | 0.037 | 4207.650 | 0.192 | 4193.981 | 0.602 | 3981.419 |
| 2 | 0.4 | 500 | 0.012 | 2908.053 | 0.057 | 2746.133 | 0.110 | 2929.497 |
| 2 | 0.4 | 5000 | 0.011 | 1270.255 | 0.015 | 1463.656 | 0.023 | 1338.211 |
| 2 | 0.5 | 100 | 0.101 | 5677.245 | 0.159 | 3707.418 | 0.435 | 4976.179 |
| 2 | 0.5 | 500 | 0.014 | 3565.570 | 0.038 | 5092.360 | 0.143 | 4226.929 |
| 2 | 0.5 | 5000 | 0.030 | 2515.610 | 0.017 | 2195.271 | 0.047 | 3655.635 |
| 3 | 0 | 100 | 0.400 | 0.034 | 0.201 | 0.193 | 0.303 | 0.360 |
| 3 | 0 | 500 | 0.029 | 0.038 | 0.069 | 0.067 | 0.108 | 0.135 |
| 3 | 0 | 5000 | 0.023 | 0.022 | 0.033 | 0.029 | 0.050 | 0.036 |
| 3 | 0.2 | 100 | 0.113 | 3211.998 | 0.214 | 3061.432 | 0.293 | 3109.383 |
| 3 | 0.2 | 500 | 0.037 | 2442.978 | 0.047 | 2294.771 | 0.117 | 2199.221 |
| 3 | 0.2 | 5000 | 0.022 | 2015.321 | 0.045 | 2229.473 | 0.044 | 1978.711 |
| 3 | 0.4 | 100 | 0.078 | 4477.740 | 0.367 | 3743.564 | 0.600 | 5265.777 |
| 3 | 0.4 | 500 | 0.049 | 3725.876 | 0.069 | 3263.236 | 0.158 | 2967.931 |
| 3 | 0.4 | 5000 | 0.037 | 2042.914 | 0.030 | 1572.561 | 0.051 | 948.232 |
| 3 | 0.5 | 100 | 0.164 | 5217.680 | 0.438 | 4772.684 | 0.772 | 4567.295 |
| 3 | 0.5 | 500 | 0.033 | 3214.542 | 0.070 | 3286.198 | 0.149 | 3396.359 |
| 3 | 0.5 | 5000 | 0.037 | 997.293 | 0.029 | 4078.636 | 0.052 | 1340.076 |
| 5 | 0 | 100 | 0.359 | 0.471 | 0.553 | 0.352 | 0.394 | 0.439 |
| 5 | 0 | 500 | 0.137 | 0.082 | 0.163 | 0.139 | 0.201 | 0.161 |
| 5 | 0 | 5000 | 0.075 | 0.080 | 0.069 | 0.104 | 0.115 | 0.092 |
| 5 | 0.2 | 100 | 0.411 | 3425.099 | 0.448 | 3407.395 | 0.623 | 4213.772 |
| 5 | 0.2 | 500 | 0.217 | 2268.813 | 0.169 | 1844.163 | 0.246 | 2005.357 |
| 5 | 0.2 | 5000 | 0.077 | 1159.222 | 0.083 | 1698.785 | 0.133 | 1493.518 |
| 5 | 0.4 | 100 | 0.472 | 4529.235 | 0.527 | 2493.730 | 0.784 | 3896.168 |
| 5 | 0.4 | 500 | 0.161 | 3279.181 | 0.215 | 3656.944 | 0.287 | 3632.136 |
| 5 | 0.4 | 5000 | 0.081 | 2594.180 | 0.094 | 2558.796 | 0.105 | 2527.323 |
| 5 | 0.5 | 100 | 0.463 | 4272.932 | 0.593 | 4192.088 | 0.531 | 4263.360 |
| 5 | 0.5 | 500 | 0.170 | 3430.565 | 0.326 | 3359.898 | 0.355 | 3421.224 |
| 5 | 0.5 | 5000 | 0.091 | 2877.599 | 0.084 | 2401.704 | 0.154 | 3382.486 |
| 10 | 0 | 100 | 0.215 | 0.299 | 0.258 | 0.306 | 0.354 | 0.359 |
| 10 | 0 | 500 | 0.238 | 0.249 | 0.227 | 0.246 | 0.279 | 0.289 |
| 10 | 0 | 5000 | 0.099 | 0.103 | 0.185 | 0.117 | 0.173 | 0.142 |
| 10 | 0.2 | 100 | 0.260 | 3753.222 | 0.293 | 3359.206 | 0.392 | 3168.373 |
| 10 | 0.2 | 500 | 0.241 | 2233.665 | 0.266 | 2590.100 | 0.283 | 2683.247 |
| 10 | 0.2 | 5000 | 0.103 | 2213.302 | 0.132 | 2205.644 | 0.136 | 966.199 |
| 10 | 0.4 | 100 | 0.250 | 4099.838 | 0.268 | 4691.776 | 0.276 | 4583.842 |
| 10 | 0.4 | 500 | 0.228 | 3347.419 | 0.293 | 3198.435 | 0.327 | 3662.368 |
| 10 | 0.4 | 5000 | 0.102 | 1783.281 | 0.139 | 2331.094 | 0.173 | 1012.611 |
| 10 | 0.5 | 100 | 0.357 | 5374.843 | 0.325 | 4782.975 | 0.355 | 5266.989 |
| 10 | 0.5 | 500 | 0.274 | 3648.297 | 0.349 | 3722.761 | 0.374 | 3047.895 |
| 10 | 0.5 | 5000 | 0.163 | 1609.686 | 0.142 | 1109.243 | 0.177 | 2243.199 |
| Input | Proportion | Size of the | Noise level =0 | Noise level=0.1 | Noise level=0.2 | |||
|---|---|---|---|---|---|---|---|---|
| dimension | of outliers | data set | pclts | nnet | pclts | nnet | pclts | nnet |
| 1 | 0 | 100 | 0.041 | 0.012 | 0.095 | 0.042 | 0.057 | 0.048 |
| 1 | 0 | 500 | 0.004 | 0.004 | 0.013 | 0.013 | 0.038 | 0.038 |
| 1 | 0 | 5000 | 0.001 | 0.001 | 0.007 | 0.004 | 0.012 | 0.012 |
| 1 | 0.2 | 100 | 0.014 | 3128.316 | 0.044 | 3952.802 | 0.076 | 3533.059 |
| 1 | 0.2 | 500 | 0.009 | 2259.867 | 0.031 | 2258.475 | 0.070 | 2098.067 |
| 1 | 0.2 | 5000 | 0.001 | 2187.879 | 0.006 | 2303.391 | 0.017 | 2237.420 |
| 1 | 0.4 | 100 | 0.036 | 4001.311 | 0.049 | 4302.778 | 0.084 | 3703.276 |
| 1 | 0.4 | 500 | 0.009 | 3075.499 | 0.016 | 2973.959 | 0.040 | 4080.353 |
| 1 | 0.4 | 5000 | 0.002 | 2638.407 | 0.008 | 2706.752 | 0.019 | 3233.509 |
| 1 | 0.5 | 100 | 0.136 | 4452.552 | 0.139 | 4693.292 | 0.188 | 4552.690 |
| 1 | 0.5 | 500 | 0.008 | 3955.118 | 0.020 | 4754.951 | 0.046 | 3402.606 |
| 1 | 0.5 | 5000 | 0.002 | 4194.380 | 0.011 | 4864.122 | 0.018 | 4988.893 |
| 2 | 0 | 100 | 0.603 | 1.005 | 0.737 | 0.789 | 0.906 | 0.860 |
| 2 | 0 | 500 | 0.504 | 0.410 | 0.489 | 0.513 | 0.503 | 0.437 |
| 2 | 0 | 5000 | 0.478 | 0.351 | 0.406 | 0.426 | 0.322 | 0.283 |
| 2 | 0.2 | 100 | 0.625 | 2105.492 | 0.678 | 2485.237 | 0.628 | 2928.959 |
| 2 | 0.2 | 500 | 0.477 | 2454.516 | 0.337 | 1793.007 | 0.448 | 2225.536 |
| 2 | 0.2 | 5000 | 0.412 | 1938.913 | 0.314 | 2026.322 | 0.410 | 1772.382 |
| 2 | 0.4 | 100 | 0.722 | 4325.889 | 1.444 | 3492.209 | 1.239 | 3540.848 |
| 2 | 0.4 | 500 | 0.491 | 1937.007 | 0.491 | 3197.496 | 0.509 | 2796.427 |
| 2 | 0.4 | 5000 | 0.359 | 3034.412 | 0.274 | 3670.032 | 0.300 | 3345.920 |
| 2 | 0.5 | 100 | 1.310 | 4471.116 | 1.417 | 2965.294 | 0.868 | 4842.782 |
| 2 | 0.5 | 500 | 0.511 | 3877.878 | 0.269 | 3574.512 | 0.535 | 2647.934 |
| 2 | 0.5 | 5000 | 0.321 | 3563.717 | 0.397 | 3365.565 | 0.268 | 2555.748 |
| 3 | 0 | 100 | 1.816 | 1.678 | 1.430 | 1.432 | 1.119 | 1.068 |
| 3 | 0 | 500 | 0.876 | 0.855 | 0.860 | 0.795 | 0.857 | 0.851 |
| 3 | 0 | 5000 | 0.742 | 0.742 | 0.741 | 0.743 | 0.734 | 0.740 |
| 3 | 0.2 | 100 | 1.147 | 2903.258 | 1.260 | 3268.886 | 1.558 | 3084.920 |
| 3 | 0.2 | 500 | 0.875 | 2247.053 | 0.803 | 2008.515 | 0.840 | 2367.498 |
| 3 | 0.2 | 5000 | 0.740 | 1806.993 | 0.741 | 1865.464 | 0.750 | 1755.061 |
| 3 | 0.4 | 100 | 2.094 | 3715.733 | 1.491 | 4618.206 | 4.317 | 5149.712 |
| 3 | 0.4 | 500 | 0.931 | 2745.697 | 0.965 | 3138.338 | 0.869 | 3148.451 |
| 3 | 0.4 | 5000 | 0.754 | 1517.785 | 0.764 | 4049.413 | 0.746 | 3902.094 |
| 3 | 0.5 | 100 | 1.905 | 4156.388 | 2.119 | 3726.369 | 1.672 | 4457.779 |
| 3 | 0.5 | 500 | 0.900 | 3291.714 | 0.945 | 3235.183 | 0.900 | 3233.359 |
| 3 | 0.5 | 5000 | 0.752 | 3167.287 | 0.782 | 2556.040 | 0.757 | 2625.226 |
| 5 | 0 | 100 | 2.327 | 4.354 | 2.229 | 2.903 | 2.498 | 2.362 |
| 5 | 0 | 500 | 1.256 | 1.092 | 1.350 | 1.259 | 1.263 | 1.123 |
| 5 | 0 | 5000 | 1.158 | 0.934 | 1.020 | 0.925 | 1.125 | 1.034 |
| 5 | 0.2 | 100 | 2.508 | 3370.282 | 4.402 | 3272.868 | 3.352 | 3293.710 |
| 5 | 0.2 | 500 | 1.576 | 2624.077 | 1.879 | 2287.972 | 1.523 | 2005.299 |
| 5 | 0.2 | 5000 | 0.985 | 1363.233 | 1.069 | 1700.153 | 1.104 | 1500.418 |
| 5 | 0.4 | 100 | 2.609 | 2376.302 | 2.722 | 4719.392 | 2.998 | 4296.714 |
| 5 | 0.4 | 500 | 1.600 | 3298.061 | 1.950 | 2755.280 | 1.552 | 2734.976 |
| 5 | 0.4 | 5000 | 1.244 | 2186.003 | 1.147 | 2300.633 | 1.174 | 2494.250 |
| 5 | 0.5 | 100 | 2.260 | 4572.099 | 2.095 | 3937.779 | 2.313 | 6210.142 |
| 5 | 0.5 | 500 | 1.605 | 4154.586 | 1.654 | 3985.983 | 2.198 | 3712.740 |
| 5 | 0.5 | 5000 | 1.066 | 2379.514 | 1.109 | 4216.597 | 1.145 | 2891.174 |
| 10 | 0 | 100 | 3.431 | 30.677 | 3.402 | 29.481 | 3.726 | 26.218 |
| 10 | 0 | 500 | 5.330 | 20.715 | 5.331 | 18.529 | 5.434 | 12.301 |
| 10 | 0 | 5000 | 9.711 | 19.120 | 9.716 | 27.106 | 9.725 | 20.595 |
| 10 | 0.2 | 100 | 3.438 | 2103.487 | 3.469 | 2422.936 | 3.235 | 2541.422 |
| 10 | 0.2 | 500 | 28.322 | 2379.359 | 28.208 | 2178.642 | 28.050 | 2371.511 |
| 10 | 0.2 | 5000 | 12.196 | 1656.961 | 12.206 | 2150.155 | 12.181 | 2194.532 |
| 10 | 0.4 | 100 | 6.600 | 4033.845 | 6.707 | 3833.060 | 6.687 | 3614.784 |
| 10 | 0.4 | 500 | 8.013 | 4065.840 | 8.485 | 3327.940 | 8.058 | 3236.766 |
| 10 | 0.4 | 5000 | 9.129 | 1971.718 | 9.584 | 2675.514 | 9.125 | 1981.605 |
| 10 | 0.5 | 100 | 18.697 | 5522.735 | 27.254 | 5035.991 | 25.144 | 5697.319 |
| 10 | 0.5 | 500 | 23.896 | 2966.468 | 24.798 | 3637.792 | 33.345 | 3050.778 |
| 10 | 0.5 | 5000 | 24.806 | 4373.678 | 15.785 | 3541.430 | 22.328 | 1935.512 |
| Input | Proportion | Size of the | Noise level =0 | Noise level=0.1 | Noise level=0.2 | |||
|---|---|---|---|---|---|---|---|---|
| dimension | of outliers | data set | pclts | nnet | pclts | nnet | pclts | nnet |
| 2 | 0 | 100 | 0.184 | 0.141 | 0.206 | 0.153 | 0.308 | 0.309 |
| 2 | 0 | 500 | 0.079 | 0.075 | 0.099 | 0.088 | 0.106 | 0.102 |
| 2 | 0 | 5000 | 0.059 | 0.059 | 0.064 | 0.065 | 0.067 | 0.066 |
| 2 | 0.2 | 100 | 0.184 | 5173.392 | 0.250 | 2889.054 | 0.306 | 3264.975 |
| 2 | 0.2 | 500 | 0.062 | 2448.795 | 0.078 | 2744.082 | 0.111 | 2458.956 |
| 2 | 0.2 | 5000 | 0.059 | 2224.556 | 0.056 | 2061.706 | 0.059 | 2159.524 |
| 2 | 0.4 | 100 | 0.223 | 5522.572 | 0.410 | 4744.327 | 0.417 | 4810.072 |
| 2 | 0.4 | 500 | 0.063 | 3344.664 | 0.071 | 3479.662 | 0.121 | 2916.421 |
| 2 | 0.4 | 5000 | 0.060 | 3246.705 | 0.061 | 3055.672 | 0.068 | 3624.289 |
| 2 | 0.5 | 100 | 0.298 | 6098.084 | 0.276 | 4586.137 | 0.402 | 4962.610 |
| 2 | 0.5 | 500 | 0.085 | 3977.607 | 0.077 | 4047.496 | 0.127 | 3827.140 |
| 2 | 0.5 | 5000 | 0.058 | 3114.126 | 0.063 | 3952.664 | 0.067 | 4174.148 |
| 3 | 0 | 100 | 0.274 | 0.193 | 0.348 | 0.253 | 0.399 | 0.431 |
| 3 | 0 | 500 | 0.092 | 0.080 | 0.098 | 0.101 | 0.134 | 0.135 |
| 3 | 0 | 5000 | 0.050 | 0.050 | 0.058 | 0.053 | 0.060 | 0.054 |
| 3 | 0.2 | 100 | 0.191 | 3237.365 | 0.267 | 3331.339 | 0.409 | 3287.101 |
| 3 | 0.2 | 500 | 0.081 | 2606.747 | 0.091 | 2494.617 | 0.107 | 2640.660 |
| 3 | 0.2 | 5000 | 0.316 | 2135.419 | 0.236 | 2226.862 | 0.064 | 2269.600 |
| 3 | 0.4 | 100 | 0.209 | 3628.007 | 0.352 | 4067.800 | 0.464 | 4241.109 |
| 3 | 0.4 | 500 | 0.055 | 3065.077 | 0.089 | 3374.726 | 0.123 | 3433.499 |
| 3 | 0.4 | 5000 | 0.054 | 2915.229 | 0.054 | 2448.904 | 0.063 | 2472.716 |
| 3 | 0.5 | 100 | 0.240 | 4303.358 | 0.411 | 4564.768 | 1.171 | 5417.045 |
| 3 | 0.5 | 500 | 0.086 | 3788.398 | 0.096 | 3592.718 | 0.140 | 3446.580 |
| 3 | 0.5 | 5000 | 0.049 | 4098.207 | 0.059 | 3511.454 | 0.071 | 3085.472 |
| 5 | 0 | 100 | 0.302 | 0.410 | 0.598 | 0.533 | 0.861 | 0.488 |
| 5 | 0 | 500 | 0.079 | 0.088 | 0.100 | 0.107 | 0.143 | 0.159 |
| 5 | 0 | 5000 | 0.056 | 0.320 | 0.076 | 0.051 | 0.076 | 0.066 |
| 5 | 0.2 | 100 | 0.489 | 2628.943 | 0.546 | 2637.739 | 0.645 | 2939.368 |
| 5 | 0.2 | 500 | 0.081 | 2610.714 | 0.097 | 2502.602 | 0.151 | 2458.578 |
| 5 | 0.2 | 5000 | 0.050 | 1862.374 | 0.058 | 1951.289 | 0.071 | 1742.820 |
| 5 | 0.4 | 100 | 0.513 | 3876.289 | 0.685 | 3999.593 | 0.695 | 3841.999 |
| 5 | 0.4 | 500 | 0.113 | 3512.653 | 0.108 | 3516.847 | 0.280 | 3112.941 |
| 5 | 0.4 | 5000 | 0.050 | 1986.295 | 0.063 | 2003.099 | 0.069 | 2237.499 |
| 5 | 0.5 | 100 | 0.532 | 6825.306 | 0.598 | 4621.246 | 0.499 | 5277.060 |
| 5 | 0.5 | 500 | 0.230 | 2969.271 | 0.138 | 3904.036 | 0.195 | 3674.711 |
| 5 | 0.5 | 5000 | 0.048 | 2622.676 | 0.056 | 2697.989 | 0.079 | 2371.459 |
| 10 | 0 | 100 | 0.601 | 0.612 | 0.688 | 0.580 | 0.689 | 0.531 |
| 10 | 0 | 500 | 0.213 | 0.081 | 0.225 | 0.113 | 0.384 | 0.153 |
| 10 | 0 | 5000 | 0.058 | 0.051 | 0.077 | 0.073 | 0.085 | 0.077 |
| 10 | 0.2 | 100 | 0.437 | 3304.800 | 0.404 | 3284.997 | 0.514 | 2462.769 |
| 10 | 0.2 | 500 | 0.148 | 2025.589 | 0.459 | 1828.131 | 0.404 | 2256.382 |
| 10 | 0.2 | 5000 | 0.049 | 952.233 | 0.067 | 1245.635 | 0.081 | 1111.282 |
| 10 | 0.4 | 100 | 0.466 | 4375.740 | 0.487 | 3656.216 | 0.549 | 3452.429 |
| 10 | 0.4 | 500 | 0.125 | 2219.042 | 0.273 | 2863.943 | 0.359 | 1983.010 |
| 10 | 0.4 | 5000 | 0.063 | 1869.179 | 0.067 | 2293.267 | 0.080 | 1561.319 |
| 10 | 0.5 | 100 | 0.344 | 4331.622 | 0.366 | 5260.219 | 0.445 | 6372.200 |
| 10 | 0.5 | 500 | 0.255 | 3316.410 | 0.366 | 4269.048 | 0.615 | 3163.424 |
| 10 | 0.5 | 5000 | 0.054 | 2455.298 | 0.075 | 1975.485 | 0.086 | 1716.108 |
| Input | Proportion | Size of the | Noise level =0 | Noise level=0.1 | Noise level=0.2 | |||
|---|---|---|---|---|---|---|---|---|
| dimension | of outliers | data set | pclts | nnet | pclts | nnet | pclts | nnet |
| 1 | 0 | 100 | 0.012 | 0.012 | 0.038 | 0.037 | 0.115 | 0.116 |
| 1 | 0 | 500 | 0.011 | 0.011 | 0.020 | 0.020 | 0.042 | 0.041 |
| 1 | 0 | 5000 | 0.008 | 0.008 | 0.015 | 0.011 | 0.015 | 0.014 |
| 1 | 0.2 | 100 | 0.014 | 3057.407 | 0.043 | 3137.274 | 0.116 | 3190.071 |
| 1 | 0.2 | 500 | 0.010 | 1692.090 | 0.028 | 1778.629 | 0.035 | 1845.963 |
| 1 | 0.2 | 5000 | 0.008 | 2209.299 | 0.009 | 1780.260 | 0.015 | 2128.146 |
| 1 | 0.4 | 100 | 0.016 | 4214.475 | 0.048 | 3809.047 | 0.090 | 4023.262 |
| 1 | 0.4 | 500 | 0.010 | 3226.848 | 0.024 | 3914.094 | 0.071 | 1938.845 |
| 1 | 0.4 | 5000 | 0.007 | 2311.221 | 0.012 | 2738.071 | 0.017 | 2271.089 |
| 1 | 0.5 | 100 | 0.295 | 4855.493 | 0.296 | 3648.157 | 0.384 | 5182.786 |
| 1 | 0.5 | 500 | 0.012 | 3523.806 | 0.034 | 3792.007 | 0.083 | 2484.452 |
| 1 | 0.5 | 5000 | 0.004 | 3989.730 | 0.010 | 3803.877 | 0.023 | 3939.139 |
| 2 | 0 | 100 | 0.717 | 0.615 | 0.779 | 0.800 | 0.759 | 0.777 |
| 2 | 0 | 500 | 0.309 | 0.272 | 0.307 | 0.443 | 0.310 | 0.314 |
| 2 | 0 | 5000 | 0.343 | 0.265 | 0.306 | 0.302 | 0.341 | 0.283 |
| 2 | 0.2 | 100 | 0.765 | 3356.822 | 0.596 | 3551.735 | 0.593 | 2410.704 |
| 2 | 0.2 | 500 | 0.479 | 2463.582 | 0.475 | 2074.612 | 0.471 | 2198.350 |
| 2 | 0.2 | 5000 | 0.299 | 1028.126 | 0.299 | 2000.821 | 0.258 | 1371.590 |
| 2 | 0.4 | 100 | 0.733 | 4901.444 | 0.867 | 3967.714 | 1.113 | 4333.710 |
| 2 | 0.4 | 500 | 0.369 | 3023.394 | 0.379 | 2635.918 | 0.391 | 2768.392 |
| 2 | 0.4 | 5000 | 0.247 | 2186.250 | 0.292 | 2263.502 | 0.358 | 1384.693 |
| 2 | 0.5 | 100 | 0.898 | 4533.296 | 1.293 | 4612.707 | 0.789 | 4389.214 |
| 2 | 0.5 | 500 | 0.386 | 1835.460 | 0.509 | 3755.613 | 0.532 | 2615.821 |
| 2 | 0.5 | 5000 | 0.343 | 2253.406 | 0.307 | 2391.966 | 0.315 | 2674.018 |
| 3 | 0 | 100 | 0.629 | 0.714 | 0.652 | 0.694 | 0.836 | 0.822 |
| 3 | 0 | 500 | 0.506 | 0.493 | 0.476 | 0.462 | 0.485 | 0.497 |
| 3 | 0 | 5000 | 0.431 | 0.434 | 0.434 | 0.421 | 0.431 | 0.432 |
| 3 | 0.2 | 100 | 0.894 | 3139.435 | 0.785 | 2557.127 | 0.912 | 2923.005 |
| 3 | 0.2 | 500 | 0.530 | 2194.874 | 0.496 | 2465.010 | 0.547 | 2327.221 |
| 3 | 0.2 | 5000 | 0.420 | 2194.511 | 0.427 | 948.379 | 0.433 | 2211.486 |
| 3 | 0.4 | 100 | 1.005 | 4518.251 | 1.505 | 4041.242 | 1.262 | 3647.697 |
| 3 | 0.4 | 500 | 0.484 | 3693.526 | 0.542 | 3248.081 | 0.562 | 3728.895 |
| 3 | 0.4 | 5000 | 0.426 | 1184.629 | 0.426 | 2002.320 | 0.448 | 1514.614 |
| 3 | 0.5 | 100 | 0.945 | 5039.629 | 1.624 | 4243.318 | 1.389 | 5883.431 |
| 3 | 0.5 | 500 | 0.607 | 2709.167 | 0.605 | 4142.209 | 0.611 | 3564.658 |
| 3 | 0.5 | 5000 | 0.428 | 2948.527 | 0.453 | 2907.613 | 0.450 | 2536.418 |
| 5 | 0 | 100 | 0.686 | 0.597 | 0.619 | 0.835 | 0.748 | 0.690 |
| 5 | 0 | 500 | 0.457 | 0.453 | 0.444 | 0.456 | 0.459 | 0.519 |
| 5 | 0 | 5000 | 0.392 | 0.387 | 0.388 | 0.396 | 0.382 | 0.392 |
| 5 | 0.2 | 100 | 0.680 | 2479.383 | 0.714 | 3603.539 | 1.065 | 3122.433 |
| 5 | 0.2 | 500 | 0.453 | 2337.403 | 0.470 | 2495.671 | 0.459 | 1769.668 |
| 5 | 0.2 | 5000 | 0.392 | 1617.184 | 0.388 | 764.356 | 0.400 | 2465.697 |
| 5 | 0.4 | 100 | 1.040 | 4346.746 | 1.102 | 8319.678 | 1.023 | 4830.529 |
| 5 | 0.4 | 500 | 0.488 | 3437.132 | 0.514 | 3010.520 | 0.523 | 3273.332 |
| 5 | 0.4 | 5000 | 0.380 | 2818.046 | 0.390 | 1235.740 | 0.387 | 2241.562 |
| 5 | 0.5 | 100 | 0.825 | 4928.127 | 0.849 | 4882.507 | 0.897 | 4702.862 |
| 5 | 0.5 | 500 | 0.509 | 3712.826 | 0.482 | 3895.769 | 0.674 | 3958.261 |
| 5 | 0.5 | 5000 | 0.405 | 3010.444 | 0.392 | 2892.701 | 0.405 | 1852.784 |
| 10 | 0 | 100 | 0.868 | 1.083 | 1.052 | 1.051 | 1.033 | 1.007 |
| 10 | 0 | 500 | 0.652 | 0.737 | 0.742 | 0.686 | 0.676 | 0.699 |
| 10 | 0 | 5000 | 0.568 | 0.571 | 0.571 | 0.571 | 0.572 | 0.569 |
| 10 | 0.2 | 100 | 0.738 | 3386.943 | 0.834 | 3620.002 | 0.838 | 3401.362 |
| 10 | 0.2 | 500 | 0.685 | 2677.360 | 0.772 | 2486.131 | 0.726 | 2526.168 |
| 10 | 0.2 | 5000 | 0.575 | 1332.530 | 0.578 | 1201.073 | 0.581 | 2044.280 |
| 10 | 0.4 | 100 | 0.725 | 3959.357 | 0.764 | 4931.136 | 0.847 | 5034.038 |
| 10 | 0.4 | 500 | 0.822 | 4001.358 | 0.804 | 3485.438 | 0.832 | 3625.378 |
| 10 | 0.4 | 5000 | 0.579 | 3132.103 | 0.572 | 2007.521 | 0.581 | 1807.688 |
| 10 | 0.5 | 100 | 0.733 | 5216.339 | 0.772 | 4298.688 | 0.716 | 4926.729 |
| 10 | 0.5 | 500 | 0.779 | 4319.615 | 0.794 | 3700.061 | 0.847 | 3946.746 |
| 10 | 0.5 | 5000 | 0.581 | 2521.998 | 0.589 | 3513.817 | 0.587 | 1931.765 |
| Proportion of outliers | PCLTS train | PCLTS test | nnet train | nnet test | CPU PCLTS | CPU nnet |
|---|---|---|---|---|---|---|
| 0 | 0.07377254 | 0.07669042 | 0.07662421 | 0.07942267 | 732.852 | 4.9196 |
| 0.2 | 0.0732535 | 0.0768083 | 1721.716 | 1071.685 | 1313.783 | 5.0199 |
| 0.4 | 0.07328527 | 0.07779184 | 3395.867 | 2798.297 | 800.7642 | 1.9977 |
| 0.5 | 0.07314826 | 0.07771504 | 3726.083 | 3783.546 | 1585.115 | 1.3546 |
| Proportion of outliers | PCLTS train | PCLTS test | nnet train | nnet test | CPU PCLTS | CPU nnet |
|---|---|---|---|---|---|---|
| 0 | 0.03352069 | 0.03799872 | 0.04224156 | 0.04277332 | 1551.998 | 5.5072 |
| 0.2 | 0.03314315 | 0.03812518 | 1504.155 | 736.1127 | 879.4155 | 3.6342 |
| 0.4 | 0.03574897 | 0.03810132 | 3112.657 | 2725.164 | 676.9802 | 2.4515 |
| 0.5 | 0.03614024 | 0.03821851 | 3522.750 | 3630.974 | 960.6753 | 1.6193 |
| Proportion of outliers | PCLTS train | PCLTS test | nnet train | nnet test | CPU PCLTS | CPU nnet |
|---|---|---|---|---|---|---|
| 0 | 0.05732137 | 0.05889331 | 0.05732247 | 0.05874144 | 582.1506 | 5.6062 |
| 0.2 | 0.05633721 | 0.05898911 | 1966.307 | 1136.745 | 1025.413 | 4.9611 |
| 0.4 | 0.055599 | 0.05912662 | 3335.348 | 2747.096 | 604.2534 | 3.0936 |
| 0.5 | 0.05553557 | 0.05952139 | 1685.271 | 1570.897 | 1657.796 | 6.5511 |
| Proportion of outliers | PCLTS train | PCLTS test | nnet train | nnet test | CPU PCLTS | CPU nnet |
|---|---|---|---|---|---|---|
| 0 | 0.2139786 | 0.2517887 | 0.2118541 | 0.2665598 | 922.7474 | 0.9273 |
| 0.2 | 0.2190235 | 0.2697414 | 2651.938 | 1682.814 | 1284.666 | 0.4501 |
| 0.4 | 0.2071636 | 0.292656 | 2926.835 | 2752.914 | 636.9798 | 0.371 |
| 0.5 | 0.2002703 | 0.3038773 | 2934.247 | 3429.113 | 448.0119 | 0.7827 |
| Out- | Data set 1 | Data set 2 | Data set 3 | Data set 4 | Data set 5 | Data set 6 | Data set 7 | Data set 8 | Data set 9 | Data set 10 | ||||||||||||
|---|---|---|---|---|---|---|---|---|---|---|---|---|---|---|---|---|---|---|---|---|---|---|
| Dim | liers | Size | PCLTS | nnet | PCLTS | nnet | PCLTS | nnet | PCLTS | nnet | PCLTS | nnet | PCLTS | nnet | PCLTS | nnet | PCLTS | nnet | PCLTS | nnet | PCLTS | nnet |
| 1 | 0 | 100 | 496.75 | 0.04 | 219.32 | 0.04 | 252.36 | 0.07 | 250.17 | 0.07 | 135.70 | 0.10 | 212.33 | 0.05 | 392.40 | 0.07 | 1455.44 | 0.09 | 304.92 | 0.08 | ||
| 1 | 0 | 500 | 679.66 | 0.21 | 242.90 | 0.30 | 308.30 | 0.43 | 192.44 | 0.38 | 173.20 | 0.55 | 154.51 | 0.23 | 246.51 | 0.38 | 57.93 | 0.40 | 231.32 | 0.41 | ||
| 1 | 0 | 5000 | 898.40 | 4.26 | 702.94 | 2.66 | 511.65 | 3.42 | 242.22 | 4.29 | 535.68 | 7.37 | 96.90 | 2.85 | 578.60 | 3.19 | 275.26 | 4.70 | 213.27 | 5.55 | ||
| 1 | 0.2 | 100 | 2034.51 | 0.04 | 224.57 | 0.03 | 352.25 | 0.07 | 132.74 | 0.04 | 129.44 | 0.07 | 155.90 | 0.04 | 2035.75 | 0.04 | 365.34 | 0.07 | 2567.31 | 0.07 | ||
| 1 | 0.2 | 500 | 321.40 | 0.18 | 137.18 | 0.18 | 301.95 | 0.26 | 199.56 | 0.24 | 94.57 | 0.40 | 298.49 | 0.28 | 832.34 | 0.26 | 431.11 | 0.30 | 1230.57 | 0.37 | ||
| 1 | 0.2 | 5000 | 84.55 | 2.64 | 276.78 | 2.55 | 41.44 | 2.72 | 238.21 | 4.04 | 40.72 | 5.00 | 295.15 | 3.21 | 204.76 | 3.05 | 1130.11 | 4.28 | 435.72 | 5.36 | ||
| 1 | 0.4 | 100 | 285.64 | 0.02 | 299.08 | 0.03 | 523.99 | 0.06 | 214.12 | 0.03 | 138.93 | 0.06 | 357.91 | 0.03 | 289.11 | 0.03 | 274.10 | 0.05 | 551.48 | 0.06 | ||
| 1 | 0.4 | 500 | 98.66 | 0.22 | 357.07 | 0.14 | 748.60 | 0.27 | 164.57 | 0.20 | 29.09 | 0.22 | 96.85 | 0.17 | 274.20 | 0.15 | 211.31 | 0.21 | 305.79 | 0.28 | ||
| 1 | 0.4 | 5000 | 230.00 | 3.26 | 91.97 | 1.60 | 754.08 | 2.02 | 239.76 | 3.20 | 41.82 | 4.30 | 223.28 | 2.82 | 106.37 | 2.12 | 156.27 | 2.79 | 483.86 | 3.56 | ||
| 1 | 0.5 | 100 | 101.90 | 0.03 | 248.73 | 0.02 | 1444.12 | 0.04 | 427.61 | 0.03 | 77.07 | 0.02 | 1459.09 | 0.02 | 241.20 | 0.05 | 146.64 | 0.03 | 288.88 | 0.04 | ||
| 1 | 0.5 | 500 | 68.67 | 0.16 | 201.84 | 0.12 | 1628.66 | 0.19 | 146.05 | 0.13 | 86.54 | 0.27 | 108.41 | 0.12 | 105.26 | 0.22 | 127.66 | 0.15 | 456.14 | 0.17 | ||
| 1 | 0.5 | 5000 | 173.49 | 1.29 | 270.08 | 1.96 | 129.77 | 2.06 | 189.34 | 2.11 | 99.70 | 3.42 | 164.30 | 1.96 | 124.92 | 1.54 | 238.84 | 2.13 | 370.20 | 2.60 | ||
| 2 | 0 | 100 | 547.53 | 0.08 | 412.31 | 0.06 | 427.92 | 0.04 | 132.38 | 0.07 | 221.30 | 0.13 | 80.43 | 0.08 | 620.42 | 0.07 | 2200.18 | 0.06 | 112.95 | 0.05 | 449.78 | 0.04 |
| 2 | 0 | 500 | 79.05 | 0.37 | 264.78 | 0.33 | 364.42 | 0.37 | 690.49 | 0.44 | 316.23 | 0.66 | 488.03 | 0.44 | 438.66 | 0.51 | 419.43 | 0.45 | 61.14 | 0.30 | 517.92 | 0.44 |
| 2 | 0 | 5000 | 562.98 | 4.62 | 355.03 | 3.97 | 275.83 | 2.27 | 269.44 | 7.13 | 174.75 | 4.99 | 424.71 | 7.66 | 693.21 | 6.33 | 393.48 | 7.59 | 100.49 | 3.11 | 770.06 | 4.28 |
| 2 | 0.2 | 100 | 475.15 | 0.08 | 747.54 | 0.07 | 215.25 | 0.04 | 1096.95 | 0.06 | 87.32 | 0.12 | 423.30 | 0.09 | 583.42 | 0.05 | 1029.96 | 0.07 | 1245.96 | 0.04 | 374.18 | 0.04 |
| 2 | 0.2 | 500 | 389.48 | 0.39 | 544.45 | 0.37 | 226.29 | 0.19 | 876.37 | 0.41 | 53.82 | 0.49 | 1633.23 | 0.45 | 519.59 | 0.33 | 1292.09 | 0.36 | 124.16 | 0.19 | 381.84 | 0.24 |
| 2 | 0.2 | 5000 | 336.52 | 4.99 | 479.05 | 3.46 | 300.22 | 3.14 | 344.91 | 4.91 | 58.31 | 5.20 | 780.18 | 5.60 | 570.18 | 3.87 | 380.49 | 5.73 | 91.68 | 2.76 | 247.78 | 3.81 |
| 2 | 0.4 | 100 | 335.69 | 0.06 | 222.57 | 0.04 | 714.58 | 0.04 | 378.30 | 0.05 | 257.28 | 0.07 | 725.68 | 0.04 | 311.52 | 0.04 | 809.63 | 0.04 | 306.61 | 0.04 | 456.34 | 0.04 |
| 2 | 0.4 | 500 | 195.75 | 0.29 | 540.35 | 0.24 | 787.95 | 0.16 | 409.78 | 0.27 | 152.62 | 0.42 | 549.01 | 0.33 | 456.96 | 0.24 | 410.08 | 0.25 | 446.09 | 0.19 | 187.06 | 0.24 |
| 2 | 0.4 | 5000 | 177.14 | 2.51 | 320.08 | 2.69 | 76.12 | 1.16 | 1217.63 | 4.27 | 66.60 | 6.02 | 697.88 | 4.34 | 501.40 | 3.02 | 373.52 | 4.39 | 570.35 | 2.10 | 325.98 | 2.24 |
| 2 | 0.5 | 100 | 31.61 | 0.04 | 33.41 | 0.04 | 1032.92 | 0.03 | 33.72 | 0.04 | 30.98 | 0.05 | 31.05 | 0.05 | 33.62 | 0.04 | 31.61 | 0.04 | 31.28 | 0.05 | 24.40 | 0.04 |
| 2 | 0.5 | 500 | 32.02 | 0.21 | 35.95 | 0.20 | 1160.10 | 0.12 | 35.92 | 0.20 | 33.82 | 0.34 | 36.77 | 0.19 | 36.35 | 0.16 | 36.12 | 0.21 | 36.50 | 0.13 | 35.32 | 0.17 |
| 2 | 0.5 | 5000 | 39.86 | 2.22 | 42.74 | 2.09 | 1215.49 | 1.83 | 40.80 | 3.70 | 41.78 | 3.21 | 42.36 | 2.88 | 42.91 | 2.17 | 36.56 | 3.37 | 41.03 | 1.58 | 41.27 | 1.93 |
| 3 | 0 | 100 | 1318.37 | 0.07 | 392.70 | 0.07 | 195.01 | 0.06 | 912.20 | 0.09 | 350.33 | 0.13 | 91.23 | 0.08 | 126.94 | 0.04 | 117.87 | 0.05 | 41.68 | 0.05 | 739.10 | 0.05 |
| 3 | 0 | 500 | 194.17 | 0.40 | 583.70 | 0.36 | 138.41 | 0.21 | 786.80 | 0.43 | 305.35 | 0.51 | 304.91 | 0.92 | 104.59 | 0.35 | 379.41 | 0.37 | 96.02 | 0.35 | 722.90 | 0.31 |
| 3 | 0 | 5000 | 529.31 | 5.82 | 461.61 | 4.78 | 20.66 | 3.85 | 211.56 | 7.38 | 246.76 | 6.01 | 261.91 | 8.09 | 237.43 | 5.00 | 415.79 | 5.12 | 132.59 | 2.83 | 839.92 | 4.67 |
| 3 | 0.2 | 100 | 793.12 | 0.07 | 1050.84 | 0.07 | 255.37 | 0.05 | 740.36 | 0.07 | 982.26 | 0.09 | 500.63 | 0.07 | 770.20 | 0.05 | 907.44 | 0.05 | 1608.91 | 0.05 | 422.54 | 0.05 |
| 3 | 0.2 | 500 | 1065.14 | 0.35 | 1254.05 | 0.28 | 453.35 | 0.21 | 1553.27 | 0.36 | 239.91 | 0.53 | 482.26 | 0.40 | 1071.81 | 0.26 | 763.10 | 0.28 | 873.80 | 0.23 | 403.16 | 0.18 |
| 3 | 0.2 | 5000 | 421.41 | 4.51 | 498.22 | 4.46 | 206.14 | 2.52 | 568.44 | 5.20 | 94.76 | 2.26 | 355.08 | 6.57 | 630.81 | 4.41 | 734.31 | 3.82 | 228.76 | 2.86 | 267.18 | 2.63 |
| 3 | 0.4 | 100 | 468.57 | 0.05 | 570.71 | 0.06 | 652.32 | 0.04 | 653.88 | 0.06 | 553.02 | 0.08 | 636.94 | 0.10 | 803.92 | 0.05 | 504.09 | 0.04 | 500.96 | 0.08 | 467.94 | 0.05 |
| 3 | 0.4 | 500 | 451.09 | 0.28 | 626.09 | 0.19 | 722.05 | 0.17 | 415.71 | 0.31 | 1208.96 | 0.28 | 501.07 | 0.35 | 611.85 | 0.14 | 454.96 | 0.17 | 622.12 | 0.18 | 411.77 | 0.17 |
| 3 | 0.4 | 5000 | 428.67 | 4.25 | 1136.44 | 2.92 | 650.55 | 1.69 | 607.85 | 5.04 | 946.19 | 2.86 | 588.62 | 5.09 | 256.92 | 2.27 | 621.70 | 2.73 | 378.00 | 2.65 | 350.33 | 3.66 |
| 3 | 0.5 | 100 | 44.66 | 0.06 | 50.29 | 0.08 | 1454.08 | 0.05 | 46.91 | 0.05 | 48.04 | 0.08 | 50.77 | 0.05 | 51.69 | 0.03 | 45.41 | 0.04 | 37.79 | 0.05 | 57.23 | 0.04 |
| 3 | 0.5 | 500 | 53.94 | 0.19 | 54.31 | 0.13 | 1266.73 | 0.16 | 54.70 | 0.29 | 53.96 | 0.18 | 50.72 | 0.23 | 53.27 | 0.16 | 53.91 | 0.14 | 54.77 | 0.15 | 53.21 | 0.11 |
| 3 | 0.5 | 5000 | 62.21 | 2.20 | 51.09 | 3.07 | 1429.54 | 1.46 | 64.06 | 3.21 | 63.55 | 2.79 | 61.65 | 4.83 | 65.36 | 2.16 | 64.41 | 2.48 | 64.99 | 1.88 | 65.35 | 1.63 |
| 5 | 0 | 100 | 950.31 | 0.10 | 601.42 | 0.12 | 351.57 | 0.07 | 571.34 | 0.13 | 304.94 | 0.13 | 831.21 | 0.08 | 123.34 | 0.07 | 1752.19 | 0.06 | 706.40 | 0.07 | 412.43 | 0.06 |
| 5 | 0 | 500 | 1263.60 | 0.49 | 500.25 | 0.37 | 933.98 | 0.37 | 641.15 | 0.51 | 331.82 | 0.48 | 346.82 | 1.13 | 888.89 | 0.35 | 259.11 | 0.34 | 199.08 | 0.36 | 1012.63 | 0.18 |
| 5 | 0 | 5000 | 1466.39 | 7.52 | 148.12 | 5.08 | 514.01 | 2.98 | 732.56 | 8.63 | 369.66 | 5.60 | 276.46 | 15.78 | 232.57 | 5.77 | 364.63 | 7.52 | 422.92 | 3.82 | 1125.25 | 5.05 |
| 5 | 0.2 | 100 | 1335.14 | 0.10 | 4147.40 | 0.10 | 347.67 | 0.07 | 423.78 | 0.09 | 2887.74 | 0.12 | 888.39 | 0.08 | 783.25 | 0.06 | 803.19 | 0.11 | 726.47 | 0.09 | 860.12 | 0.05 |
| 5 | 0.2 | 500 | 1085.54 | 0.35 | 1477.85 | 0.29 | 301.62 | 0.18 | 996.00 | 0.50 | 3563.79 | 0.44 | 1052.70 | 0.64 | 1031.60 | 0.23 | 1082.71 | 0.40 | 1662.99 | 0.39 | 823.96 | 0.18 |
| 5 | 0.2 | 5000 | 608.99 | 6.11 | 196.59 | 2.78 | 44.11 | 3.54 | 1001.02 | 5.73 | 228.28 | 6.58 | 805.67 | 7.14 | 2823.58 | 3.52 | 724.28 | 6.16 | 580.61 | 4.20 | 657.57 | 3.66 |
| 5 | 0.4 | 100 | 914.85 | 0.13 | 1247.45 | 0.07 | 758.12 | 0.13 | 718.13 | 0.09 | 1253.16 | 0.11 | 771.06 | 0.13 | 937.43 | 0.12 | 853.46 | 0.10 | 717.50 | 0.09 | 799.58 | 0.15 |
| 5 | 0.4 | 500 | 1536.03 | 0.31 | 3057.03 | 0.23 | 778.53 | 0.16 | 880.26 | 0.37 | 170.57 | 0.25 | 769.97 | 0.64 | 1001.51 | 0.19 | 513.09 | 0.22 | 676.37 | 0.22 | 665.52 | 0.13 |
| 5 | 0.4 | 5000 | 1166.16 | 2.49 | 2278.71 | 2.09 | 910.46 | 1.65 | 706.08 | 5.11 | 151.84 | 3.57 | 1061.37 | 5.73 | 709.54 | 2.50 | 427.18 | 2.67 | 682.45 | 2.76 | 382.72 | 2.47 |
| 5 | 0.5 | 100 | 87.57 | 0.12 | 77.93 | 0.14 | 1514.40 | 0.11 | 76.39 | 0.11 | 87.78 | 0.14 | 80.79 | 0.16 | 85.70 | 0.16 | 89.51 | 0.16 | 87.77 | 0.14 | 117.76 | 0.14 |
| 5 | 0.5 | 500 | 91.37 | 0.22 | 87.67 | 0.20 | 1499.13 | 0.15 | 92.04 | 0.29 | 92.31 | 0.22 | 90.37 | 0.43 | 88.81 | 0.15 | 91.63 | 0.17 | 84.36 | 0.20 | 92.60 | 0.11 |
| 5 | 0.5 | 5000 | 110.58 | 2.70 | 104.39 | 1.73 | 164.34 | 1.34 | 113.49 | 4.12 | 105.37 | 3.17 | 110.37 | 7.23 | 115.36 | 2.12 | 112.16 | 2.84 | 108.93 | 2.27 | 109.26 | 2.79 |
| 10 | 0 | 100 | 2757.84 | 0.35 | 4326.25 | 0.25 | 107.44 | 0.40 | 1183.30 | 0.36 | 639.67 | 0.38 | 1071.85 | 0.46 | 3277.33 | 0.38 | 3625.45 | 0.42 | 2152.67 | 0.44 | 1855.01 | 0.46 |
| 10 | 0 | 500 | 2590.14 | 0.71 | 1095.09 | 0.36 | 206.05 | 0.31 | 1080.42 | 0.90 | 967.88 | 0.69 | 1363.92 | 0.98 | 759.82 | 0.38 | 1186.38 | 0.37 | 641.53 | 0.38 | 1384.22 | 0.29 |
| 10 | 0 | 5000 | 3645.12 | 13.33 | 309.22 | 4.99 | 272.86 | 3.35 | 1139.06 | 10.41 | 1026.37 | 8.65 | 2049.83 | 12.09 | 724.34 | 5.54 | 797.15 | 3.46 | 627.56 | 7.13 | 1261.36 | 3.81 |
| 10 | 0.2 | 100 | 923.73 | 0.35 | 708.45 | 0.22 | 515.29 | 0.38 | 1298.31 | 0.30 | 5686.52 | 0.34 | 1460.27 | 0.41 | 934.70 | 0.37 | 1381.85 | 0.35 | 1149.68 | 0.27 | 1483.71 | 0.40 |
| 10 | 0.2 | 500 | 1026.55 | 0.72 | 471.09 | 0.19 | 967.80 | 0.26 | 1101.19 | 0.68 | 726.47 | 0.48 | 1396.33 | 0.45 | 829.65 | 0.28 | 1119.06 | 0.29 | 715.50 | 0.42 | 1561.98 | 0.27 |
| 10 | 0.2 | 5000 | 1235.41 | 2.58 | 2145.38 | 2.95 | 1172.67 | 2.81 | 1068.90 | 9.90 | 635.84 | 6.29 | 1609.09 | 10.02 | 577.08 | 3.38 | 1391.16 | 2.63 | 882.57 | 6.88 | 1300.23 | 3.13 |
| 10 | 0.4 | 100 | 1127.56 | 0.23 | 1164.25 | 0.16 | 725.52 | 0.25 | 1406.01 | 0.19 | 3755.16 | 0.26 | 1445.14 | 0.37 | 1258.34 | 0.24 | 1450.73 | 0.33 | 1519.86 | 0.26 | 1865.13 | 0.29 |
| 10 | 0.4 | 500 | 1073.37 | 0.36 | 901.27 | 0.21 | 769.89 | 0.18 | 1245.44 | 0.54 | 950.66 | 0.43 | 1351.65 | 0.41 | 1284.80 | 0.24 | 1385.30 | 0.31 | 1179.80 | 0.44 | 1484.50 | 0.23 |
| 10 | 0.4 | 5000 | 1660.87 | 2.91 | 669.08 | 2.72 | 83.95 | 1.79 | 1309.16 | 8.91 | 627.09 | 3.41 | 1581.53 | 4.79 | 806.69 | 2.31 | 1282.66 | 2.24 | 1359.75 | 3.91 | 2162.42 | 2.18 |
| 10 | 0.5 | 100 | 177.63 | 0.19 | 173.75 | 0.11 | 1788.45 | 0.21 | 161.28 | 0.15 | 177.12 | 0.20 | 178.72 | 0.33 | 176.50 | 0.25 | 186.67 | 0.33 | 178.34 | 0.20 | 145.08 | 0.29 |
| 10 | 0.5 | 500 | 189.69 | 0.32 | 187.19 | 0.17 | 1092.62 | 0.19 | 188.99 | 0.42 | 192.57 | 0.29 | 187.90 | 0.35 | 195.14 | 0.20 | 192.07 | 0.81 | 188.00 | 0.23 | 191.50 | 0.16 |
| 10 | 0.5 | 5000 | 231.75 | 4.74 | 232.26 | 1.87 | 1345.41 | 2.32 | 232.99 | 6.69 | 198.40 | 4.14 | 229.13 | 5.63 | 201.72 | 2.30 | 239.00 | 3.37 | 217.86 | 2.84 | 229.90 | 1.55 |