CMS Computing: Performance and Outlook
Abstract
After years of development, the CMS distributed computing system is now in full operation. The LHC continues to set records for instantaneous luminosity, and CMS continues to record data at 300 Hz. Because of the intensity of the beams, there are multiple proton-proton interactions per beam crossing, leading to larger and larger event sizes and processing times. The CMS computing system has responded admirably to these challenges. We present the current status of the system, describe the recent performance, and discuss the challenges ahead and how we intend to meet them.
I The problem
Experiments at the Large Hadron Collider (LHC) bib:LHC will produce tremendous amounts of data. With instantaneous luminosities of cm-2s-1 and a crossing rate of 40 MHz, the collision rate will be about Hz. But the rate for new physics processes, after accounting for branching fractions and the like, is of order Hz, leading to the need to select events out of a huge data sample at the level of .
The Compact Muon Solenoid (CMS) experiment bib:CMS developed a distributed computing model from the very early days of the experiment. There are a variety of motivating factors for this: a single data center at CERN would be expensive to build and operate, whereas smaller data centers at multiple sites are less expensive and can leverage local resources (both financial and human). But there are also many challenges in making a distributed model work.
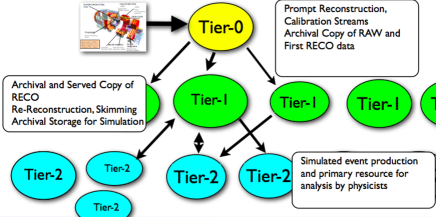
The CMS distributed computing model bib:CMSmodel has different computing centers arranged in a “tiered” hierarchy, as illustrated in Figure 1, with experimental data typically flowing from clusters at lower-numbered tiers to those at higher-numbered tiers. The different centers are configured to best perform their individual tasks. The Tier-0 facility at CERN is where prompt reconstruction of data coming directly from the detector takes place; where quick-turnaround calibration and alignment jobs are run; and where an archival copy of the data is made. The facility is typically saturated by just those tasks. There are seven Tier-1 centers in seven nations (including at FNAL in the United States). These centers keep another archival copy of the data111If one would say that the data is not truly acquired until there are two safe copies of it, then the CMS data acquisition system stretches around the world., and are responsible for performing re-reconstruction of older data with improved calibration and algorithms, and making skims of primary datasets that are enriched in particular physics signals. They also provide archival storage of simulated samples produced at Tier-2. There are about 40 Tier-2 sites around the world (including seven in the U.S.); they are the primary resource for data analysis by physicists, and also where all simulations done for the benefit of the whole collaboration take place. These centers thus host both organized and chaotic computing activities.
Everything stated so far could just as well have been said two years ago, before the LHC actually began operations. In fact, it was bib:Bloom . What is different now is that we have two years of real operational experience under our belts. In this presentation, we discuss the performance of the computing system in 2010, its anticipated and actual performance in 2011, the technical advances that have made that level of performance possible, and some thoughts for the future.
II Predicting 2011 from 2010
2010 was the first full year of LHC operations, and the distributed computing system performed as expected. In particular, all workflows ran at their designated facilities from the very beginning; there was no need to change Figure 1 on the fly. The amount of data handled by the system was truly stunning. The Tier-0 facility produced 100 different datasets, with a total of 13.9 billion events and 674 TiB. At the Tier-1 sites, the data was re-reconstructed 19 times (far more often than anticipated in the computing model, due to rapidly evolving understanding of the detector), with 17.2 billion events and 2.4 PiB output. There were four re-reconstruction passes on the Monte Carlo (MC) samples, with 8.3 billion events and 2.9 PiB output. MC production was done at both Tier 1 and Tier 2, with upwards of 500 million events/month produced at peak rates.
There were also many transfers from tier to tier. The movement of analysis datasets to Tier 2 kept up with data-taking, so that data was in the hands of analysts within a day of being reconstructed. The original computing model envisioned peak rates of 600 MB/s from Tier 0 to Tier 1 and 1200 MB/s from Tier 1 to Tier 2; these were routinely exceeded. The original model did not envision transfers among Tier-2 sites, but in fact Tier-2 sites received about as much data from other Tier-2’s as they did from the Tier-1’s. This created more flexibility and efficiency in how data could be moved.
Meanwhile, user analysis was successfully migrated to the Tier-2 sites. It was impossible to know for sure that the grid could handle hundreds of users, or even if all of those users would want to use the grid to begin with. But in 2010 there were about 450 unique analysis users per week, submitting 150,000 analysis jobs per day. The true metric of success was that, by the time of this conference, 75 papers on the 2010 data had been submitted, accepted or published, with more in the pipeline, and there was never any evidence that computing was ever the bottleneck. It is remarkable that all of this was achieved in the face of rapidly changing experimental conditions.
As wonderful as this is, it must be remembered that the LHC only delivered 45 pb-1 of integrated luminosity. This is less than what the computing system was designed for, and success was mandatory under those conditions. However, it provided an opportunity to shake down the system under a relatively small load, and to gather data that would help plan for 2011.
As the 2011 run approached, it was clear that the target instantaneous luminosity for the year would be reached rather quickly, and indeed it was in June. It was also expected that this would be achieved by having large proton bunches with many interactions per event; 16 was the amount anticipated by the September technical stop. As a result of this, the event size was expected to double (to 0.8 MB/event for the comprehensive RECO data format, 0.2 MB/event for the stripped-down AOD format) from the 2010 values, and the processing time was expected to quadruple (to 96 HS06/event) bib:HS06 . While the trigger rate was nominally expected to be 300 Hz, it was expected that it would be a challenge to keep it there, given the pressures to try to avoid raising thresholds in the face of higher event rates.
The experience of 2010 plus the above parameters were used as the basis for a very thorough modeling effort of the necessary computing resources. The expected available resources had already been established through national pledges to the Worldwide LHC Computing Grid (WLCG) bib:WLCG . The model could then be used to tailor operational plans to make sure activities could fit into the resources available. What was clear was that CMS computing was expected to be resource-limited, even after squeezing a lot of efficiency out of operations. A few highlights of the modeling follow.
One fact that emerged from 2010 operations (but in retrospect seems fairly obvious) is that the Tier-1 facilities, built at a scale to handle data re-processing when necessary, are not very busy when they are not re-processing data. Thus, it makes sense to move as much MC production as possible from Tier 2 to Tier 1, to make use of available Tier-1 resources and to leave more room for user analysis at Tier 2. The left panel of Figure 2 shows how different activities are expected to make use of Tier-1 processing resources month by month through 2013. One can see that the Tier-1 centers are extremely busy when re-processing, but still less so otherwise. The right panel of Figure 2 shows how disk space is expected to be used at Tier-1. Less space is allocated to AOD’s at Tier 1 than in the original model, which imagined that each of the seven centers would keep a complete copy of the AOD. But the reliability and speed of data transfers gives confidence that keeping only two copies of the AOD events across the entire system will be sufficient. Still, to fit within the available resources, physicists must switch from RECO to AOD format as much as possible, and regular deletion campaigns will be required.
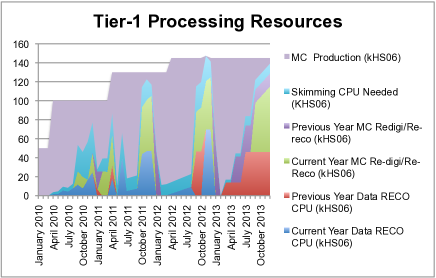
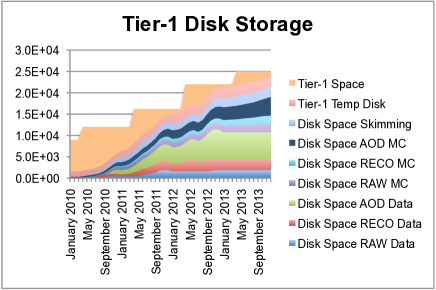
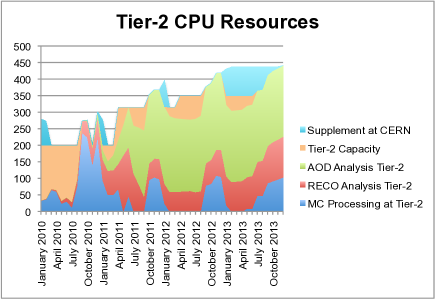
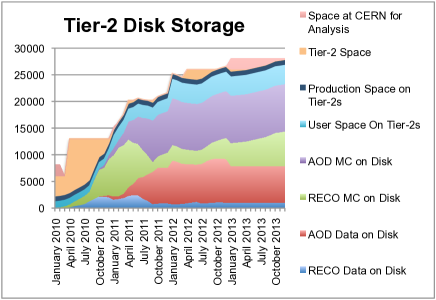
Figure 3 shows similar plots for the planned use of Tier-2 resources. As long as much MC production activity stays at Tier 1, the use of processing resources at Tier 2 is reasonable. But during re-processing periods, MC production moves back to Tier 2, at which point the resources are overcommitted. In addition, to remain within the available disk resources, 90% of user analysis needs to move from RECO to AOD samples. The model assumes that there will be four copies of each analysis dataset across all of the Tier-2 sites, but this might have to be reduced if there is a disk-space crunch. Under any circumstances, Tier-2 resources are heavily committed over the next few years.
III 2011 operational experience
How well does real CMS life match up with the plan, which was developed before the LHC started running this year? Here we discuss recent operational experience, and some of the technological changes that have been implemented to make the CMS computing system work better.
III.1 Data size and rate
Figure 4 shows the amount of time that the LHC has been operating for physics data-taking each month, through July, compared to the expected operational time that was an input to the model. The figure also shows the average trigger rate. Overall the LHC duty cycle has been lower than expected, but this has been compensated for by a trigger rate that is consistently greater than 300 Hz. (The trigger rate includes the overlap in primary datasets, which was planned to be about 25%.) In total, about 1.1 B events have been recorded, compared to 1.3 B expected from the model. A small amount of contingency has been gained as a result. Given this rate, the size of the full 2011 dataset after a re-reconstruction pass should be about 1 PB.
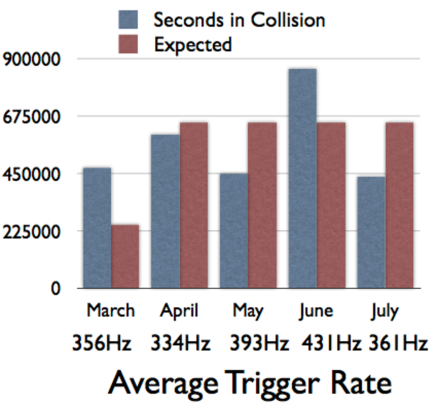
Table 1 compares the sizes of different kinds of events to the expected values, which were based on simulations with realistic running conditions. In general, pileup has been lower than anticipated, due to an optimization of the luminosity that led to adding more proton bunches rather than increasing the number of protons per bunch. Event sizes are smaller than expected as a result. The time required to reconstruct events has been about as expected for minimum-bias events, and about 20% larger than planned for other datasets. So far, event sizes and processing times have been roughly constant with increasing luminosity. But the LHC has now reached the limit of how many bunches can be circulated in the current configuration, and luminosity must be increased in ways that increases the pileup at the same time. Thus the events are expected to get larger and processing times longer as the year continues.
| Data Type | Data RAW | Data RECO | Data AOD | MC RECO | MC AOD |
|---|---|---|---|---|---|
| Expectation | 390 | 530 | 200 | 600 | 265 |
| Observed | 200 | 500 | 100 | 970 | 250 |
III.2 Tier 0
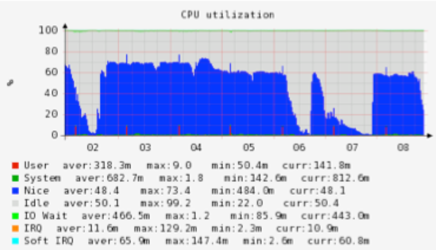
As for the operations of facilities at the various tiers, the left panel of Figure 5 shows the numbers of jobs running and queued during the first weekend in June, when the LHC had 40% livetime. As can be seen, the Tier-0 cluster was saturated, leading to nearly a thousand jobs queued at times. Once the machine stopped, this backlog was quickly cleared. However, the right panel of the figure shows that the processors were not fully used. This is because the switch to 64-bit executables and a new version of ROOT led to a larger memory footprint that inhibited efficient use of CPU. Work is in progress to reduce the size of the executable, and to take advantage of whole-node scheduling, in which multiple similar jobs could run on a single node and share read-only memory. Despite these challenges, the Tier-0 facility is keeping up well enough with reconstructing the data as they arrive.
III.3 Tier 1
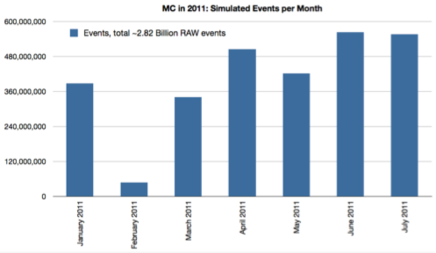
The seven Tier-1 facilities completed a full re-reconstruction of the 2010 data (nearly 1.5 B events) in April, and all available 2011 data (about 600 M events) in May, as was expected in the original planning. It is possible that there will not be another re-reconstruction of the data before the end of 2011, but this depends on whether the software version at Tier 0 is changed because of challenging event environments. Meanwhile, 2.8 B MC events were produced through the end of July, as indicated in Figure 6. The latest simulation samples include out-of-time pileup. The expected production capacity was 0.22 B events/month, but in fact the system has been capable of much more than that.
Some of the success of the Tier-1 operations can be attributed to new technology that was implemented this year. The workflow management system that had been used for data re-processing was originally designed for MC production. In that use case, it is not fatal to lose some of the events in the course of the processing, as more can always be made. But it is unacceptable to lose any data events.
A new workflow management system, WMAgent bib:WMAgent , is much more robust against such problems, and its deployment was a great help to operations. It is a state machine rather than a messaging system, and has 100% accountability for all events processed. One issue that arose was that the current version of the reconstruction software uses more memory than before, and as a result jobs were running longer and more jobs failed. Because WMAgent can redo failed jobs straightforwardly, this did not become an operational hurdle. Obviously, the system has allowed for more efficient MC production too.
Work has also begun to implement whole-node scheduling at the Tier-1 sites for further operational efficiencies. The goal is to have 50% of Tier-1 resources used this way by the end of the year.
III.4 Tier 2
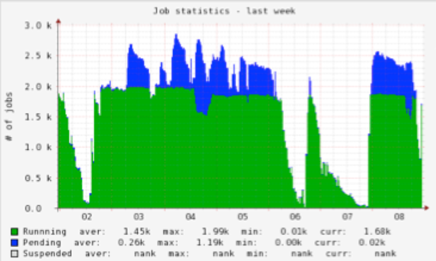
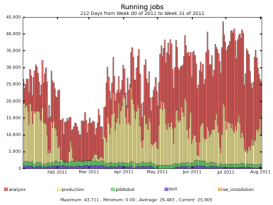
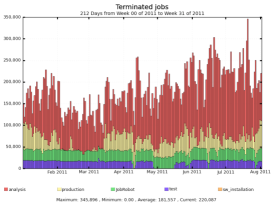
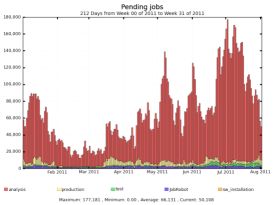
Figure 7 shows the number of running, completed and pending jobs at the approximately 50 CMS Tier-2 centers during the year so far. About 30,000 cores are continually available for use, with an increasing number of them devoted to analysis use, as more MC production moves to Tier 1. About 250,000 grid jobs are completed each day, more than was anticipated in the original computing model. Still, thousands of jobs are pending on any given day, with longer queues at times of great analysis activity. This suggests that more resources are needed for analysis, and/or that the jobs are not being optimally scheduled across all the sites.
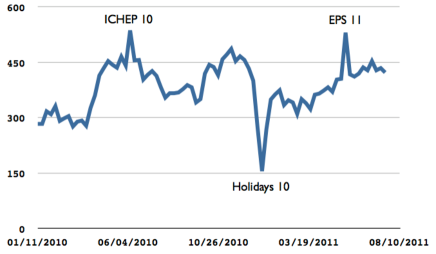
Meanwhile, the user community continues to grow. Figure 8 shows the number of unique analysis users in the CMS distributed computing system over the past year and a half. It is steadily growing, modulo peaks and valleys that can be correlated with important events on the particle-physics calendar. A significant fraction of the collaboration, about 800 users/month, is making use of grid resources.
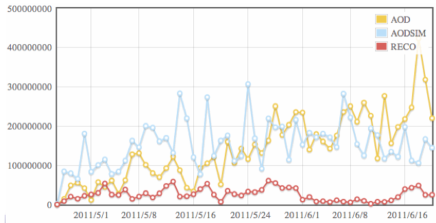
As noted in the previous section, it was imperative that analysis users start to move towards using the more compact AOD format for their work CMS was to stay within the available computing resources. Tools have recently been developed to track dataset usage in greater detail. These tools indicate that the migration is indeed happening as planned, as shown in Figure 9. Another experiment previously had these tracking tools; CMS is looking forward to using them to help manage dataset distribution and more.
The operation of the grid sites for analysis will improve with some technology developments that will be deployed shortly in CMS. The CMS Remote Analysis Builder (CRAB) bib:CRAB that analysts use to submit jobs will soon have a significant revision. WMAgent will be installed underneath to take advantage of its features. As a result, the user interface will change, requiring some user re-education. Also, the greater use of pilot jobs (or “glide-ins”) for analysis is anticipated. This could allow for a prioritization of user jobs across the distributed system, not just at individual sites, and could also have potential for balancing usage across sites.
IV Any Data, Anytime, Anywhere222The author of this paper coined this phrase, and continues efforts to firmly establish the primacy of his claim.
One fact that has emerged from the operation of the CMS distributed computing infrastructure for data analysis is that a key limitation of the computing model is that CPU and storage must be co-located; a dataset must effectivly reside on a disk that is in the same room as the compute node that runs the program that analyzes the dataset. Thus, the data must be placed where the processing resources are. This is difficult to optimize, as that relies on having some sense of analyst preferences of datasets and sites.
However, we now know that wide-area networking is more reliable than was anticipated when the original MONARC model bib:MONARC was developed. There, dataset transfer between sites was avoided as much as possible. At the same time, CMS has made much progress in optimizing the reading of data files over the network, so that there is very little additional cost compared to reading a file in the same room.
Thus, one is inclined to forget co-location and to think big. What if users could analyze data in one place with a CPU that is in another place? In such a scheme, data placement would hardly matter anymore, as any data would be available anytime, anywhere. Users could be insulated from storage problems at sites; if a file was corrupt at one site, there could be a straighforward and quiet failover to the newtork for access of the same file at a different site. Participation in data analysis could be broadened by enabling users who do not have large storage systems, as those users could still have access to any data. The dream of a “diskless Tier-3” site becomes realistic. Also, it would be straightforward to access data with cloud resources, should that become cost-competitive.
Prototype systems for such a scheme have already been deployed, using the Xrootd technology bib:xrootd . A key element is redirectors that allow jobs to find data at remote sites without any action from the user. The US CMS Tier-2 sites have been configured so that a failed file access at a site will fall back to reading the file from another site using the redirector over the wide-area network. There is still much work to be done to test and operate the system at the needed scale, and to develop monitoring, accounting and throttling systems. In related work, CMS is also exploring how to migrate jobs between sites to optimize the use of processing resources.
V Remarks and outlook
The actual use of CMS computing in 2011 has been largely in line with the model that was created based on 2010 experience. Some of the parameters have ended up being higher or lower, within about 20%, but the variances have tended to compensate each other. The model does predict that CMS will be limited by its computing resources during this year. Early indications of these limitations were already being seen in the run-up to this summer’s conferences. Some analyses were slowed by the wait for simulation samples, and there has been significant demand for processing resources at Tier 2. If CERN chooses to run the LHC at very high luminosity, this could get worse still. At this writing, in mid-September 2011, the situation is still quite fluid. Physicists will need to adapt to this new environment. However, all of this should be taken as good news – the resource limitations reflect the fact that the LHC datasets are growing rapidly, and provide the opportunity for the discovery of new physics.
We can conclude that 2010 was an extremely good year for CMS computing. The distributed system was a strategic asset for producing physics results, and no one has ever complained that their work was limited by the available computing. It is important to keep in perspective that the operational scales of everyday operations were considered “bleeding edge” just a few years ago. This strong performance has continued in 2011, but CMS has now entered an era of resource constraints. Fortunately, continuing technology developments have given some operational breathing room, and some of these advances have the potential to change the paradigm of computing at the LHC, and for data-intensive, high-throughput computing in general.
Acknowledgements.
I thank Ian Fisk for his advice in preparing the talk and his general comprehensive knowledge of CMS computing. I also thank the organizers of the DPF 2011 conference for an engaging and enjoyable week.References
- (1) See http://public.web.cern.ch/public/en/LHC/LHC-en.html for many details.
- (2) R. Adolphi et al. (CMS Collaboration), “The CMS experiment at the CERN LHC,” Journal of Instrumentation 3, S08004 (2008).
- (3) C. Grandi, D. Stickland, L. Taylor. et al., “The CMS Computing Model,” CERN-LHCC-2004-035 (2004).
- (4) K. Bloom, “The CMS Computing System: Successes and Challenges,” Proceedings of the DPF-2009 Conference, Detroit, MI (2009).
- (5) M. Michelotto, “A comparison of HEP code with SPEC benchmark on multicore worker nodes,” Proceedings of Computing in High Energy Physics (CHEP09), Prague, Czech Republic (2009).
- (6) J. Knobloch, L. Robertson et al., “LHC Computing Grid Techical Design Report,” CERN-LHCC-2005-024 (2005).
- (7) F. van Lingen et al., “Job life cycle management libraries for CMS workflow management projects,” Proceedings of Computing in High Energy Physics (CHEP09), Prague, Czech Republic (2009).
- (8) D. Spiga et al., “Automation of user analysis workflow in CMS,” Proceedings of Computing in High Energy Physics (CHEP09), Prague, Czech Republic (2009).
- (9) See http://monarc.web.cern.ch/MONARC/ for a variety of documents on this topic.
- (10) A. Doriga, et al., “XROOTD/TXNetFile: a highly scalable architecture for data access in the ROOT environment”, Proceedings of the 4th WSEAS international Conference on Telecommunications and informatics, March 2005, Prague, Czech Republic.