Evolution of normal and superconducting properties of single crystals of Na1-δFeAs upon interaction with environment
Abstract
Iron-arsenide superconductor Na1-δFeAs is highly reactive with the environment. Due to the high mobility of Na ions, this reaction affects the entire bulk of the crystals and leads an to effective stoichiometry change. Here we use this effect to study the doping evolution of normal and superconducting properties of the same single crystals. Controlled reaction with air increases the superconducting transition temperature, , from the initial value of 12 K to 27 K as probed by transport and magnetic measurements. Similar effects are observed in samples reacted with Apiezon N-grease, which slows down the reaction rate and results in more homogeneous samples. In both cases the temperature dependent resistivity, , shows a dramatic change with exposure time. In freshly prepared samples, reveals clear features at the tetragonal-to-orthorhombic ( 60 K) and antiferromagnetic (=45 K) transitions and superconductivity with onset =16 K and offset =12 K. The exposed samples show linear variation of above =30 K (=26 K), suggesting bulk character of the observed doping evolution and implying the existence of a quantum critical point at the optimal doping. The resistivity for different doping levels is affected below 200 K suggesting the existence of a characteristic energy scale that terminates the linear regime, which could be identified with a pseudogap.
pacs:
74.70.Dd,72.15.-v,74.25.JbI Introduction
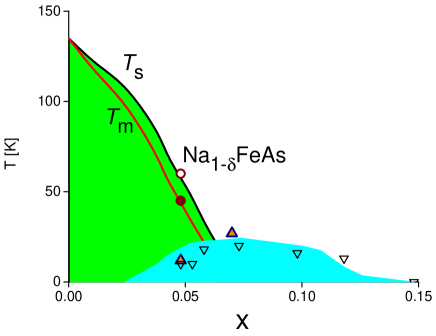
In the generic phase diagram of FeAs-based materials, domain of superconductivity has maximum close to a quantum critical point of the magnetic order, see Fig. 1, suggestive of a magnetically mediated mechanism of superconductivity.Monthoux ; MazinNature Quantum fluctuations lead to a characteristic linear temperature dependence of electrical resistivity, , and its evolution towards a Fermi-liquid behavior with doping (see Ref. [Louis, ] for a review). Both these features are observed in iron pnictides, most clearly in the electron doped Ba(Fe1-xCox)2As2 (BaCo122 in the following) NDL and in isoelectron doped BaFe2(As1-xPx)2.MatsudaQCP In hole-doped (Ba1-xKx)Fe2As2 (BaK122, in the following)Rotter resistivity also shows a limited range of close to linear variation above , however, terminated at high-temperatures by a tendency to saturation. Wencrystals ; Zverev Similar slope changes are found in both in-plane and inter-plane resistivity of self-doped LiFeAs LiFeAsAPLKorea ; TanatarLiFeAs , and is a dominant feature in the inter-plane resistivity, , of transition metal doped BaTM122pseudogap ; pseudogap2 where, by comparison with NMR dataNMRPG , it was associated with the formation of a pseudogap. Similar association was suggested for the explanation of both in- and inter-plane resistivity in BaK122.BaKresistivity
Na1-δFeAs (Na111 in the following) is isostructural to LiFeAs (Li111 in the following); however, in its stoichiometric form, , it is representative of an underdoped part of the superconducting phase diagram, revealing coexisting superconducting (=12 K), magnetic (=45 K), and orthorhombic (=55 K) phases. NaFeAsPRL102 ; NaFeAsPRL104 ; NaFeAsNMR ; NaFeAsneutrons In line with this conclusion, superconductivity in Na111 can be enhanced with pressure pressure-NaFeAs and Co-doping. NaFeAsPRL104 The phenomenology of split structural and magnetic transitions and coexisting superconductivity is reminiscent of BaCo122.NiNiCo ; Pratt In contrast with Li111, Na111 can be prepared with Na deficiency, allowing for some control of the Na stoichiometry.Chu ; Todorov Due to the high mobility of Na atoms at room temperature, Na can be removed from the sample by controlled oxidative deintercalation reaction with the environment.Todorov Here we use this effect to study the evolution of the magnetic susceptibility and the temperature-dependent in-plane resistivity, , in the same single crystals of NaFeAs as a function of Na content. Our main finding is the observation of linear resistivity at the optimal doping achieved by the environmental deintercalation, suggesting the universality of a quantum critical scenario in iron-pnictide superconductors. We find that the temperature range of this linear dependence is bound from the high-temperature side by the pseudogap feature, quite similar to BaK122. The pseudogap affects even in the parent composition.
II Experimental
Single crystals of NaFeAs were grown by sealing a mixture of Na, Fe and As together in Ta tubes and cooking at 950 C , followed by 5 C/hour cool-down to 900 C.crystalgrowthPRL105 Samples were stored and transported in sealed containers filled with an inert gas. Preparation of samples for dipper tunnel diode resonator (TDR) and resistivity measurements was done in air as quickly as possible (typically about 5 minutes). The leftovers of unreacted sodium cause intense reaction on the surface of some samples. However, cleaved internal parts of single crystals do not show any visible reaction and turns out to be relatively stable. After sample preparation, samples were measured and stored in a dry, inert environment.
Samples for in-plane resistivity measurements had typical dimensions of (1- 2)0.5(0.02-0.1) mm3. All sample dimensions were measured with an accuracy of about 10%. Contacts for four-probe resistivity measurements were made by soldering 50 m silver wires with ultra-pure Sn solder, as described in Ref. [SUST, ]. This technique produced contact resistance typically in the 10 range. Resistivity measurements were performed in Quantum Design PPMS.
After initial resistivity measurements, samples were left mounted on a PPMS puck in air and measurements were repeated after several controlled exposures to air. Some samples, after initial preparation, were covered with Apiezon N-grease, a technique which was used to preserve Li111 in our previous studies.HyunsooLiFeAs ; TanatarLiFeAs In the case of Na111 we found that Apiezon N-grease does not prevent the sample from losing Na, but slows it down giving a better control of sample property variation, especially in combination with the ultrasonic treatment.
DC magnetic measurements were performed with a Quantum Design MPMS on a freshly cleaved sample. AC magnetic characterization was performed with a tunnel-diode resonator (TDR)Vandegrift ; Prozorov2000 , - a self-oscillating tank circuit powered by a properly biased tunnel diode. Samples were mounted on a sapphire rod and inserted in the inductor coil. The measured frequency shift is proportional to differential magnetic susceptibility of the sample.Prozorov2000 For quick mounting and measurement protocols, we used a simplified version of the TDR susceptometer (a “dipper”), which is inserted directly into the transport 4He dewar. The trade-off is reduced stability and higher temperature-dependent background as compared to our high-stability 3He and dilution refrigerator versions of the TDR susceptometer. Nevertheless, the “dipper” is perfectly suitable to study magnetic signature of the superconducting transition, especially when a quick turn-around is required.
III Results
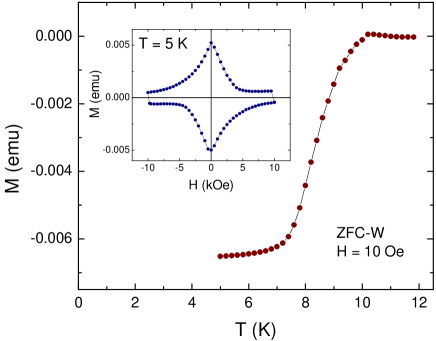
Figure 2 shows the temperature - dependent DC magnetization of a freshly cleaved sample measured upon warming after cooling in zero magnetic field and applying a 10 Oe field (ZFC-W). The magnetic hysteresis loop measured at 5 K in the same sample is shown in the inset. Both results are quite characteristic of bulk superconductivity showing robust screening and significant pinning. Moreover, as we show below by direct polarized-light imaging and resistivity measurements, this bulk superconductivity coexists with structural and magnetic long-range order.
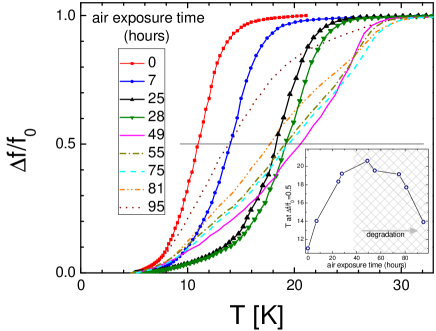
Figure 3 shows the temperature dependence of the normalized frequency shift (proportional to magnetic susceptibility) in single crystal sample of Na111 as a function of exposure time to air. Here is the frequency shift at . After initial preparation, the sample shows a quite sharp superconducting transition with the onset at 13 K. Air exposure for up to 28 hours shifts the transition to 24 K, almost parallel to the initial curve and does not broaden the transition. This observation suggests that the effect is truely bulk in nature, since close to , where the London penetration depth diverges, the penetration of rf field into the sample is determined by the smaller of two characteristic length scales, - skin depth in the normal state and characteristic sample dimension, both of the order of 100 m in this case. Upon further exposure to air, the onset temperature of the superconducting transition continues to rise until reaching the maximum value of 28 K, however, the transition broadens, and additional features start to appear at lower temperatures, suggesting that the sample becomes inhomogeneous and starts to decompose into NaFe2As2.Todorov The experiment with air exposure was repeated on a total of five samples and consistently produced the same result.
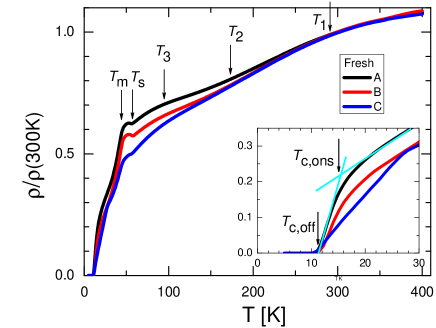
Temperature-dependent resistivity of three “fresh” crystals of Na111 is shown in Fig. 4 using a normalized resistivity scale, . The resistivity value at room temperature, , shows notable scatter between 200 to 400 cm, presumably due to the effect of hidden cracks on the effective sample geometric factor.NiNiCo ; anisotropy These values of are comparable within the error bars to the value of 300 cm, typical for parent Alloul ; anisotropy2 and hole-doped BaK122 compounds BaKresistivity ; BaKresistivityWen , as well as for Li111 HyunsooLiFeAs , and is notably lower than the previously reported value of above 4500 cm.NaFeAsPRL102 The temperature dependence of the resistivity of the three fresh samples A, B and C is very close, with some difference potentially coming from the difference in time of air exposure during sample preparation and contact making. The air exposure can also be responsible for smoother features in the temperature-dependent resistivity in this study compared to the previous study. NaFeAsPRL102 On cooling, of fresh samples reveals three broad resistivity slope changes at 290 K, 180 K and 90 K, a small upturn on cooling below 56 K, a sharp downturn below 45 K and a superconducting transition with onset at 14 K (sample A) and offset at 12 K. Both onset and offset temperatures were determined as crossing points of linear extrapolations above, at, and below the transition as shown for in inset in Fig. 4. The onset temperature of resistive transition in sample C shifts to 26 K, showing that it is indeed more exposed to initial degradation during sample preparation.
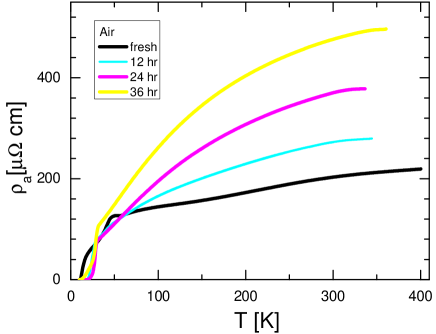
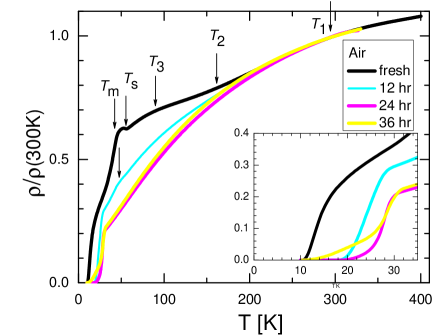
Fig. 5 shows the evolution of the temperature-dependent resistivity, , in samples of Na111 during exposure to air with total exposure time up to 36 hours, during which sample properties change homogeneously in the TDR experiments, see Fig. 3. The top panel shows the evolution of sample resistivity, while the bottom panel shows the same data plotted using a normalized resistivity scale, , and a zoom of the superconducting transition area. It is clear that the environmental reaction changes the bulk properties of the sample, grossly affecting its normal state . On the other hand, air exposure monotonically increases , suggesting development of macroscopic defects (most likely cracks) during Na deintercalation. Plotting the data on the normalized scale removes the variation of the geometric factor due to cracks and reveals very peculiar transformation of the temperature-dependent resistivity. First, all four curves coincide above approximately 200 K, consistent with the idea that the variation of value comes predominantly from the variation of the geometric factor and that the variation of doping level plays only a minor role. Second, below 200 K the curve systematically decreases with air exposure. Indeed, even unscaled resistivity values decrease causing curves crossing in Fig. 5b. With the exposure time of 12 hours, the small resistive increase at becomes indistinguishable, while the rapid downturn below shifts to lower temperatures as expected for the increased doping level, and rises to 30 K while rises to 20 K. For a 24 hour exposure time, the curve shows the sharpest superconducting transition with the onset at 30 K, crosses zero at 26 K, and a tail at the end of the transition with actual zero reached at 20 K. With further exposure increase to 36 hours, the tail belowthe transition develops further, in broad accordance of the characteristic time scale with sample degradation in TDR measurements, Fig. 3.
Together with suppression of the structural transition and an increase of the superconducting transition, the crossover features in resistivity at become completely indistinguishable in a 12 hour curve, while the resistivity variation through changes from a slight slope decrease on cooling in fresh samples to the onset of a rapid resistivity decrease in exposed samples. Interestingly, becomes -linear above in samples with a 24 hour exposure, while the high-temperature end of the -linear range is close to .
In Fig. 6 we show the evolution of the TDR magnetic susceptibility in samples stored in Apiezon N-grease and subjected to ultrasonic treatment to facilitate Na diffusion between dipper runs. While grease protects samples from air, it does not stop Na deintercalation, which now leads to a much higher quality of the superconducting transition without additional features and only minor broadening.
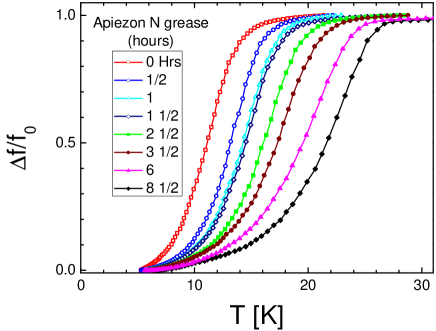
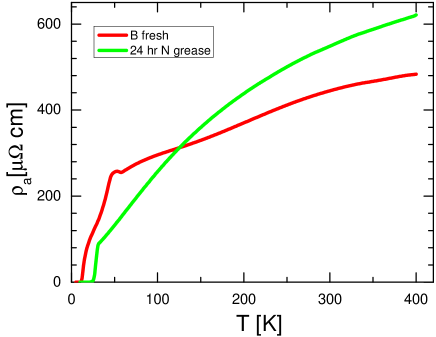
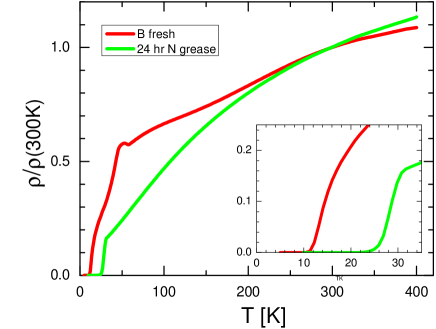
Figure 7 shows electrical resistivity of samples covered with Apiezon N-grease after initial preparation. Between two measurements sample was left on a PPMS puck in air for 24 hours. Temperature-dependent sample resistivity is shown in the top panel of Fig. 7, while the same data on a normalized resistivity scale, , and a zoom of the superconducting transition are shown in the bottom panel. Exposure of the sample to Apiezon N-grease moderately increases and produces a sample of much better quality judging by a superconducting transition, with 30 K and 26 with actual zero resistance achieved at 24 K.
IV Discussion
IV.1 Structural/magnetic ordering and resistivity
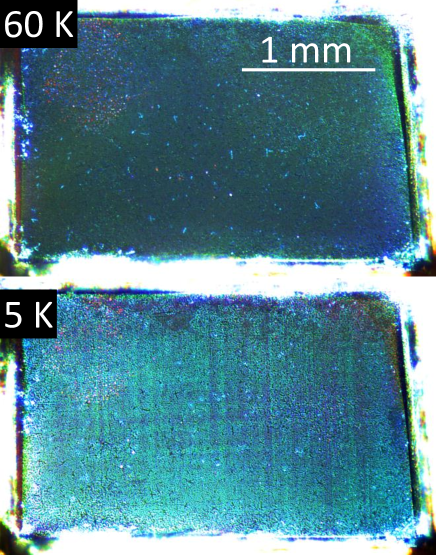
Figure 8 shows polarized light images of the freshly cleaved surface of the sample used in DC magnetization measurements shown in Fig. 2. The top panel was obtained at 60 K (above the magnetic/structural transition), whereas the bottom panel shows an image taken at 5 K (well below the transitions). It reveals a clear pattern of structural domains, providing direct evidence for the occurrence of the tetragonal to orthorhombic structural transition in our samples. Considering the upturn anomaly in at 56 K (structural transition) and downturn anomaly at 40 K (magnetic transition) measured on another piece of the same crystal, Fig. 7, we conclude that freshly cleaved samples exhibit bulk coexistence of superconductivity, magnetism and orthorombic structural distortion.
On the other hand, resistivity in the fresh samples rapidly decreases below a temperature of the magnetic transition, showing that magnetic fluctuations contribute significantly to the inelastic scattering above .detwinning
IV.2 Evaluation of the doping level change
In Na1-δFeAs, similar to BaFe2As2, doping can be accomplished by substitution of Fe by Co NaFeAsPRL104 , P-substitution of As P-NaFeAs , as well as pressure.pressure-NaFeAs Because loss of Na is equivalent to Co substitution, both adding extra electron, it is natural to expect that similar compositional variations are involved. In Fig. 1 we compare the phase diagram of BaCo122 with that of NaFeAs, using the structural transition temperature as a matching criterion. This way Na1-δFeAs in its “fresh” state corresponds to =0.048 in BaCo122, while at optimal doping Na1-δFeAs corresponds to =0.07 in BaCo122. This difference, =0.022 is very close to the actual Co-doping required to induce the highest =25 K in Na1-δFeAs.NaFeAsPRL104 This comparison suggest that in our samples is of the same order, 0.02.
IV.3 Evolution of the temperature-dependent resistivity in 111 compounds
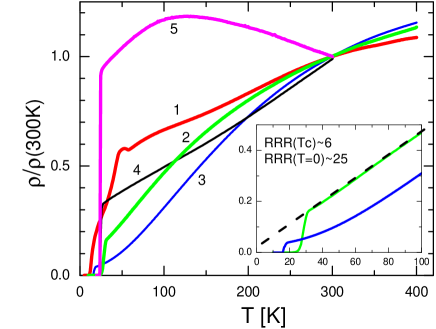
Figure 9 shows temperature-dependent resistivity in a 111 system. We plot the data for fresh NaFeAs, grease treated optimally doped Na1-δFeAs and LiFeAs, representative of the overdoped compositions. For comparison, we show temperature dependence in optimally doped BaCo122. Note that despite macroscopic damage of the crystal during deintercalation, non-stochiometric composition shows quite a high residual resistivity ratio, with 6 and 25. This is notably higher than in BaCo122 with 3, suggestive that doping into the Fe sites introduces much stronger disorder than the formation of Na vacancies. As can be seen from the inset in Fig. 9, at the optimal doping, in Na111 is purely linear above , which should be contrasted with a quadratic temperature dependence observed in LiFeAs.HyunsooLiFeAs ; TanatarLiFeAs In the case of Na111 the temperature range of -linear dependence is bound from the high-temperature side by a downward slope change on heating, similar to the case of a hole doped BaK122.
Our findings of doping-independent resistivity at high temperatures, which are particularly clear for air treated samples, are very difficult to explain in a model of additive contributions of two different bands into conductivity. We suggest that a broad crossover in at around 200 K has a similar origin as a broad crossover in -axis transport in BaCo122, where this effect correlates well with the NMR observations of a pseudogap and with the domain of linear magnetic susceptibility.pseudogap It is interesting that the pseudogap crossover does not affect in-plane transport in electron-doped BaCo122, but strongly affects electron-doped Na1-δFeAs and hole doped BaK122. Finally, we point out a very pronounced branching in the temperature-dependent resistivity, coinciding with the end of the pseudogap resistivity crossover. This feature suggests that the electronic structure of the compounds is affected at temperatures much higher than the temperatures of structural and magnetic transitions, a feature hard to reconcile with simple spin density wave ordering models. It brings some similarity to a pronounced strain-induced anisotropy well above structural and magnetic transitions Fisher in the equivalent doping range in BaCo122.
V Conclusions
We used the naturally occurring oxidative deintercalation procedure to fine - tune the doping level of the Na1-δFeAs system from underdoped to optimally doped. Analyzing DC and AC magnetization, direct optical imaging and temperature - dependent resistivity, we conclude that freshly cleaved samples exhibit bulk coexistence of superconductivity, magnetism and orthorombic structural distortion and can be placed on the underdoped side of the effective phase diagram. The oxidative deintercalation results in a shift of the composition towards the effective optimal doping. Measurements of the in-plane resistivity show that the difference between fresh () and non-stoichiometric states of the crystals starts at about 200 K, much higher than the temperature of the structural/magnetic transitions, K and K. This temperature is of the same order as the temperature of a broad crossover, found in resistivity measurements in all 111 compounds, which we relate to the formation of a pseudogap. At the optimal doping, the resistivity of Na1-δFeAs shows an extended range of linear behavior, in line with the expectations of quantum-critical scenario Monthoux , however, this range is bound on the high-temperature side by the onset of a pseudogap crossover.
VI Acknowledgements
We thank Seyeon Park for her help with the dipper measurements. Work at the Ames Laboratory was supported by the Department of Energy-Basic Energy Sciences under Contract No. DE-AC02-07CH11358. The single crystal growth effort at UT is supported by U.S. DOE BES under Grant No. DE-FG02-05ER46202 (P.D.).
References
- (1) P. Monthoux, D. Pines, and G. G. Lonzarich, Nature 450, 1177 (2007).
- (2) I. I. Mazin, Nature 464, 183 (2010).
- (3) L. Taillefer, Ann. Rev. Condensed Matter Physics 1, 51 (2010).
- (4) N. Doiron-Leyraud, P. Auban-Senzier, S. René de Cotret, C. Bourbonnais, D. Jérome, K. Bechgaard, and L. Taillefer, Phys. Rev. B 80, 214531 (2009).
- (5) Y. Nakai, T. Iye, S. Kitagawa, K. Ishida, H. Ikeda, S. Kasahara, H. Shishido, T. Shibauchi, Y. Matsuda, and T. Terashima, Phys. Rev. Lett.105, 107003 (2010).
- (6) M. Rotter, M. Tegel, and D. Johrendt, Phys. Rev. Lett.101, 107006 (2008).
- (7) H. Q. Luo, Z. S. Wang, H. Yang, P. Cheng, X. Zhu, and H.-H. Wen, Supercond. Sci. Technol. 21, 125014 (2008).
- (8) A.A.Golubov, O.V.Dolgov, A.V.Boris, A.Charnukha, D.L.Sun, C.T.Lin, A.F.Shevchun, A.V.Korobenko, M.R.Trunin, V.N.Zverev arXiv:1011.1900
- (9) Y. J. Song, J. S. Ghim, B. H. Min, Y. S. Kwon, M. H. Jung, and J.-S. Rhyee, Appl. Phys. Lett. 96, 212508 (2010).
- (10) M. A. Tanatar, J.-Ph. Reid, S. Ren de Cotret, N. Doiron-Leyraud, F. Lalibert, E. Hassinger, J. Chang, H. Kim, K. Cho, Yoo Jang Song, Yong Seung Kwon, R. Prozorov, and Louis Taillefer, Phys. Rev. B 84, 054507 (2011).
- (11) Hyunsoo Kim, M. A. Tanatar, Yoo Jung Song, Yong Seung Kwon, and R. Prozorov, Phys. Rev. B 83, 100502 (2011).
- (12) C. T. Vandegrift, Rev. Sci. Instr. 46, 599 (1975).
- (13) R. Prozorov, R. Giannetta, A. Carrington and F. Araujo-Moreira, Phys. Rev. B62, 115 (2000).
- (14) M. A. Tanatar, N. Ni, A. Thaler, S. L. Bud’ko, P. C. Canfield, and R. Prozorov, Phys. Rev. B 82, 134528 (2010).
- (15) M. A. Tanatar, N. Ni, A. Thaler, S. L. Bud’ko, P. C. Canfield, and R. Prozorov, Phys. Rev. B 84, 014519 (2011).
- (16) F. L. Ning, K. Ahilan, T. Imai, A. S. Sefat, M. A. McGuire, B. C. Sales, D. Mandrus, P. Cheng, B. Shen, and H.-H Wen, Phys. Rev. Lett. 104, 037001 (2010).
- (17) M. A. Tanatar, E. C. Blomberg, Hyunsoo Kim, Kyuil Cho, W. E. Straszheim, Bing Shen, Hai-Hu Wen, R. Prozorov, arXiv:1106.0533
- (18) D. K. Pratt, W. Tian, A. Kreyssig, J. L. Zarestky, S. Nandi, N. Ni, S. L. Bud’ko, P. C. Canfield, A. I. Goldman, and R. J. McQueeney, Phys. Rev. Lett. 103, 087001 (2009).
- (19) G. F. Chen, W. Z. Hu, J. L. Luo, and N. L. Wang, Phys. Rev. Lett. 102, 227004 (2009).
- (20) D. R. Parker, M. J. P. Smith, T. Lancaster, A. J. Steele, I. Franke, P. J. Baker, F. L. Pratt, M. J. Pitcher, S. J. Blundell, and S. J. Clarke, Phys. Rev. Lett. 104, 057004 (2010).
- (21) L. Ma, G. F. Chen, Dao-Xin Yao, J. Zhang, S. Zhang, T.-L. Xia, and Weiqiang Yu, Phys. Rev. B 83, 132501 (2010).
- (22) Shiliang Li, Clarina de la Cruz, Q. Huang, G. F. Chen, T.-L. Xia, J. L. Luo, N. L. Wang, and Pengcheng Dai, Phys. Rev. B 80, 020504 (2009).
- (23) X. C. Wang, S.J. Zhang, Q. Q. Liu, Z. Deng, Y. X. Lv, J. L. Zhu, S. M. Feng, C. Q. Jin, High Pressure Research 31, 7 (2011).
- (24) N. Ni, M. E. Tillman, J.-Q. Yan, A. Kracher, S. T. Hannahs, S. L. Bud’ko, and P. C. Canfield, Phys. Rev. B 78, 214515 (2008).
- (25) K. Sasmal, B. Lv, Z. J. Tang, F. Chen, Y. Y. Xue, B. Lorenz, A. M. Guloy, and C. W. Chu, Phys. Rev. B 79, 184516 (2009).
- (26) I. Todorov, D. Y. Chung, H. Claus, C. D. Malliakas, A. P. Douvalis, T. Bakas, J. Q. He, V. P. Dravid, and M. G. Kanatzidis, Chem. Mater. 22, 3916 (2010).
- (27) C. He, Y. Zhang, B. P. Xie, X. F. Wang, L. X. Yang, B. Zhou, F. Chen, M. Arita, K. Shimada, H. Namatame, M. Taniguchi, X. H. Chen, J. P. Hu, and D. L. Feng, Phys. Rev. Lett. 105, 117002 (2010).
- (28) M. A. Tanatar, N. Ni, S. L. Bud’ko, P. C. Canfield, and R. Prozorov, Supercond. Sci. Technol. 23, 054002 (2010).
- (29) M. A. Tanatar, N. Ni, C. Martin, R. T. Gordon, H. Kim, V. G. Kogan, G. D. Samolyuk, S. L. Bud’ko, P. C. Canfield, and R. Prozorov, Phys. Rev. B 79, 094507 (2009).
- (30) F. Rullier-Albenque, D. Colson, A. Forget, and H. Alloul Phys. Rev. Lett. 103,057001 (2009).
- (31) M. A. Tanatar, N. Ni, G. D. Samolyuk, S. L. Bud’ko, P. C. Canfield, and R. Prozorov, Phys. Rev. B 79, 134528 (2009)
- (32) Bing Shen, Huan Yang, Zhao-Sheng Wang, Fei Han, Bin Zeng, Lei Shan, Cong Ren, Hai-Hu Wen arXiv:1106.4256
- (33) M. A. Tanatar, E. C. Blomberg, A. Kreyssig, M. G. Kim, N. Ni, A. Thaler, S. L. Bud’ko, P. C. Canfield, A. I. Goldman, I. I. Mazin, and R. Prozorov, Phys. Rev. B 81, 184508 (2010).
- (34) T.-L. Xia, J. B. He, D. M. Wang, and G. F. Chen, arXiv:1001.3311
- (35) X. C. Wang, S.J. Zhang, Q. Q. Liu, Z. Deng, Y. X. Lv, J. L. Zhu, S. M. Feng, C. Q. Jin, High Pressure Research 31, 7 (2011).
- (36) Jiun-Haw Chu, J. G. Analytis, K. De Greve, P. L. McMahon, Z. Islam, Y. Yamamoto, and I. R. Fisher, Science 329, 824 (2010).