Recent BaBar Studies of Bottomonium States
Abstract
We present studies in bottomonium spectroscopy carried out with samples of million and million events recorded with the BaBar detector at the PEP-II asymmetric-energy collider at SLAC. Precise measurements of the branching fractions for and transitions, and searches for radiative decay to the and states are performed using photons that have converted into an pair. In addition, we summarize the results of a search for the spin-singlet partner of the triplet, the state of bottomonium, in the transitions and .
I Introduction
Bottomonia are the heaviest of the bound states. Decays within the bottomonium family of states occur via , , or di-pion emission, or by electric dipole transitions or magnetic dipole transitions. Electromagnetic transitions between the energy levels of the bottomonium spectrum can be calculated in the quark model and are an important tool in understanding the internal structure of bound states. In particular, the measurement of the hyperfine mass splittings between triplet and singlet states is paramount to understanding the role of spin-spin interactions in quarkonium models and in testing QCD calculations. In the non-relativistic approximation, the hyperfine splitting is proportional to the square of the wave function at the origin, which is expected to be non-zero only for , where is the orbital angular momentum quantum number of the system.
In particular, the mass splitting between the and the is a key ingredient in many theoretical calculations. The value measured by BaBar, MeV/ babar_etab1 ; babar_etab2 and subsequently by CLEO cleo_etab is larger than most predictions based on potential models QWG-YR , but in reasonable agreement with predictions from lattice calculations Gray:2005ur . According to ref. ref:A1 , the shift in measured compared to QCD predictions might be explained by the mixing of the with a CP-odd Higgs scalar. To test this model, a measurement of the width is essential, and this was one of the BaBar motivations for searching for the using photon conversions as described in Sec. 2.
For , the splitting between the spin-singlet () and the spin-averaged triplet state () is expected to be . The state of bottomonium, the , is the axial vector partner of the -wave states. Its expected mass, computed as the spin-weighted center of gravity of the states ref:PDG , is 9899.87 0.27 MeV/. Higher-order corrections might cause a small deviation from this value, but a hyperfine splitting larger than 1 MeV/ might be indicative of a vector component in the confinement potential ref:Rosner2002 . The hyperfine splitting for the charmonium state is measured by the BES and CLEO experiments ref:BEShc ; ref:CLEOhc0 ; ref:CLEOhc to be 0.1 MeV/. An even smaller splitting is expected for the much heavier bottomonium system ref:Rosner2002 .
The BaBar ref:babar experiment collected data at the narrow resonances in order to carry out detailed studies in bottomonium spectroscopy111These samples correspond to 14 fb-1 and 30 fb-1 of and data, respectively. .
We summarize the results of a study of radiative bottomonium transitions using conversions, and of searches for the state in decay babar_dipihb and decay babar_pi0hb .
II Study of radiative bottomonium transitions using conversions
The rate of conversion in the detector material, and of the reconstruction of the pairs is much lower than that for photons reconstructed using the BaBar electromagnetic calorimeter. However, the substantial improvement in energy resolution for photon conversions results in better separation of photon energy lines.
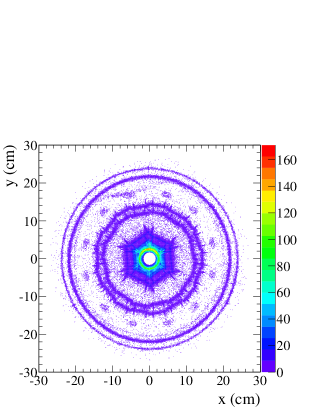
Photon conversions are reconstructed with a dedicated fitting algorithm that pairs oppositely charged particle tracks to form secondary vertices away from the interaction point. To remove internal conversions and Dalitz decays, and to improve signal purity, the conversion vertex radius is restricted to the beampipe, SVT, support tube, and inner wall of the DCH (see Fig. 1).
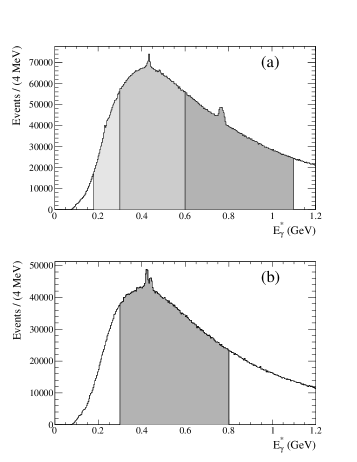
The data are divided into four energy ranges (see Fig. 2) corresponding to bottomonium transitions, in data,
-
•
MeV:
-
•
Mev: and
-
•
MeV: and
and in data,
-
•
MeV: and .
The photon energy () is analysed in the center-of-mass (CM) frame of the initial system. The photon spectra from subsequent boosted decays (e.g. ) are consequently affected by Doppler broadening due to the motion of the parent state in the CM frame. This broadening of the lineshapes of the various photon lines is incorporated into the fits used to extract the yields for the branching fractions obtained.
The number of signal events for a given bottomonium transition is extracted from the data by performing a fit to the distribution in 1 MeV intervals. The functional form and parameterization for each photon signal are determined from simulation. In general, the lineshape is related to a Crystal Ball function ref:CB , i.e. a Gaussian function with a power-law tail. This functional form is used to account for bremsstrahlung losses of the pair. The underlying smooth inclusive photon background is described by the product of a polynominal and an exponential function. This functional form adequately describes the background in each separate energy range.
The decays are observed, and precise measurements of the branching fractions for and decays obtained. The background-subtracted fit results are shown in Fig. 2. The product of branching fractions obtained from the fit of Fig. 2 are consistent with, and improve upon, the current values ref:PDG .
| Transition | Branching Fraction Measurement |
|---|---|
The searches for and states using the converted photon energy spectrum are largely inconclusive. Over a range of approximately MeV/, we find (at 90% C.L.). This value is consistent with, but does not improve upon, the upper limit obtained by CLEO cleo_inclusive . Due to low efficiency and high background levels, no evidence for is found. The most significant peaking structure seen in the energy region expected for the transition, if interpreted as an signal, trends toward recent potential model theory_etab_models and lattice theory_etab_lattice predictions. However, the small () signicance of the result is insufficient to measure the mass from the present analysis. Taking advantage of the improved resolution from a converted photon technique to make a definitive measurement of the mass and width will require much more data from future experiments.
The measured branching fractions obtained from the fits of Fig. 2 are listed in Table 1.
III The BaBar search for the in data
The state is expected to be produced in decay via or di-pion emission, and to undergo a subsequent transition to the , with branching fraction (BF) ref:Rosner2002 . The isospin-violating decay is expected to have a BF of about 0.1% ref:BFpredict ; ref:Godfrey , while theoretical predictions for the transition range from ref:BFpredict up to ref:standardmultipoleTuan ; ref:Kuang ; ref:kuangyan .
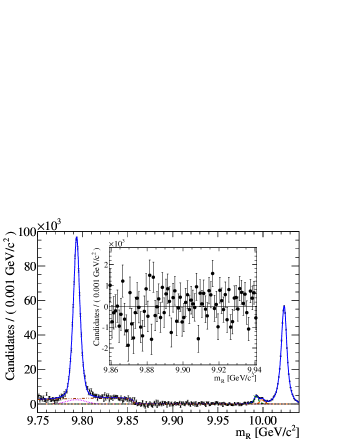
We search for a signal in the inclusive recoil mass distribution against di-pion () or () candidates.
III.1 The search for the in the decay
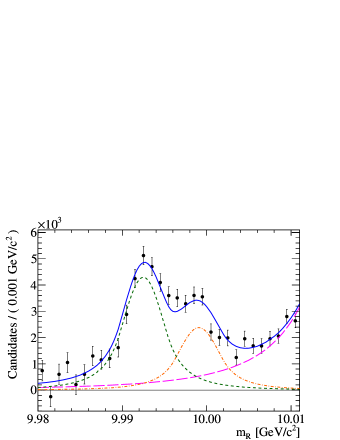
The signal is expected to appear as a peak in the distribution on top of a smooth non-peaking background from continuum events ( with ) and bottomonium decays. Several other processes produce peaks in the recoil mass spectrum close to the signal region. Hadronic transitions (hereafter denoted ) produce a peak centered at the mass ( GeV/ ref:PDG ). The cascade process , () results in a peak centered at GeV/. The peak is offset from the mass by approximately the to mass difference. Doppler shift and broadening further affect the position and width of this peak. When the parent in decays is produced through the channel, a pion from the decay can be combined with an oppositely-charged track from the decay to produce a broad distribution centered around GeV/. The is also produced through the initial-state radiation (ISR) process (). Of the nine possible , decay chains (), only those for have been reported ref:PDG ; these should generate two slightly separated peaks near GeV/, while the contributions with or with are expected to be negligible.
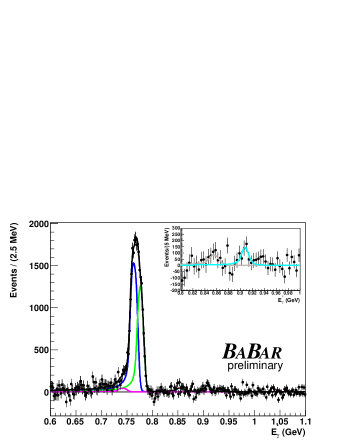
No signal is seen in the production channel. Assuming the mass to be GeV/, we set a 90% C.L. upper limit . We exclude, at 90% CL, values of above for a wide range of assumed mass values. These results disfavor the calculations of Refs. ref:standardmultipoleTuan ; ref:Kuang ; ref:kuangyan . Similarly, a recent measurement of the branching fraction ref:bab1d disfavors the calculations of Ref. ref:Kuang ; ref:kuangyan . The predictions of Ref. ref:Voloshin are at least one order of magnitude smaller and are not contradicted by our result.
Figure 3 shows the distribution of after subtraction of the non-peaking background. An expanded view of the region is shown on the right.
A branching fraction measurement improves over the current world average ref:PDG . Product branching fractions and are also obtained from this analysis. In addition, we obtain a measurement of MeV/ for the - mass difference.
III.2 Evidence for the in the decay
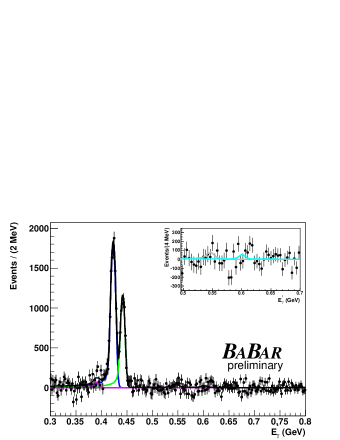
Evidence for the state is obtained in the decay , by requiring a photon with an energy consistent with that for the transition. The number of events in is determined from a fit to the distribution in each interval.
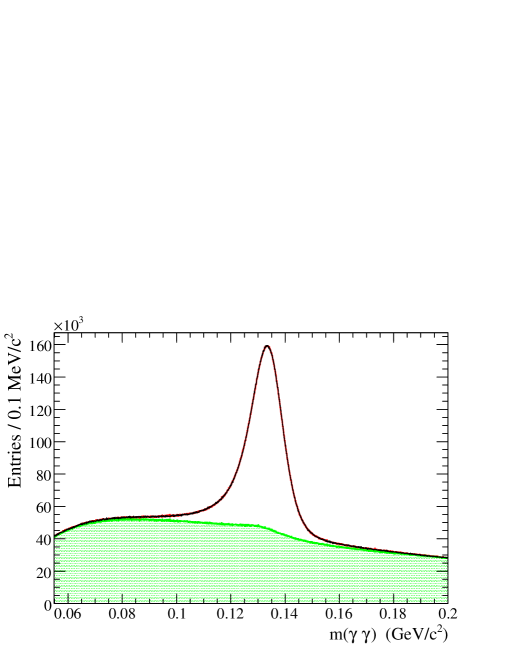
A candidate is reconstructed as a photon pair with invariant mass in the range 55–200 MeV/ (see Fig. 4). In the calculation of , the -pair invariant mass is constrained to the nominal value ref:PDG in order to improve the momentum resolution of the . We employ a simple set of criteria based on kinematic and event shape variables to suppress backgrounds. Photons from decays are a primary source of background in the region of the signal photon line from transitions. Similarly, many misreconstructed candidates result from the pairing of photons from different ’s. We impose the veto222A signal photon candidate is rejected if, when combined with another photon in the event (), the resulting invariant mass is within 15 MeV/ of the nominal mass; this is called a veto. condition on all photon candidates to improve the purity of the and photon candidate sample.
We obtain the distribution in 90 intervals of 3 MeV/ from 9.73 to 10 GeV/. For each interval, the spectrum consists of a signal above combinatorial background (see Fig. 4). We construct the spectrum by extracting the signal yield in each interval of from a fit to the distribution in that interval. The distribution is thus obtained as the fitted yield and its uncertainty for each interval of .
We use the MC background and MC -signal distributions directly in fitting the distributions in data. For each interval in MC, we obtain histograms in 0.1 MeV/ intervals of corresponding to the -signal and background distributions. The -signal distribution is obtained by requiring matching of the reconstructed to the generated ’s on a candidate-by-candidate basis (termed “truth-matching” in the following discussion). The histogram representing background is obtained by subtraction of the signal from the total distribution.
For both signal and background the qualitative changes in shape over the full range of are quite well reproduced by the MC. However, the signal distribution in data is slightly broader than in MC, and is peaked at a slightly higher mass value. The background shape also differs between data and MC. To address these differences, the MC signal is displaced in mass and smeared by a double Gaussian function with different mean and width values; the MC background distribution is weighted according to a polynomial in . The signal-shape and background-weighting parameter values are obtained from a fit to the distribution in data for the full range of . At each step in the fitting procedure, the signal and background distributions are normalized to unit area, and a between a linear combination of these MC histograms and the distribution in data is computed. The fit function provides an excellent description of the data (=1446/1433; =Number of Degrees of Freedom) and the fit result is essentially indistinguishable from the data histogram. The background distribution exhibits a small peak at the mass, due to interactions in the detector material of the type or that cannot be truth-matched. The normalization of this background to the non-peaking background is obtained from the MC simulation, which incorporates the results of detailed studies of interactions in the detector material performed using data ref:geant . This peak is displaced and smeared as for the primary signal.
The fits to the individual distributions are performed with the smearing and weighting parameters fixed to the values obtained from the fit shown in Fig. 4. In this process, the MC signal and background distributions for each interval are shifted, smeared, and weighted using the fixed parameter values, and then normalized to unit area. Thus, only the signal and background yields are free parameters in each fit. The fit to the data then gives the value and the uncertainty of the number of events in each interval.
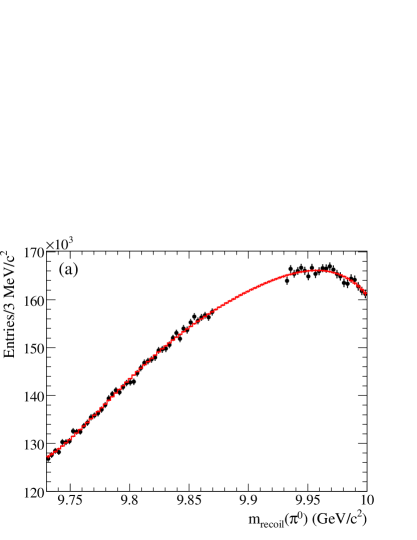
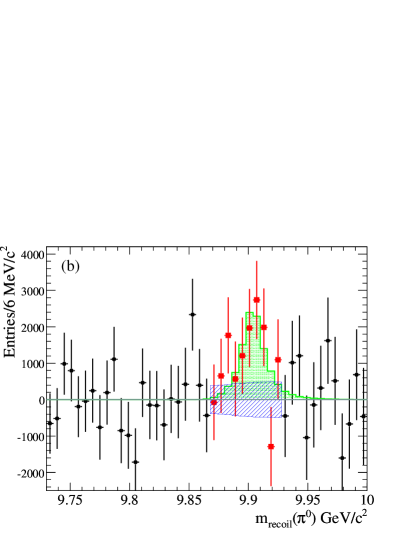
To search for an signal, we perform a binned fit to the ) distribution obtained in data. The signal function is represented by the sum of two Crystal Ball functions ref:CB with parameter values, other than the mass, , and the normalization, determined from simulated signal events. The background function is a fifth order polynomial, where parameter values are obtained from a fit which excludes the signal region (see Fig. 5(a)).
We then perform a fit over the signal region to search for an signal of the expected shape, taking account of the correlated uncertainties related to the polynomial interpolation procedure, but with the fitted values of the polynomial coefficient fixed.
In Fig. 5(b) we plot the difference between the distribution of and the fitted histogram of Fig. 5(a) over the entire region from 9.73 GeV/ to 10.00 GeV/; we have combined pairs of 3 MeV/ intervals from Fig. 5(a) for clarity.
The width of the observed signal is consistent with experimental resolution, and its significance is 3.3 , including systematic uncertainties. The measured mass value, (stat.)(syst.) MeV/, is consistent with the expectation for the bottomonium state, the axial vector partner of the triplet of states. We obtain the value for the product branching fraction .
This measurement combined with the expected rate for the transition ref:Rosner2002 would indicate that the is suppressed by a factor greater than 3 w.r.t. .
IV Conclusions
A study of radiative transitions between bottomonium states using photons that have been converted to pairs in the detector material led to the observation of decays, and to precise measurements of the branching fractions for and decays.
Studies of inclusive di-pion and transitions was carried out using events. While we find no evidence for the bottomonium spin-singlet state in the invariant mass distribution recoiling against the system, we obtain evidence at the 3.3 level for the in decay. Shortly after the BaBar search results were obtained, preliminary results of a search for the in the reaction () in data collected near the resonance were announced by the Belle Collaboration ref:Belle . The mass measured therein agrees very well with the value reported in this paper. It is interesting to note that the cross sections measured in the Belle analysis relative to the cross section are large, indicating an anomalous production rate for the and , and suggesting that these states are maybe produced via an exotic process that violates the suppression of heavy quark spin-flip.
References
- (1) B. Aubert et al. (BaBar Collaboration), Phys. Rev. Lett. 101, 071801 (2008).
- (2) B. Aubert et al. (BaBar Collaboration), Phys. Rev. Lett. 103, 161801 (2009).
- (3) G. Bonvicini et al. (CLEO Collaboration), Phys. Rev. D 81, 031104(R) (2010).
- (4) For a comprehensive review, see N. Brambilla et al., Eur.Phys.J.C 71, 1534 (2011).
- (5) A. Gray et al. [HPQCD and UKQCD Collaborations], Phys. Rev. D 72, 094507 (2005); T. Burch and C. Ehmann, Nucl. Phys. A 797, 33(2007); T.-W. Chiu et al. [TWQCD Collaboration] Phys. Lett. B 651, 171 (2007).
-
(6)
F. Domingo, U. Ellwanger, M.A. Sanchis-Lozano,
Phys. Rev. Lett. 103, 111802 (2009).
A.A. Penin, Nucl. Phys. Proc. Suppl. 205, 256 (2010). - (7) K. Nakamura et al. (Particle Data Group), Journal of Physics G 37, 075021 (2010).
- (8) S. Godfrey and J.L. Rosner, Phys. Rev. D 66, 014012 (2002); J.L. Rosner et al. (CLEO Collaboration), Phys. Rev. Lett. 95, 102003 (2005).
- (9) M. Ablikim et al. (BES Collaboration), Phys. Rev. Lett. 104, 132002 (2010).
- (10) J.L. Rosner et al. (CLEO Collaboration), Phys. Rev. Lett. 95, 102003 (2005); S. Dobbs et al. (CLEO Collaboration), Phys. Rev. Lett. 101, 182003 (2008).
- (11) G.S. Adams et al. (CLEO Collaboration), Phys. Rev. D 80, 051106 (2009).
- (12) B. Aubert et al. (BaBar Collaboration), Nucl. Instrum. Meth. A 479, 1 (2002).
- (13) J.P. Lees et al. (BaBar Collaboration), Phys. Rev. D 84, 011104(R) (2011)
- (14) J.P. Lees et al. (BaBar Collaboration), arXiv:1102.4564v2, submitted to Phys. Rev. D(R) (2011).
- (15) M. Artuso et al. (CLEO Collaboration), Phys. Rev. Lett. 94, 032001 (2005).
- (16) S. Recksiegel and Y. Sumino, Phys. Lett. B 578, 369 (2004); B.A. Kniehl et al., Phys. Rev. Lett. 92, 242001 (2004); ibid. 104, 199901(E) (2010).
- (17) A. Gray et al. (HPQCD and UKQCD Collaborations), Phys. Rev. D 72, 094507 (2005); T. Burch et al. (Fermilab and MILC Collaborations), Phys. Rev. D 81, 034508 (2010); S. Meinel, Phys. Rev. D 82, 114502 (2010).
- (18) M.B. Voloshin, Sov. J. Nucl. Phys. 43, 1011 (1986).
- (19) S. Godfrey, J. Phys. Conf. Ser. 9, 123 (2005).
- (20) S.F. Tuan, Mod. Phys. Lett. A 7, 3527 (1992)
- (21) T.M. Yan, S. F. Tuan and T. M. Yan, Phys. Rev. D 37, 1210 (1988).
- (22) Y.P. Kuang and T.M. Yan, Phys. Rev. D 24, 2874 (1981); Y.P. Kuang and T.M. Yan, Phys. Rev. D 41, 155 (1990).
- (23) P. del Amo Sanchez et al. (BaBar Collaboration), Phys. Rev. D 82, 111102 (2010).
- (24) M. B. Voloshin, Sov. J. Nucl. Phys. 43, 1011 (1986).
- (25) S. Agostinelli et al. (GEANT4 Collaboration), Nucl. Instrum. Meth. 506, 250 (2003); T. Sjstrand and M. Bengtsson, Computer Physics Commun. 43, 367 (1987).
- (26) M.J. Oreglia, Ph.D Thesis, SLAC-R-236 (1980); J.E. Gaiser, Ph.D Thesis, SLAC-R-255 (1982); T. Skwarnicki, Ph.D Thesis, DESY F31-86-02 (1986).
- (27) I. Adachi et al. (Belle Collaboration), arXiv:1103.3419v1.