Calibration and Performance of the ATLAS Muon Spectrometer
Abstract
The ATLAS muon spectrometer is designed to measure muon momenta with a resolution of 4% @ 100 GeV/c rising to 10% @ 1 TeV/c track momentum. The spectrometer consists of precision tracking and trigger chambers embedded in a 2T magnetic field generated by three large air-core superconducting toroids. The precision detectors provide 50 m tracking resolution to a pseudo-rapidity of 2.7. The system also includes an optical monitoring system which measures detector positions with 40 m precision. This paper reports on the calibration and performance of the ATLAS muon spectrometer.
I Introduction
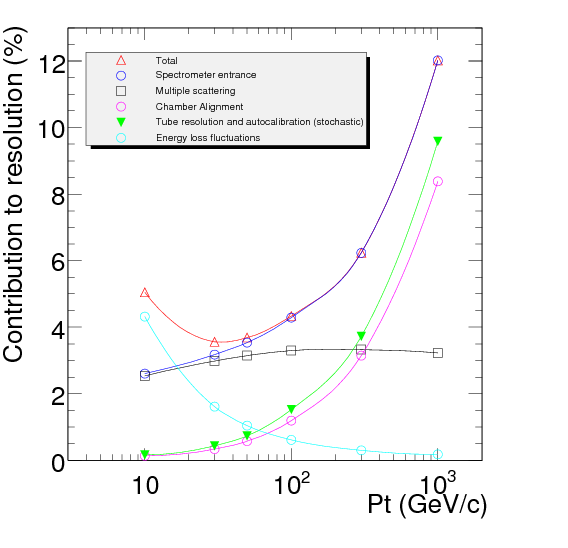
The ATLAS experimentatlas_paper is one of two general purpose collider detectors for the Large Hadron Collider (LHC) at CERN. The ATLAS detector consists of an inner detector employing silicon pixel, strip, and transition radiation tracking detectors, all in a solenoidal magnetic field of 2 Tesla; electromagnetic and hadronic calorimeters using liquid argon and scintillator tile detectors; and a muon spectrometer. The muon spectrometer consists of a large air-core barrel and endcap toroid magnets with a between 2-6 , and four types of trigger and precision tracking detectors, described below. The muon spectrometer is designed to measure the transverse momentum () of muons with GeV with a resolution of 4% up to of 100 GeV and increasing to 10% @ 1 TeV.
The ATLAS muon spectrometer consists of Monitored Drift Tubes (MDTs) for precision tracking in the spectrometer bending plane, Resistive Plate Chambers (RPCs) and Thin Gap Chambers (TGCs) for triggering in barrel and endcap, respectively, and Cathode Strip Chambers (CSCs) for precision measurements in the high-rate endcap inner layer where MDTs would have occupancy problems.
The magnet system consists of 3 sets of air-core toroids, each with 8 coils, 1 for the barrel, and 1 for each endcap. The barrel toroids coils are each 25m 7m and the endcap coils are 9m 4m. The magnetic field provides an approximately 1T field at the center of each coils, but is non-uniform, especially in the barrel-endcap transition region. For track reconstruction, the field is mapped using a computer model of the field which is normalized to measurements from 1850 Hall sensors mounted on spectrometer chambers.
Alignment measurements of the spectrometer are also critical for momentum determination and are accomplished with an optical alignment system of 12k sensors. Measurements from these sensors allow a 3-dimensional reconstruction of chamber positions accurate to better than 50 m. In addition, the optical alignment system is complemented by alignment done with tracks.
| Type | Purpose | location | coverage | Channels |
|---|---|---|---|---|
| MDT | Tracking | barrel+endcap | 354k | |
| CSC | Tracking | endcap layer 1 | 30.7k | |
| RPC | Trigger | barrel | 373k | |
| TGC | Trigger | endcap | 318k |

The spectrometer is designed so that muons cross three layers of MDT chambers for the sagitta measurement. The track coordinate in the bending plane of the spectrometer is measured by the precision chambers with a resolution of 40 m. In comparison, the sagitta of a 1 TeV muon will be about 500 m. The trigger chambers are placed on opposite sides of the middle MDT layer. The trigger chambers provide a trigger based on muon momentum in addition to identifying the bunch crossing time of the muon. The also provide the second coordinate measurement (non-bending plane) accurate to 5-10 cm.
Figure 1 shows the expected resolution of the muon spectrometer. For GeV/c multiple scattering is the dominant contributor to the resolution. Above 100 GeV/c calibration and alignment of the spectrometer become the most significant factors in momentum resolution. ATLAS muon reconstruction is done using momentum measurements from both the inner detector spectrometer and the muon spectrometer. The two spectrometers nicely complement each other as inner detector measurements are better below 100 GeV/c above which the muon spectrometer resolution is superior. High measurements with the muon spectrometer require very accurate MDT and alignment calibrations which will become particularly important in a few years when LHC reaches 7 TeV energy per beam and higher luminosities.
This paper shows a mix of results from 2010 and 2011 using the most up-to-date plots whenever possible. Not all plots are available for 2011 so in some cases 2010 plots are used.
II Monitored Drift Tube Calibrations
There are three calibrations required for the MDTs: timing offsets (); time-space () functions; and drift tube resolution functionscalib_paper . In order to obtain high quality calibrations for the MDTs a special high statistics calibration data stream is extracted second-level trigger processors and sent for processing at three calibration centers at Michigan, Rome, and Munich. This calibration stream provides 10-100X the rate of single muon tracks compared to regular ATLAS data. With this stream it is possible to do daily calibrations of the monitored drift tubes as well as detailed data quality monitoring.
II.1 Timing Offset Calibrations
A timing offset represents the minimum measured drift time. i.e. the time of a muon passing at the wire of the drift tube. This time is not zero due to cables and other delays in the data acquisition system. Figure 2 shows a typical time spectrum from an MDT. The fit is shown in blue, and the is defined as the half-way point of the rising edge. The falling edge represents hits at the tube wall. Figure 2 shows statistical error on fits as a function of number hits in the time spectrum. We require at least 10000 hits for the fits yielding a typical error of 0.5 ns. The average drift speed is 20 m/ns so this error corresponds to a 10 m error due to the measurement.
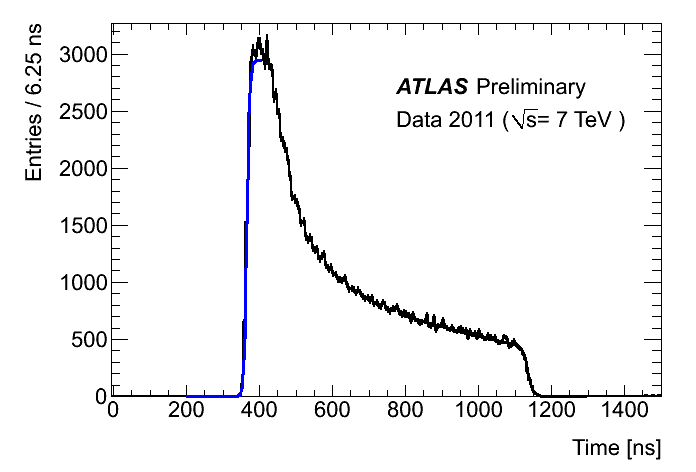
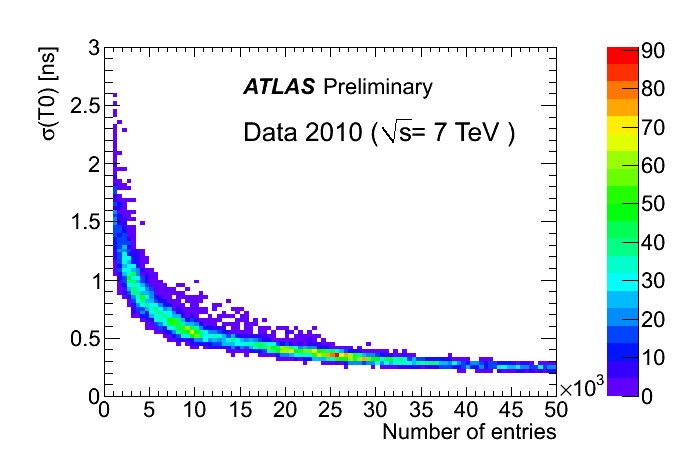
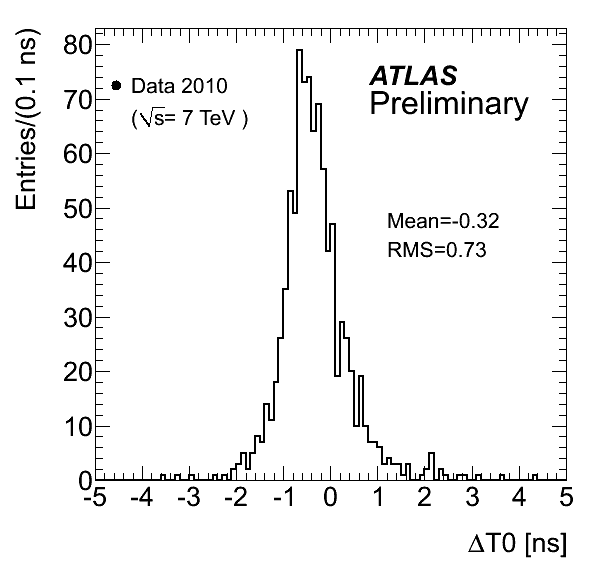
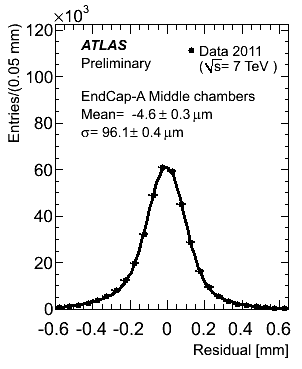
Figure 3 shows the distribution of the change in for all MDT chambers over a 2 month period from 2010. There is small global drift of a fraction of a nanosecond, but the overall width is close to the typical statistical error of 0.5 ns. Hence, the T0s are quite stable.
II.2 function calibration
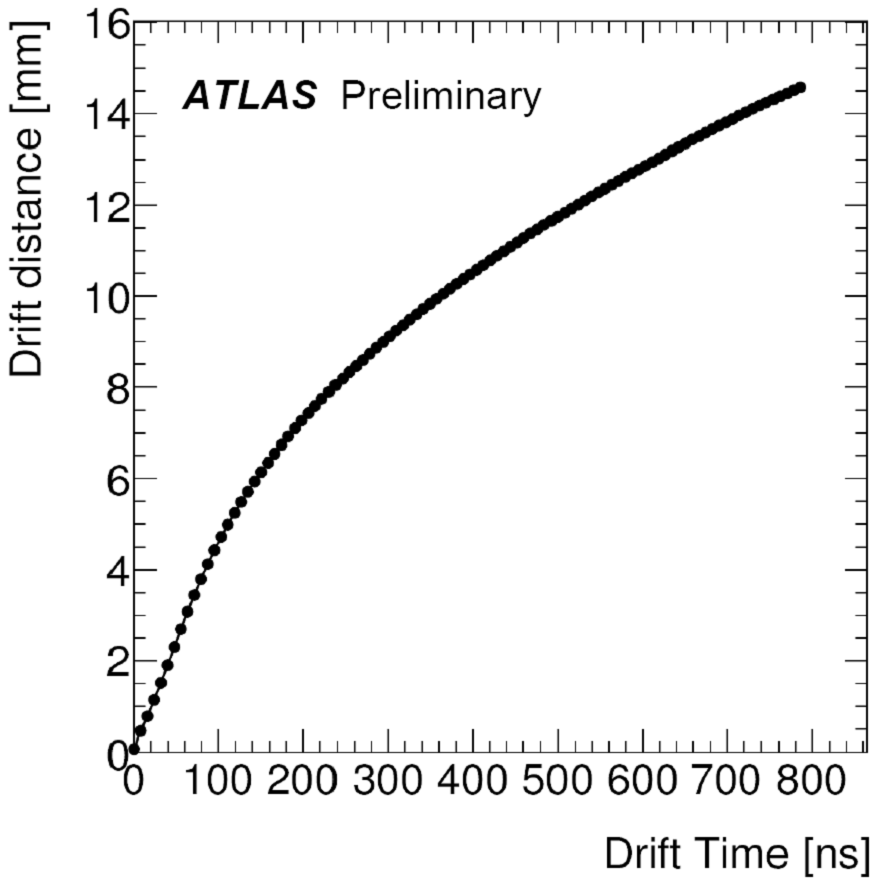
The other main calibration is the time-to-space or function. This function gives the drift radius (impact parameter) of the hit based on the drift time. An example of an function is shown in Fig. 4. The function is non-linear since ATLAS uses a non-linear drift gas, due to its better aging characteristics in high-radiation environments.
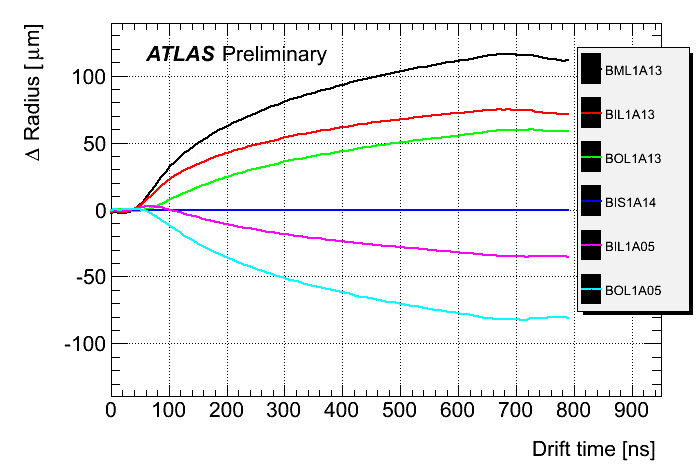
The function is determined by an iterative procedure looping over tubes hits and minimizing the tracking residuals of track segments reconstructed with hits within a single MDT chamber which have either 6 or 8 layers of MDT tubes. Tracking residuals are the differences between the drift radii from the drift time and the radius from the track fit. Typically 10000 tracks segments are used in the calibration of a single chamber. Figure 4 shows the difference between functions for several chambers in the barrel. The differences in functions are due primarily to the temperature gradient within the ATLAS cavern (about from top to bottom), as well as due differences in magnetic field within chambers.
The precision of the function is shown by Fig. 5 which shows the mean of the tracking residuals as a function of the MDT tube radius. Except for the region close to the wire, the mean residuals are within 20 m. Tracking residuals from the middle layer of endcap chambers are shown in Fig. 3. The residual width of 96 m is typical for all chambers in ATLAS.
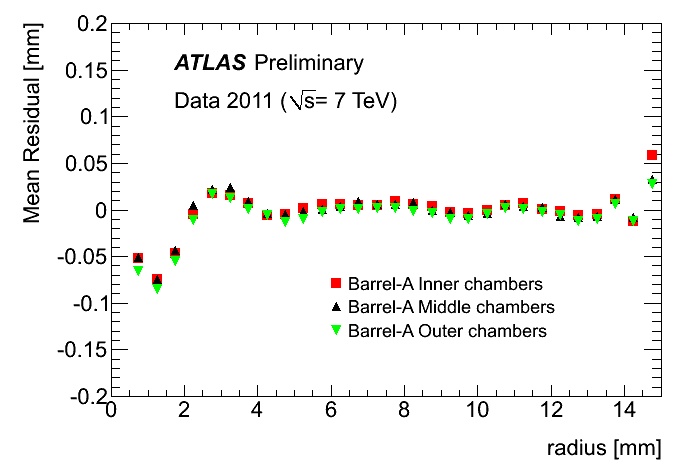
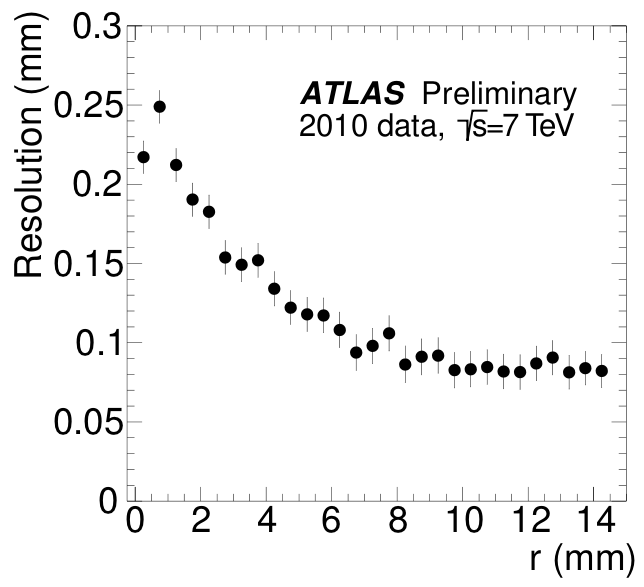
Figure 5 shows the single tube resolution as a function of drift tube radius. The resolution is determined from the tracking residuals width with the fit errors subtracted. We see that the resolution is close to the 80 m for large radii. Near the wire the resolution degrades to faster drift speed and fewer drift electrons. This plot was made with 2010 data. We expect improvements in the future by applying some addition timing corrections such as a hit-level magnetic field correction and by using tube-level s.
III Muon Spectrometer Alignment
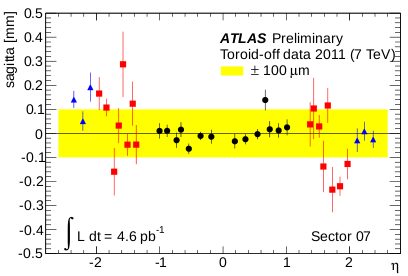
The alignment system system is designed to track chamber positions with a 40 m precision. The monitoring is done with optical sensors which is cross-checked by doing alignment with straight tracks from magnet-off runs. The barrel and endcap have separate alignment systems.
Figure 6 shows measurements from the mean value of the ”false” sagitta measured with straight tracks from magnet-off runs. Straight tracks should have a sagitta of zero and hence this sagitta measurement gives the precision of the alignment system. The plot shows the sagitta as a function of with the black points for the barrel and the red and blue corresponding with to the endcap. The barrel achieves a resolution of 50 m, close to the design goal, whereas the endcap gives a resolution of around 110 m indicting that further improvements are necessary.
IV Trigger Performance
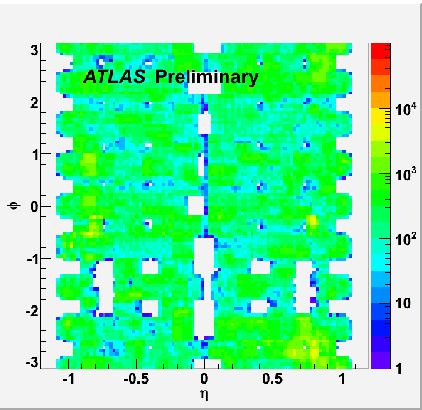
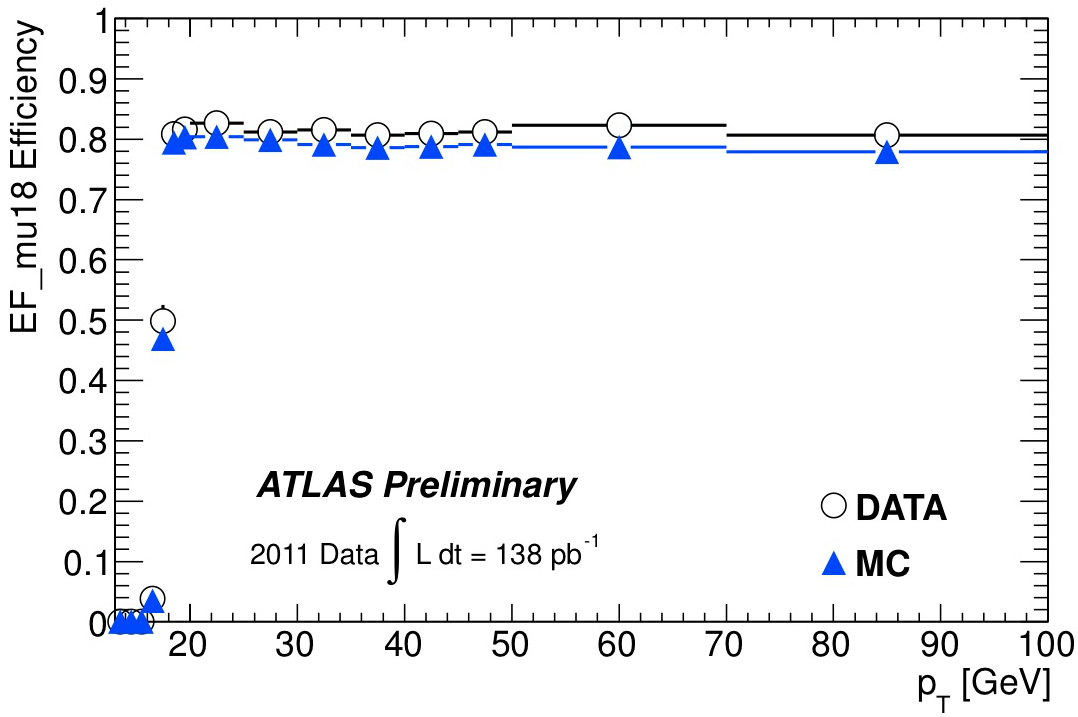
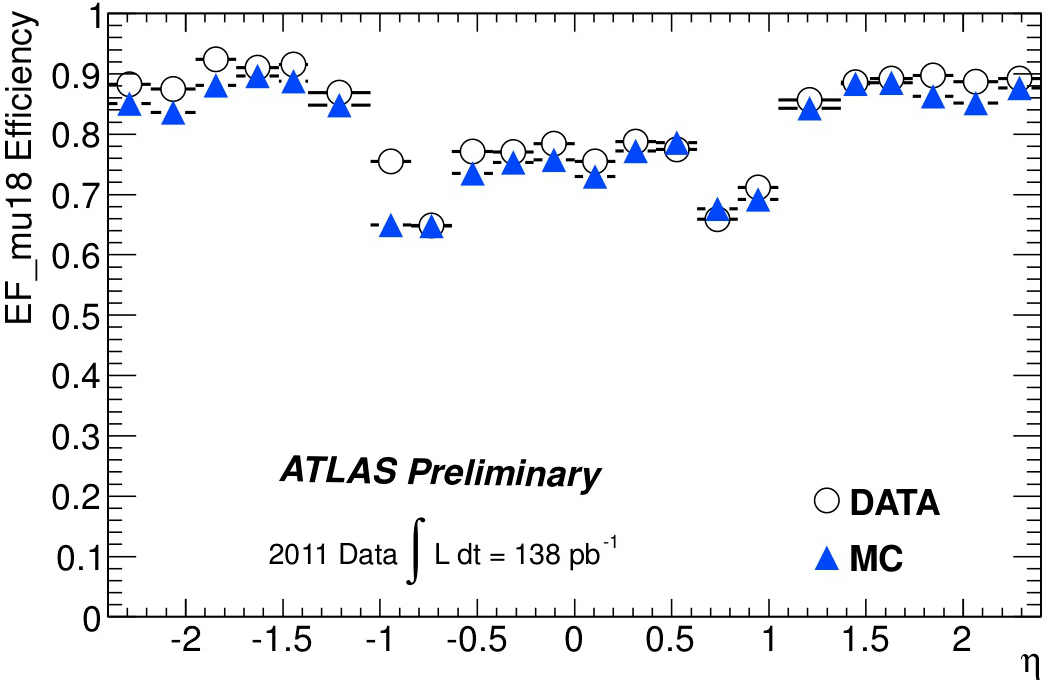
Figure 7 shows the an occupancy plot for the barrel from collision data. As can be seen the coverage is quite uniform except for dead regions due to the support feet of the ATLAS detector. The geometric acceptance is about 80%. Figure 8 shows the trigger efficiency as a function of and , respectively. The triggers are very efficient within geometric coverage of the trigger. The data show a slightly higher efficiency than monte carlo due to some analysis improvements in the data analysis which have not yet been introduced to the monte carlo code.
V Momentum Resolution
Figure 9 shows the momentum resolution as a function of muon in the barrel region of ATLAS. The momentum resolution is derived from the width of the reconstructed Z mass as well as by comparing single muons reconstructed by both the inner detector and muon spectrometer. Monte carlo and inner detector measurements are used to derive the contributions of momentum resolution from energy loss in calorimeters, multiple scattering, and the intrinsic resolution of the spectrometer. The measured resolution is somewhat worse than the simulation. This result is from the preliminary calibrations for 2010 data, so we expect improvement from more refined calibrations in the future.

VI Conclusions
The ATLAS muon spectrometer is working well with a high trigger efficiency and tracking resolution near design specifications. Calibrations of the drift tubes are done daily using a high statistics data stream from the level-2 trigger processors. Alignment is working well in barrel, but needs some improvement in the endcap. Momentum resolution is near design specifications. We expect improvements from better calibrations and statistics from 2011 data.
References
- (1) “The ATLAS Experiment at the CERN Large Hadron Collider”, The ATLAS Collaboration, G Aad et al 2008 JINST 3 S08003, http://www.iop.org/EJ/abstract/1748-0221/3/08/S08003
- (2) “Calibration model for the MDT chambers of the ATLAS Muon Spectrometer”, P. Bagnaia et al, ATLAS Note ATL-MUON-PUB-2008-004, http://cdsweb.cern.ch/record/1089868