Rotating Radio Transients–References
Rotating Radio Transients
Abstract
Over the past several years, it has become apparent that some radio pulsars demonstrate significant variability in their single pulse amplitude distributions. The Rotating Radio Transients (RRATs), pulsars discovered through their single, isolated pulses, are one of the more extreme manifestations of this variability. Nearly 70 of these objects have been found over the past several years in archival and new pulsar surveys. In this review, we describe these searches and their resulting discoveries. We then discuss radio timing algorithms and the spin-down properties of the 19 RRATs with phase-connected solutions. The spin-down parameters fall within the same range as other pulsars, with a tendency towards longer periods and higher magnetic fields. Next we describe follow-up observations at radio wavelengths. These show that there are periodic fluctuations in the pulse detection rates of some RRATs and that RRATs in general have similar spectra to other pulsars. X-ray detection has only been made for one RRAT, J18191458; observations have revealed absorption features and a bright X-ray nebula. Finally, we look to future telescopes and the progress that will be made with these in characterising and understanding the Galactic RRAT population.
keywords:
stars: neutron – pulsars: general – transients – radio continuum: stars1 Introduction
Pulsars do not often conform to the well-known textbook model: a dependable ‘cosmic lighthouse’ from which we can detect a train of regularly-spaced pulses. Many are now known to exhibit very large variations in radio emission, and in some cases even appear to switch off for seconds, weeks, months or even years. To discover such malfunctioning lighthouses we cannot use techniques dependent on there being a reliable periodic signal. These sources are often much better (or only) detectable via their occasional bright bursts of emission, i.e. as ‘radio transients’. The eRRATic pulsars discovered in this way are commonly dubbed Rotating Radio Transients, or ‘RRATs’.
In this review we first describe, in §2, the methods used in searches for pulsars and fast radio transients in general. We then discuss, in §3, the 2006 discovery of the first 11 RRAT sources and the initial implications of this. We proceed, in §4, with an overview of the numerous subsequent searches for radio transients which have been performed in the last 5 years. In §5 we look at the large body of follow-up observations which have been made, primarily at radio wavelengths but spanning most wavelength ranges. We conclude, in §6, with a discussion of where these erratic pulsars fit within the overall pulsar population.
2 Pulsar searches
Pulsar observations have focused, in recent times, on observing frequencies of 1 GHz, where receivers with a few 100-MHz bandwidth are used routinely. The radiometer equation then tells us that such observing systems (on 100-metre class single dish radio telescopes) can detect pulses of radio emission with peak flux densities of 100 mJy, where is the pulse width in milliseconds. The well-known frequency-dependent dispersion a radio signal experiences as a result of its journey through the interstellar medium is , where the dispersion measure is the integrated electron density along the line of sight in units of pc cm-3 and is the observing frequency in GHz. Therefore, by channelising our bandwidth we can determine DMs and, with a model for (e.g. Cordes & Lazio 2002) in the Galaxy, we can infer distances to sources. And so it is that we can easily detect millisecond pulses with fluxes 100 mJy and estimate luminosities. For Galactic sources the minimum brightness temperature associated with such transient radio signals is , where is the peak flux in Jy and is the distance in kpc. Radio pulsars have the highest brightness temperatures of all known radio transient sources, with most emitting single pulses in the range K, with the giant pulses from the Crab pulsar as high as K (Hankins et al., 2003). Additionally, millisecond pulse widths, by causality, imply maximum source sizes of km. Clearly the emission mechanism responsible for such signals involves non-thermal, coherent emission from compact objects.
2.1 First discoveries
Even though thought to exist since the 1930s (Baade & Zwicky, 1934; Oppenheimer & Volkoff, 1939) neutron stars were seen as ‘theoretical’, i.e. difficult/impossible to detect. It was not until the serendipitous discovery of the first pulsar in 1967 (Hewish et al., 1968) that neutron stars were promoted to the forefront of astrophysical research. Although until this time radio astronomers had not observed at sufficiently high time resolution for their detection, this soon became commonplace. The first pulsars were discovered by visual inspection of the time series from large radio telescopes, at first with no correction for dispersion, but this was quickly incorporated. The first 30 pulsars (see § 3.4 of Lyne & Smith 2004 and references therein for a historical review) were discovered in this way, amongst which the most noteworthy is the Crab pulsar (Staelin & Reifenstein, 1968). The short period of 33 ms (although not measured in the discovery observations) solidified the neutron star interpretation (over the white dwarf interpretation) of pulsars.
2.2 Periodicity searches
It was quickly realised that Fourier domain searches would enable the detection of pulsars whose individual pulses were not bright enough to be detectable. For a train of pulses of duty cycle (i.e. width recurring at a period of ) an improvement in sensitivity by a factor of , or of for narrow pulses, can be made. Fourier searches, wide DM-range searches, and the use of extended bandwidths resulted in the discovery of many more pulsars (Manchester et al., 1996, 2001). Faster time sampling allowed the discovery of millisecond pulsars (MSPs) (Backer et al., 1982) and sophisticated techniques for detecting binary systems were developed (Freire et al., 2001; Ransom, 2001).
The standard pulsar search pipeline had become (see §6 of Lorimer & Kramer 2005 for an extensive overview):
- 1.
- 2.
-
3.
Choose a DM range to search (perhaps based on the sky position and the expected maximum DM in that direction) and for each DM in that range, dedisperse the data by shifting the frequency channels to compensate for frequency-dependent delays. The spacing of the DM trial values, or ‘channels’, is selected so that the error due to an incorrect DM is no smaller than the intrinsic dispersion smearing over a single frequency channel.
-
4.
Fourier transform these dedispersed time series and apply appropriate filters in the frequency domain to detect periodic signals. For each significant signal, fold the original dedispersed data at the candidate period (before tuning the DM and period values for an optimal detection). An acceleration search for binary pulsars adds either an extra layer to the nested search loop, over the range of acceleration values, or increases the complexity of the Fourier domain search at each DM trial.
2.3 Single pulse searches
After the initial pulsar discoveries, and the switch to the ‘standard’ searching procedure, it was not standard to search the dedispersed time series in the time domain for bright individual pulses (with a few exceptions, e.g. Nice 1999). However, there are a number of reasons why it is sensible to add such a ‘single pulse search’ to the pipeline. Firstly, we should exhaust all possible avenues to maximise the yield of our search, especially as it is computationally very inexpensive to add single pulse searches to the standard search setup. Secondly, it is not only quick, but effective, as there are many pulsars which are more significantly, or indeed only, detectable via single pulse searches.
It is straightforward to show (McLaughlin & Cordes, 2003) that the ratio of signal-to-noise ratios of FFT and SP searches (the so-called ‘intermittency ratio’) is given by:
| (1) |
where is a product of constants and is , is the number of pulse periods during the observation, and and are the peak and average pulse flux densities, respectively. Depending on the pulse amplitude distribution and the observation specifications, a pulsar may be more effectively (or only) detectable in either a single pulse (SP) or a Fourier domain (FFT111Although ‘FFT’ denotes Fast Fourier Transform, it is used here, as is common, as a synonym for all searches which rely on the time-averaged emission.) search. For longer observations there is a higher probability of a pulsar emitting a very bright single pulse (i.e. ) and hence increasing the likelihood of detection in a single pulse search. However in the limit of high the periodicity search will become more effective. Many pulsar amplitude distributions have a ‘sweet spot’, i.e. a peak in as a function of , between where these competing effects dominate (see Keane 2010 for an examination of several families of distributions).
Single-pulse searches are quite straightforward. They involve searching each dedispersed time series for significant peaks, an exercise in matched filtering. Typically the dedispersed time series is searched for peaks, i.e. pulses of width , the sampling time, then ‘decimated’ in time (i.e. adjacent time samples are added) by a factor and searched for peaks, i.e. pulses of width . Usually decimation is done in factors of two (with more accurate fits made later to obtain more precise pulse widths). For example, the Parkes Multi-beam Pulsar Survey (PMPS), with s, was recently searched for pulses with pulse-widths ranging from to times this sampling time (Keane et al., 2010). This is equivalent to convolving the time series with box-cars of width with . Once significant events over a range of widths have been recorded for a range of DM values, a plot like that shown in Fig. 1 is examined for significant events at a constant non-zero DM.

Further techniques are also often employed to remove signals that are due to terrestrial interference, which can obscure astrophysical signals of interest, such as ‘zero-DM subtraction’ (Eatough et al., 2009) or coincidence matching when using multi-beam receivers (Deneva et al., 2009; Keane et al., 2010; Burke-Spolaor et al., 2011b). The software packages usually used (see McLaughlin (2011) for a discussion) to search pulsar survey data are sigproc222http://sourceforge.net/projects/sigproc, swinlegion333https://github.com/swinlegion (an offshoot of sigproc but with many extra features) and presto444https://github.com/scottransom/presto. All of these packages are freely available.
3 RRATs: discovery
With the aim of discovering pulsars more easily detectable via their single pulses, or indeed any transient radio events, McLaughlin et al. (2006) searched the entire PMPS (Manchester et al., 2001) with the search algorithm described in Cordes & McLaughlin (2003) and as outlined above. To date, the PMPS is the most successful pulsar survey ever performed, with a yield of over 800 pulsars (Manchester et al., 2001; Morris et al., 2002; Kramer et al., 2003; Hobbs et al., 2004; Faulkner et al., 2004; McLaughlin et al., 2006; Lorimer et al., 2006; Keith et al., 2009; Eatough et al., 2009; Eatough, 2009; Keane et al., 2010; Eatough et al., 2010; Keane et al., 2011). A decade later this number is still growing as the survey is currently being reprocessed with a number of new algorithms.
3.1 Eleven new sources
McLaughlin et al. (2006) identified 11 new sources which were not detectable in PMPS periodicity searches, resounding proof of the value of single pulse searches. They were characterised by repeated bursts at a constant DM and were at first referred to as Repeating Radio Transients. However, before the initial publication, with follow-up observations of between 8 and 30 hours, and the detection of between 4 and 229 pulses from each source, it became clear that there were underlying periodicities which ranged from 1–7 seconds, typical neutron star rotation periods. Thence these sources were recognised to be rotating neutron stars and re-named Rotating Radio Transients (RRATs). Further evidence of the neutron star nature of these 11 sources included the facts that the pulse widths of a few milliseconds implied (by causality) very compact sources (and were close to the neutron star dynamical timescale), their inferred minimum brightness temperatures were similar to those of the known pulsars, positive period derivatives with typical pulsar-like values were measured for three sources. Additionally, shortly after the discovery, one of the sources was seen in thermal X-rays as expected for a cooling neutron star (Reynolds et al., 2006).
3.2 First ideas, questions, and implications
The discovery of the first 11 RRATs in the PMPS was followed by a number of papers presenting theories to explain the irregularity of the detected radio emission. Radio pulses were detected at rates as low as once per three hours to as frequently as one every few minutes. The question of interest to many was whether the sources were truly ‘off’ (or to use pulsar parlance, ‘nulling’) during the rotation periods where no pulses were detected or whether they had some weak underlying emission. The non-detection in periodicity searches of PSR J18191458, the source with the brightest and the highest number of detected pulses, implied a lower limit on of 200 (McLaughlin et al., 2006). For J13175759 this limit was a factor of 125. Such numbers are not unheard of, e.g. in PSR B065614 this ratio is 420, leading Weltevrede et al. (2006) to point out that any pulsar with similar pulse-to-pulse modulation would be detected as a RRAT if at a sufficient distance from Earth. If B065614 were moved 12 times further away to a distance of kpc it would only be detectable in a single pulse search (and we note that the distances of the 11 PMPS RRATs ranged from 2–7 kpc). For the other nine sources there simply were not enough data to determine limits on . Nonetheless, many authors proposed different mechanisms for how switching ‘on’ and ‘off’ pulsar-like emission could occur, applying these to the 11 PMPS RRATs assuming they were ‘off’ when not detected. These ideas involved, to name but a few, re-activating ceased pulsar emission due to transient disturbances in supernova fall-back discs (Li, 2006), the release of plasma trapped in radiation belts (Luo & Melrose, 2007) or the interaction with proposed asteroidal material around the star (Cordes & Shannon, 2008).
Another implication from the discovery of the 11 PMPS RRATs was that there remained a large number of undiscovered neutron stars of this type, i.e. those with sporadic and/or highly-modulated radio emission which are more easily or only detectable in single-pulse searches. Considering the likelihood of bursts being detected in the 35-minute pointings of the PMPS, the number and distribution (e.g. in ‘radio luminosity’ ), the extent of contamination of the survey due to interference and beaming effects, McLaughlin et al. (2006) estimated the total number of such sources in the Galaxy to be larger than the ‘normal’ pulsars (i.e. those much more easily detectable in periodicity searches) by as much as a factor of four. This of course was an estimate based on a small number of sources and on a number of parameters whose values were not well-determined. However, even if over-estimated by an order of magnitude this expected number is still a very large fraction of the overall pulsar population. Another suggestion made in the initial discovery paper was that these sources represented a distinct and previously unknown population of bursting neutron stars.
An estimate of the numbers and birthrates of Galactic neutron stars was made by Keane & Kramer (2008) to examine the implications of this. The conclusions were that if the neutron star classes, not just the ‘normal’ pulsars and the new PMPS RRATs, but also the XINS (X-ray Isolated Neutron Stars, see e.g. Kaplan 2008)555These sources have also been referred to as XDINS (X-ray Dim Isolated Neutron Stars), INS (Isolated Neutron Stars), the ‘Magnificent Seven’, and RQNS (radio quiet neutron stars) in various publications., magnetars (Thompson & Duncan, 1996), and CCOs or Central Compact Objects (Halpern & Gotthelf, 2010) were distinct, then the observed Galactic supernova rate (which is presumably greater than or equal to the neutron star birthrate) seemed to be insufficient. Identifying the populations with each other could remove this problem, leading to the suggestion that the PMPS RRATs and ‘normal’ pulsars were part of the same underlying population.
The discovery of the first 11 PMPS RRATs raised questions regarding the pulsar emission mechanism(s) as well as our knowledge of how many neutron stars there are in our Galaxy. To address these questions a large observational campaign of the 11 known sources was necessary, as well as systematic searches to identify the large predicted number of sources. Below, in §4, we describe the numerous successful searches for new RRATs in various radio surveys, and then, in §5, we describe the follow-up observation campaigns both at radio and other wavelengths.
4 The search continues
There are several ways in which one might define a RRAT. One could argue that they are simply one extreme of the normal pulsar intermittency spectrum and therefore require no definition. However, for the purposes of this review and other papers, one could simply call RRATs those pulsars discovered only through a single-pulse search, as in McLaughlin et al. (2006). Or, the distinguishing characteristic of a RRAT could be a pulsar from which we see predominantly isolated pulses (see e.g. Burke-Spolaor & Bailes 2010). These are both viable but for the purposes of this review, we propose:
A RRAT is a repeating radio source, with underlying periodicity, which is more significantly detectable via its single pulses than in periodicity searches.
A pulsar is then labeled a ‘RRAT’ if, for the observing specifications concerned, (see Equation 1). A pulsar does not have to exhibit long timescale ‘nulling’ (i.e. sustained periods where radio emission is ‘off’) to satisfy this criterion. Clearly the definition is rather arbitrary as a pulsar may be a ‘RRAT’ in one survey but not in another — hence the use of ‘PMPS RRAT’ etc. At the time of writing, according to this definition, 61 pulsars have been identified as RRATs (McLaughlin et al., 2006; Hessels et al., 2008; Shitov et al., 2009; Keane et al., 2010; Burke-Spolaor & Bailes, 2010; Rubio-Herrera, 2010; Keane et al., 2011; Burke-Spolaor et al., 2011b)666Different numbers of RRATs are reported in several publications, for a number of reasons. Firstly, sources do not have a constant value of between observations with different specifics, or even between identical observing setups as the sampling of the pulsars’ amplitude distribution functions will always yield different values. This is a natural consequence of the loose ‘definition’ of RRATs and we re-emphasise that the label should not be taken too strictly. Secondly, there have been different, even looser, ‘definitions’ used by different authors (the one given here follows Keane et al. 2011), none of which have been strictly applied, e.g. if sources must be completely undetectable in FFT searches then there will be fewer RRATs and if it is simply the discovery method which decides the label then there are many more pulsars which should be labeled so, e.g. the Crab pulsar. in various surveys, which we now review in turn. This count includes all repeating sources discovered in the above papers through single-pulse searches.
4.1 Archival Parkes surveys
The PMPS, wherein the original 11 RRAT sources were discovered, surveyed the Galactic plane in the longitude range to and latitude range at a central observing frequency of MHz spanned by MHz channels sampled every s. Two further surveys were performed with the Parkes telescope at intermediate and high Galactic latitudes of (Edwards et al., 2001; Jacoby et al., 2009) in the same longitude range as the PMPS. The surveys used almost identical survey specifications to the PMPS, except for a faster sampling time of s and shorter -minute pointings. Burke-Spolaor & Bailes (2010) analysed both of these surveys, performing single pulse searches and discovering 14 new sources.
With an estimated 50% of the expected RRAT sources in the PMPS obscured by radio frequency interference (McLaughlin et al., 2006) and the development of some algorithms for its effective mitigation (see e.g. Eatough et al. 2009), Keane et al. (2010, 2011) re-analysed the PMPS, discovering 17 new sources. Another notable search of the Parkes archives was performed by Lorimer et al. (2007) and resulted in the discovery of the so-called ‘Lorimer Burst’, a 5-ms duration burst from an unknown apparently extra-galactic source. With many such signals expected to be found in pulsar surveys, the DM range of single pulse searches now commonly reaches well beyond the ‘edge of the Galaxy’, i.e. the highest DM expected for a Galactic source based on some model for the electron density distribution (e.g. the NE2001 model of Cordes & Lazio 2002). Indeed one of the bursts reported in Keane et al. (2011) is also possibly extra-galactic in origin.
All of these high-impact scientific discoveries show the value of searching archival datasets (even those which have been examined many times already). At present there remain many archival Parkes surveys which have not been subjected to single pulse searches. These data, which are publicly available, are a source with huge potential for discovery. The recent and ongoing efforts by Hobbs et al. (2011) to make the Parkes pulsar archives easily accessible to all online will no doubt help in the endeavour to exhaustively search all available data for maximum scientific output.
4.2 The HTRU
The latest and ongoing pulsar search occurring at the Parkes Telescope is the High Time Resolution Universe (HTRU, aka HTRU South) survey (Keith et al., 2010). This survey is being performed at a central frequency of 1352 MHz with a usable (total) bandwidth of 340 (400) MHz. The frequency and time resolution are kHz and s respectively, 8 and 4 times higher than that of the PMPS. This has allowed the discovery of intrinsically narrower pulses, enabling more distant MSPs to be identified (see e.g. Bates et al. 2011). The greater sensitivity, coupled with the fact that the HTRU survey covers areas outside of the PMPS sky, means the expected yield of new pulsars is high, numbering around 400 (Keith et al., 2010). Recently Burke-Spolaor et al. (2011b) have performed a single pulse search on the HTRU data. The search covered , and respectively of the HTRU low-, intermediate- and high-latitude pointings and resulted in the discovery of 11 new sources. The twin northern hemisphere HTRU survey will be performed with the Effelsberg Telescope in Germany and has recently commenced.
4.3 Low-frequency Green Bank Telescope searches
Single-pulses searches have been incorporated in several low-frequency pulsar surveys with the Green Bank Telescope (GBT). The first low-frequency survey (Hessels et al., 2008) used a central frequency of MHz with -MHz bandwidth, 1024 frequency channels, and -s sampling. This low frequency, combined with the sensitivity of the GBT, makes this survey very sensitive to faint, nearby pulsars. The survey covered roughly 1000 square degrees at and and resulted in the discovery of 33 new pulsars, five of which were found through the single-pulse search. Two of these pulsars are very sporadic. One is undetectable for nearly 97% of the time and another, which Hessels et al. (2008) classify as the only RRAT detected in their survey, shows individual bright bursts separated by 100s – 1000s of seconds.
A second, similar GBT survey was undertaken in the (Northern) summer and autumn of 2007. During this time, deg2 between declinations of and were covered in ‘drift-scan’ mode during the GBT track repair, with an effective integration time of 150 s. A central frequency of MHz, -MHz bandwidth, 2048 frequency channels, and -s sampling time were used. A total of 26 pulsars were discovered, including one object through the single-pulse search. This pulsar is, however, typically detectable through an FFT. A portion of the data (20 Terabytes, or 1500 deg2) has been set aside for analysis by high-school students in the Pulsar Search Collaboratory (PSC) project (Rosen et al., 2010).
Encouraged by these successes, a new -MHz GBT survey of the Northern celestial cap is currently being undertaken, with the primary goal of searching for pulsars to include in pulsar timing arrays for gravitational wave detection. This survey will cover declinations greater than at MHz with two-minute integrations using -MHz bandwidth, 4096 frequency channels, and 81.92-s sampling time. Given the number of sources detected in single-pulse searches in previous GBT surveys, this new survey is expected to discover dozens of RRATs.
4.4 The PALFA survey
The PALFA (Pulsar Arecibo L-band Feed Array) survey uses a seven-beam receiver on the 305-m Arecibo telescope to cover the region and , with -MHz of bandwidth, 256 frequency channels, 64-s sampling time, and 265-s integrations (Cordes et al., 2006). This survey has thus far resulted in 56 pulsar discoveries, with seven of those made through a single-pulse search (Deneva et al., 2009). Several of these objects are very intermittent, with less than 10 pulses detected in many hours of follow-up observations. This survey should ultimately discover several hundreds of new pulsars, with tens of these identified as RRATs.
4.5 Other
In addition to the above sources, the discovery of one RRAT source at the Puschino Observatory in Russia was reported by Shitov et al. (2009). Furthermore the Westerbork Synthesis Radio Telescope’s 8gr8 survey (Janssen et al., 2009) of the Cygnus region at MHz has recently reported the detection of four RRAT sources (Rubio-Herrera, 2010).
5 Follow-up work
Many of the sources found in the surveys described above in §4 have been subject to extensive follow-up observations, which we now describe.
5.1 Radio
When new pulsars are discovered, one typically does a ‘gridding’ observation to refine the position (as the initial survey position can be quite uncertain, e.g. arcmin for the PMPS). This facilitates observations at higher radio frequencies and also obtaining a timing solution. However, the interpretation of gridding observations is difficult for RRATs (i.e. in the case of a non-detection it is unclear whether one was off source or whether the RRAT was ‘off’). Therefore, refining positions must typically wait for a phase-connected timing solution, requiring a year’s observation to remove the effects of the Earth’s motion around the Sun. While most pulsars are timed through their average profiles, RRATs are timed from their isolated pulses and often a large amount of time may be required to accumulate enough pulses to achieve a solution. Consequently, some RRATs (especially those with the lowest detected burst rates) still do not have solutions after several years and some are so sporadic that it is not possible to determine a timing solution. When solutions are determined, errors on timing parameters can be much higher than for normal pulsars due to pulse-to-pulse jitter and varying numbers of components in the single pulses (Lyne et al., 2009; Hu et al., 2011).
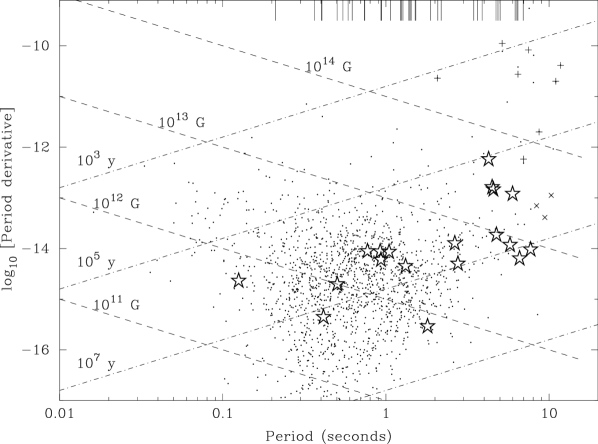
Through observations with the Parkes, Lovell, Green Bank, and Arecibo telescopes, timing solutions have been determined now for 19 PMPS RRATs (McLaughlin et al., 2006, 2009; Lyne et al., 2009; Keane et al., 2011; Boyles et al., 2011). Achieving phase-connected solutions allows us to place these sources on the period-period derivative diagram, a commonly used scatter plot for pulsar classifications, as in Fig. 2. These timing solutions have shown that there is no evidence of any binary companions for these sources. As can be seen from Fig. 2, while the spin-down properties of RRATs and other pulsars overlap, RRATs in general have longer periods and higher magnetic fields than other pulsars. A Kolmogorov–Smirnov test shows probabilities of and that the periods and magnetic fields of RRATs are drawn from the same population as normal non-recycled pulsars, respectively. These probabilities are lower than calculated in McLaughlin et al. (2009) from a sample of nine RRATs, indicating that this trend is robust. However, it is unclear how much of this is intrinsic and how much is due to the selection effects of surveys. One interesting observation is that, while many RRATs populate the same region of space as other pulsars, several RRATs occupy space devoid of normal pulsars and closer to the population of XINS. This could imply an evolutionary relationship between these objects, as suggested by Popov et al. (2006).
Timing solutions have also facilitated high-energy follow-up observations (discussed below), and enabled monitoring for timing irregularities. In particular, they allowed the detection of two glitches from PSR J18191458 (Lyne et al., 2009). The glitch recovery is anomalous in that it results in a net decrease in the star’s slow-down rate, the opposite trend to that in all other pulsar glitches (Espinoza et al., 2011). Lyne et al. (2009) speculate that if this behaviour were typical for PSR J18191458 it may have evolved from the magnetar region of the diagram. This source is being monitored regularly with the Lovell telescope in the UK and with the Urumqi telescope in China (Esamdin et al., 2008; Hu et al., 2011). No further glitches have yet been seen. No glitches have been detected as yet from any of the other sources. PSR J18191458 is also the only source which has measured radio polarisation properties. Karastergiou et al. (2009) found it to be similar to other slow, low spindown-energy pulsars and is seen to have a ‘normal’ S-shaped swing of the polarisation position angle.
A recent analysis by Palliyaguru et al. (2011) of eight of the original 11 PMPS RRATs searched for short (approximately hours) and long-term (weeks to years) periodicities in the detected pulse arrival times. They found significant periodicities in the pulse arrival times for six RRATs with timescales ranging from minutes to years and were not found in sequences of simulated random pulses. They also found that for the two brightest and most prolific sources (J13175759 and PSR J18191458) there were more instances of consecutive pulses seen than would be expected from a random distribution of pulse times (though most pulses, even for these sources, are solitary). Another analysis of RRAT spectra based on multi-frequency radio observations by Miller et al. (2011) showed that RRATs have typical steep pulsar spectra with spectral indices 1.7 (Miller et al., 2011) unlike the flat spectra seen in radio-emitting magnetars (Camilo et al., 2006, 2008). We note, however, that these spectral indices are based on measurements at frequencies 700 MHz and that lower-frequency spectral turnovers are possible.
5.2 Optical and Infrared
PSR J18191458 has been observed in the optical in the search of a counterpart to the radio and X-ray (see below) source by Dhillon et al. (2006). They observed this source with ULTRACAM (Dhillon et al., 2007) on the 4.2-metre William Herschel Telescope, acquiring images, each with an 18 ms exposure time. No detection of any optical bursts were made with a limiting burst magnitude of . To improve upon this, a follow-up study again using the William Herschel Telescope as well as on the New Technology Telescope was performed in tandem with simultaneous radio observations with the Lovell Telescope at Jodrell Bank (Dhillon et al., 2011). The goal was to identify the times when radio pulses were detected and examine the corresponding optical frames. This is the best way to obtain an optical limit under the assumption that the optical emission is also transient and connected to the radio emission, as seen in the Crab (Shearer et al., 2003). No evidence for optical bursts or increased optical flux during radio bursts was found. Besides these observations of PSR J18191458 there have been no other reported optical observations of RRATs.
Rea et al. (2010) attempted to detect infrared counterparts of the first three RRATs with timing solutions, and hence the first with accurately determined positions. Using the Very Large Telescope in Chile they found no infrared counterpart to J13175759 down to a limiting magnitude of . For J19131330 the observations used an incorrect source position due to a slight (yet crucial) inaccuracy in the originally published timing solution, so that the source lay outside of their field of view. A putative counterpart is reported for PSR J18191458 on the edge of the 1- error circle of the X-ray position, but Rea et al. (2010) conclude that the probability of a chance alignment is high.
5.3 X-ray
Several X-ray observations of PSR J18191458 have been made, at first a serendipitous detection by Reynolds et al. (2006) using Chandra (30 ks) and then a targeted observation with XMM Newton (43 ks) by McLaughlin et al. (2007). These revealed a thermal spectrum with 140 eV, characteristic of a cooling neutron star. Pulsations at the -s radio-determined period were also observed, as well as a keV spectral absorption feature, tentatively identified with proton cyclotron resonant scattering. Such features enable an independent estimate of the magnetic field. The inferred magnetic field strength from the cyclotron interpretation is G. Equating this with the (commonly used but incorrect) vacuum dipole estimate for the magnetic field predicts the magnetic and rotational axes to be misaligned by . Interestingly, equating the cyclotron estimate with that from the force-free model of Spitkovsky (2006) yields , meaning either the cyclotron interpretation or the force-free magnetic field strength estimate is incorrect. The spectral feature is confirmed in Chandra observations (30 ks) made by Rea et al. (2009) which also reveal evidence for extended emission up to arcsec from the star. Rea et al. (2009) suggest that this emission is due to a pulsar wind nebula but cannot explain the power source given what would be a large required X-ray efficiency (see e.g. Gaensler & Slane 2006). They suggest that the PWN could be powered by the large magnetic field of this RRAT. A detailed study of PSR J18191458 using XMM Newton ( ks) in tandem with three radio telescopes has reported initial results confirming the earlier findings (Miller et al., 2011), with a comprehensive analysis, including a correlation analysis of radio/X-ray flux, in preparation.
In addition to PSR J18191458, PSR J13175759 was observed with XMM-Newton ( ks) but with no detection (Rea & McLaughlin, 2008; McLaughlin, 2009). PSR J19131330 was also observed, using Swift ( ks), but again with an inaccurate source position (Rea & McLaughlin, 2008; McLaughlin, 2009; Rea et al., 2010). When improved astrometry became available for PSR J08474316 and PSR J18460257 (McLaughlin et al., 2009), these were both observed with Chandra ( ks and ks respectively) but neither were detected, with the corresponding limits obtained being reported in Kaplan et al. (2009). An X-ray candidate for PSR J191100 has also been suggested by Hoffman et al. (2006) which fortuitously occupies the same field as Aql X-1, a much-observed low-mass X-ray binary, but no pulsations were detected and the spectrum is not thermal. With by far the lowest rate of detected bursts of the original PMPS RRATs, PSR J1911+00 is unlikely to ever have an accurate position determined, and hence progress in identifying this X-ray source is unlikely.
5.4 Gamma-ray
With the advent of the Fermi satellite, we now know of nearly 100 rotation-powered pulsars that are detectable at gamma-ray energies. The gamma-ray luminosity is roughly proportional to the spin-down luminosity, with all of the Fermi sources in the first catalog having s greater than erg s-1. Only one RRAT, J15545209, has greater than erg s-1; Keane (2010) folded Fermi photons using the radio ephemeris and found no evidence for gamma-ray emission from this source. The remaining 18 RRATs have s less than erg s-1 and are not predicted to be gamma-ray sources, though Keane (2010) detect a folded profile of 4- significance with Fermi for J18191458. However, they only detect emission in half of the Fermi dataset. A longer timespan of Fermi observations is necessary to gauge the reality of this signal.
6 Where do these sources fit in?
With the discovery of so many transient radio neutron stars in single pulse searches777For a complete list of the pulsars which have been found in single pulse searches since 2006 refer to the website http://www.as.wvu.edu/~pulsar/rratalog/. we now know of RRATs covering a large range in , the fraction of the observed pulse periods where we do not detect a pulse (so that is an upper limit on the nulling fraction). The pulsars identified as RRATs span the range and, as noted by Burke-Spolaor et al. (2011b), if we assume these sources are indeed nulling, then they seem to be an extension of the nulling pulsars discovered in the PMPS by Wang et al. (2007).
As well as in nulling fraction, the distribution seems to be continuous in the typical ‘off’ timescales for these ‘nullers’ and ‘RRATs’, spanning the range (Burke-Spolaor et al., 2011b). This hints at a continuum in intermittency timescales, but beyond hour-long timescales there is a dearth of known objects until we reach the so-called ‘intermittent pulsars’, PSRs B193124, J18320029, and J11075907 where the relevant timescales range from 1 week to year (Kramer et al., 2006; Kramer, 2008). Of course the lack of objects with such long ‘off’ timescales is to be expected due to the difficulty in discovering (and confirming888In general a pulsar is not considered to be a truly new discovery until it has been confirmed in at least one follow-up observation, post-survey.) such sources.
6.1 The trouble with timescales
The timescales on which pulsars exhibit variability span more than 16 orders of magnitude, from the nano-structure seen in the Crab pulsar ( s) to the approximately year-long timescales of intermittent pulsars ( s). However it is very difficult to explain such a large range of timescales. It is an open question as to how stable pulsar emission can occur (at all!) and for days or weeks before apparently switching off. But the picture is even more complicated as periodic switching back and forth between (at least two) stable magnetospheric states has been reported in six pulsars studied by Lyne et al. (2010). They report correlated period derivative and pulse shape changes which, when understood to be the result of a switch between two stable states, can remove the so-called ‘timing noise’ in these pulsars. Such results hint that observed phenomena like nulling (or the more general phenomena of mode-changing, and therefore RRATs), pulse-shape changes and timing noise are all one and the same and a result of magnetospheres switching between stable states.
A number of stable solutions have been obtained numerically for force-free magnetospheres (Contopoulos et al., 1999; Timokhin, 2006). Switching between these stable configurations is possible if there is a sudden depletion of charges in the magnetosphere. Contopoulos (2005), Timokhin (2010), and Rosen et al. (2011) have even discussed how these switches would alter the radio emission and result in observed moding/nulling, but no trigger mechanism for such an event is known. Perhaps the most puzzling aspect of all is that the mechanism for these switches is quasi-periodic in nature. One possible cause of quasi-periodicities could be due to modulations of magnetospheric particle density by asteroids orbiting the neutron star (Cordes & Shannon, 2008). However, due to the low mass needed in these belts, they may be undetectable through reflected radio emission until the SKA or directly without a larger infrared telescope.
6.2 The population of radio transients
We note that the large projected population of pulsars likely to be detected as RRATs may not be a cause for concern. This is because it seems that many can be accounted for as weak/distant sources with high modulation indices. If the undetected underlying emission from such pulsars is above the typical minimum radio luminosity above which the pulsar population is estimated () then these pulsars are already accounted for within the scaling factors used to calculate the estimated total number of pulsars (above ) from the observed sample (see e.g. Lorimer et al. 2006; Ridley & Lorimer 2010). However, if some of the RRATs are indeed nulling pulsars, or pulsars whose underlying emission is below the arbitrarily-imposed luminosity cut-off (see e.g. Faucher-Giguère & Kaspi 2006), then they will indeed contribute to the number of Galactic pulsars. Pulsar population estimates do not take account of nulling when determining the likelihood of detection of pulsars of various types (which consequently inform how known selection effects are removed to reach an estimate for the total population), another contribution (in addition to a luminosity-limited calculation) to the fact that the total number of active pulsars in the Galaxy should be larger than estimated through these methods.
The search for radio transients has also resulted in the discovery of other interesting sources. Most notably, as we have mentioned above, is the Lorimer Burst, of which there may now be two (Lorimer et al., 2007; Keane et al., 2011). As radio frequency interference is a major hindrance to such searches, it is not surprising that previously unknown types of terrestrial signals have also been identified in transient searches. Burke-Spolaor et al. (2011a) report the detection of signals, referred to as ‘perytons’, with anomalous dispersion characteristics which are not of astrophysical origin999They are detected in all 13 beams of the Parkes 21-cm multi-beam receiver, which, as Burke-Spolaor et al. (2011a) note, is impossible for a boresight signal.. Such terrestrial signals are a good illustration of the limits of single-dish radio telescope surveys. This is another argument in favour of the move towards radio arrays where signals from many elements (not necessarily dishes) can be correlated as appropriate to identify the source of terrestrial signals and to remove them.
6.3 RRATs with TNG instruments
Many of the next generation of radio telescopes which will be used for pulsar and fast transient searches are array instruments. The potential of transient searches has now truly been recognised, with all of these major telescopes (e.g. LOFAR, FAST, ASKAP, MeerKAT, SKA) having pulsars and fast transients as key science objectives (Johnston et al., 2008; Booth et al., 2009; van Leeuwen, 2011; Nan et al., 2011). LOFAR, for instance, currently in its commissioning stage, but is already providing scientific results in the field of pulsars (Stappers et al., 2011). LOFAR predicts the discovery of 1000 pulsars in an all-sky survey (van Leeuwen & Stappers, 2010); possibly hundreds of RRATs will be discovered. Even greater advances will come with surveys for transients in interferometric images on short time scales. They will enable accurate positional localisation at the time of discovery, facilitating timing solutions and immediate high-energy follow-up. As a result of the transition to ‘software telescopes’ like LOFAR, much software development is needed. Already, much work is underway in, e.g. live transient searches using graphical processor units as recently demonstrated by Magro et al. (2011). Substantial advancements like this are essential to enable us to deal with data from the SKA by the end of the decade.
Acknowledgements
EK acknowledges the FSM, as well as Joris Verbiest and Michael Kramer for useful comments. MAM is supported by the NSF, WVEPSCOR, and by the Research Corporation.
References
- Baade & Zwicky (1934) Baade W., Zwicky F., 1934, Proc. Nat. Acad. Sci., 20, 254
- Backer et al. (1982) Backer D. C., Kulkarni S. R., Heiles C., Davis M. M., Goss W. M., 1982, Nature, 300, 615
- Bates et al. (2011) Bates S. D. et al., 2011, MNRAS, in press (astro-ph/1101.4778)
- Booth et al. (2009) Booth R. S., de Blok W. J. G., Jonas J. L., Fanaroff B., 2009, (astro-ph/0910.2935)
- Boyles et al. (2011) Boyles, J. R., McLaughlin, M. A., Miller, J. M., in preparation
- Burke-Spolaor & Bailes (2010) Burke-Spolaor S., Bailes M., 2010, MNRAS, 402, 855
- Burke-Spolaor et al. (2011a) Burke-Spolaor S., Bailes M., Ekers R., Macquart J., Crawford F., 2011a, ApJ, 727, 18
- Burke-Spolaor et al. (2011b) Burke-Spolaor S. et al., 2011b, MNRAS in press (astro-ph/1102.4111)
- Camilo et al. (2006) Camilo F., Ransom S. M., Halpern J. P., Reynolds J., Helfand D. J., Zimmerman N., Sarkissian J., 2006, Nature, 442, 892
- Camilo et al. (2008) Camilo F., Reynolds J., Johnston S., Halpern J. P., Ransom S. M., 2008, ApJ, 679, 681
- Contopoulos (2005) Contopoulos I., 2005, A&A, 442, 579
- Contopoulos et al. (1999) Contopoulos I., Kazanas D., Fendt C., 1999, ApJ, 511, 351
- Cordes & Lazio (2002) Cordes J. M., Lazio T. J. W., 2002, (astro-ph/0207156)
- Cordes & McLaughlin (2003) Cordes J. M., McLaughlin M. A., 2003, ApJ, 596, 1142
- Cordes & Shannon (2008) Cordes J. M., Shannon R. M., 2008, ApJ, 682, 1152
- Cordes et al. (2006) Cordes J. M. et al., 2006, ApJ, 637, 446
- Deneva et al. (2009) Deneva J. S. et al., 2009, ApJ, 703, 2259
- Dhillon et al. (2006) Dhillon V. S., Marsh T. R., Littlefair S. P., 2006, MNRAS, 372, 209
- Dhillon et al. (2007) Dhillon V. S. et al., 2007, MNRAS, 378, 825
- Dhillon et al. (2011) Dhillon V. S. et al., 2011, MNRAS, 414, 3627
- Eatough (2009) Eatough R. P., 2009, Ph.D. thesis, University of Manchester
- Eatough et al. (2009) Eatough R. P., Keane E. F., Lyne A. G., 2009, MNRAS, 395, 410
- Eatough et al. (2010) Eatough R. P., Molkenthin N., Kramer M., Noutsos A., Keith M. J., Stappers B. W., Lyne A. G., 2010, MNRAS, 407, 2443
- Edwards et al. (2001) Edwards R. T., Bailes M., van Straten W., Britton M. C., 2001, MNRAS, 326, 358
- Esamdin et al. (2008) Esamdin A., Zhao C. S., Yan Y., Wang N., Nizamidin H., Liu Z. Y., 2008, MNRAS, 389, 1399
- Espinoza et al. (2011) Espinoza C. M., Lyne A. G., Stappers B. W., Kramer M., 2011, MNRAS, 414, 1679
- Faucher-Giguère & Kaspi (2006) Faucher-Giguère C.-A., Kaspi V. M., 2006, ApJ, 643, 332
- Faulkner et al. (2004) Faulkner A. J. et al., 2004, MNRAS, 355, 147
- Freire et al. (2001) Freire P. C., Camilo F., Lorimer D. R., Lyne A. G., Manchester R. N., D’Amico N., 2001, MNRAS, 326, 901
- Gaensler & Slane (2006) Gaensler B. M., Slane P. O., 2006, Ann. Rev. Astr. Ap., 44, 17
- Halpern & Gotthelf (2010) Halpern J. P., Gotthelf E. V., 2010, ApJ, 709, 436
- Hankins et al. (2003) Hankins T. H., Kern J. S., Weatherall J. C., Eilek J. A., 2003, Nature, 422, 141
- Hessels et al. (2008) Hessels J. W. T., Ransom S. M., Kaspi V. M., Roberts M. S. E., Champion D. J., Stappers B. W., 2008, in American Institute of Physics Conference Series, Vol. 983, C. Bassa, Z. Wang, A. Cumming, & V. M. Kaspi, ed, 40 Years of Pulsars: Millisecond Pulsars, Magnetars and More, p. 613
- Hewish et al. (1968) Hewish A., Bell S. J., Pilkington J. D. H., Scott P. F., Collins R. A., 1968, Nature, 217, 709
- Hobbs et al. (2004) Hobbs G. et al., 2004, MNRAS, 352, 1439
- Hobbs et al. (2011) Hobbs G. et al., 2011, PASA, in press (astro-ph/1105.5746)
- Hoffman et al. (2006) Hoffman K., Rutledge R. E., Fox D. B., Gal-Yam A., Cenko S. B., 2006, (astro-ph/0609092)
- Hu et al. (2011) Hu H. D., Esamdin A., Yuan J. P., Liu Z. Y., Xu R. X., Li J., Tao G. C., Wang N., 2011, A&A, 530, A67
- Jacoby et al. (2009) Jacoby B. A., Bailes M., Ord S. M., Edwards R. T., Kulkarni S. R., 2009, ApJ, 699, 2009
- Janssen et al. (2009) Janssen G. H., Stappers B. W., Braun R., van Straten W., Edwards R. T., Rubio-Herrera E., van Leeuwen J., Weltevrede P., 2009, A&A, 498, 223
- Johnston et al. (2008) Johnston S. et al., 2008, Experimental Astronomy, 22, 151
- Kaplan (2008) Kaplan D. L., 2008, in American Institute of Physics Conference Series, Vol. 968, Yuan Y.-F., Li X.-D., Lai D., ed, Astrophysics of Compact Objects, p. 129
- Kaplan et al. (2009) Kaplan D. L., Esposito P., Chatterjee S., Possenti A., McLaughlin M. A., Camilo F., Chakrabarty D., Slane P. O., 2009, MNRAS, 400, 1445
- Karastergiou et al. (2009) Karastergiou A., Hotan A. W., van Straten W., McLaughlin M. A., Ord S. M., 2009, MNRAS, 396, 95
- Keane (2010) Keane E. F., 2010, Ph.D. thesis, University of Manchester, Published in Springer Theses Series, DOI:10.1007/978-3-642-19627-0
- Keane & Kramer (2008) Keane E. F., Kramer M., 2008, MNRAS, 391, 2009
- Keane et al. (2010) Keane E. F., Ludovici D. A., Eatough R. P., Kramer M., Lyne A. G., McLaughlin M. A., Stappers B. W., 2010, MNRAS, 401, 1057
- Keane et al. (2011) Keane E. F., Kramer M., Lyne A. G., Stappers B. W., McLaughlin M. A., 2011, MNRAS, 415, 3065
- Keith et al. (2009) Keith M. J., Eatough R. P., Lyne A. G., Kramer M., Possenti A., Camilo F., Manchester R. N., 2009, MNRAS, 395, 837
- Keith et al. (2010) Keith M. J. et al., 2010, MNRAS, 409, 619
- Kramer (2008) Kramer M., 2008, in American Institute of Physics Conference Series, Vol. 983, C. Bassa, Z. Wang, A. Cumming, & V. M. Kaspi , ed, 40 Years of Pulsars: Millisecond Pulsars, Magnetars and More, p. 11
- Kramer et al. (2003) Kramer M. et al., 2003, MNRAS, 342, 1299
- Kramer et al. (2006) Kramer M., Lyne A. G., O’Brien J. T., Jordan C. A., Lorimer D. R., 2006, Science, 312, 549
- Li (2006) Li X.-D., 2006, ApJ, 646, L139
- Lorimer & Kramer (2005) Lorimer D. R., Kramer M., 2005, Handbook of Pulsar Astronomy. Cambridge University Press
- Lorimer et al. (2006) Lorimer D. R. et al., 2006, MNRAS, 372, 777
- Lorimer et al. (2007) Lorimer D. R., Bailes M., McLaughlin M. A., Narkevic D. J., Crawford F., 2007, Science, 318, 777
- Luo & Melrose (2007) Luo Q., Melrose D., 2007, MNRAS, 378, 1481
- Lyne & Smith (2004) Lyne A. G., Smith F. G., 2004, Pulsar Astronomy, 3rd ed., Cambridge University Press, Cambridge
- Lyne et al. (2009) Lyne A. G., McLaughlin M. A., Keane E. F., Kramer M., Espinoza C. M., Stappers B. W., Palliyaguru N. T., Miller J., 2009, MNRAS, 400, 1439
- Lyne et al. (2010) Lyne A., Hobbs G., Kramer M., Stairs I., Stappers B., 2010, Science, 329, 408
- Magro et al. (2011) Magro A., Karastergiou A., Salvini S., Mort B., Dulwich F., Zarb Adami K., 2011, MNRAS in press (astro-ph/1107.2516)
- Manchester et al. (1996) Manchester R. N. et al., 1996, MNRAS, 279, 1235
- Manchester et al. (2001) Manchester R. N. et al., 2001, MNRAS, 328, 17
- Maron et al. (2000) Maron O., Kijak J., Kramer M., Wielebinski R., 2000, A&AS, 147, 195
- McLaughlin (2009) McLaughlin M., 2009, in Becker W., ed., Astrophysics and Space Science Library, 357, 41
- McLaughlin (2011) McLaughlin M., 2011, (astro-ph/1103.1278)
- McLaughlin & Cordes (2003) McLaughlin M. A., Cordes J. M., 2003, ApJ, 596, 982
- McLaughlin et al. (2006) McLaughlin M. A. et al., 2006, Nature, 439, 817
- McLaughlin et al. (2007) McLaughlin M. A. et al., 2007, ApJ, 670, 1307
- McLaughlin et al. (2009) McLaughlin M. A. et al., 2009, MNRAS, 400, 1431
- Miller et al. (2011) Miller J., McLaughlin M., Rea N., Keane E., Lyne A., Kramer M., Manchester R., Lazaridis K., 2011 (astro-ph/1101.5637)
- Morris et al. (2002) Morris D. J. et al., 2002, MNRAS, 335, 275
- Nan et al. (2011) Nan R. et al., 2011, International Journal of Modern Physics D, 20, 989
- Nice (1999) Nice D. J., 1999, ApJ, 513, 927
- Oppenheimer & Volkoff (1939) Oppenheimer J. R., Volkoff G., 1939, Phys. Rev., 55, 374
- Palliyaguru et al. (2011) Palliyaguru N. et al., 2011, MNRAS in press (astro-ph/1107.0991)
- Popov et al. (2006) Popov, S. B., Turolla, R., & Possenti, A. 2006, MNRAS, 369, L23
- Ransom (2001) Ransom S. M., 2001, Ph.D. thesis, Harvard University
- Rea & McLaughlin (2008) Rea N., McLaughlin M., 2008, in American Institute of Physics Conference Series, Vol. 968, Y.-F. Yuan, X.-D. Li, & D. Lai , ed, Astrophysics of Compact Objects, p. 151
- Rea et al. (2009) Rea N. et al., 2009, ApJ, 703, L41
- Rea et al. (2010) Rea N. et al., 2010, MNRAS, 407, 1887
- Reynolds et al. (2006) Reynolds S. et al., 2006, ApJ, 639, L71
- Ridley & Lorimer (2010) Ridley J. P., Lorimer D. R., 2010, MNRAS, 404, 1081
- Rosen et al. (2010) Rosen R. et al., 2010, Astronomy Education Review, 9, 010106
- Rosen et al. (2011) Rosen R., McLaughlin M. A., Thompson S. E., 2011, ApJ, 728, L19
- Rubio-Herrera (2010) Rubio-Herrera E., 2010, Ph.D. thesis, University of Amsterdam
- Shearer et al. (2003) Shearer A., Stappers B., O’Connor P., Golden A., Strom R., Redfern M., Ryan O., 2003, Science, 301, 493
- Shitov et al. (2009) Shitov Y. P., Kuzmin A. D., Dumskii D. V., Losovsky B. Y., 2009, Astronomy Reports, 53, 561
- Spitkovsky (2006) Spitkovsky A., 2006, ApJ, 648, L51
- Staelin & Reifenstein (1968) Staelin D. H., Reifenstein E. C., III, 1968, Science, 162, 1481
- Stappers et al. (2011) Stappers B. W. et al., 2011, A&A, 530, A80
- Thompson & Duncan ( 1996) Thompson C., Duncan R. C., 1996, ApJ, 473, 322
- Timokhin (2006) Timokhin A. N., 2006, MNRAS, 368, 1055
- Timokhin (2010) Timokhin A. N., 2010, MNRAS, 408, L41
- van Leeuwen (2011) van Leeuwen J. , 2011, Advances in Space Research, 47, 1441
- van Leeuwen & Stappers (2010) van Leeuwen J., Stappers B. W., 2010, A&A, 509, A7
- Wang et al. (2007) Wang N., Manchester R. N., Johnston S., 2007, MNRAS, 377, 1383
- Weltevrede et al. (2006) Weltevrede P., Stappers B. W., Rankin J. M., Wright G. A. E., 2006, ApJ, 645, L149