Magnetic excitations in the spin-5/2 antiferromagnetic trimer substance SrMn3P4O14
Abstract
A quantum-mechanical 1/3 magnetization plateau and magnetic long-range order appear in the large-spin (5/2) substance SrMn3P4O14. Magnetization results of SrMn3P4O14 can be explained by the spin-5/2 isolated antiferromagnetic linear trimer with the intra-trimer interaction () value of 4.0 K. In the present study, to confirm the spin system, we performed inelastic neutron scattering (INS) experiments of SrMn3P4O14 powders. We observed plural magnetic excitations. The peak positions are 0.46, 0.68, and 1.02 meV. Constant--scan spectra at several values (magnitude of the scattering vector) indicate that the dispersion is weak. The weak dispersion indicates that the excitations are transitions between discrete energy levels. Our INS results are consistent with results expected in the trimer model. We evaluated the value as 0.29 meV (3.4 K) without considering the other interactions.
pacs:
75.40.Gb, 75.10.Jm, 75.47.Lx, 75.50.EeI Introduction
Quantum-mechanical nature is sometimes apparent even in an ordered state of several low-dimensional spin systems formed by small spins. In the triangular antiferromagnet CsCuCl3 with spin-1/2, a small jump was observed in the magnetization curve in the magnetic field parallel to the axis.Nojiri88 This jump was successfully explained as a spin flop process caused by quantum-mechanical effects.Nikuni93 In spin-gap systems with spin-1/2 such as the spin-Peierls system in CuGeO3 Hase93a ; Hase93c and the two-leg ladder system in SrCu2O3,Dagotto92 ; Azuma94 antiferromagnetic long-range order (AF-LRO) appears when small amounts of impurities were doped.Hase93b ; Hase95 ; Hase96a ; Azuma97 ; Azuma98 , Nonetheless excitations originating in the singlet-triplet gap in the pure system were observed.Martin97
It has not been studied adequately whether the quantum-mechanical nature can remain in an ordered state of spin systems formed by large spins. Quantum-mechanical nature is apparent in the ordered state of the spin-5/2 substance SrMn3P4O14.Yang08 The temperature dependence of the magnetic susceptibility indicates occurrence of a magnetic LRO below about 2.6 K. A 1/3 magnetization plateau in magnetization curves was observed at both 1.3 K and 4.2 K (below and above the transition temperature).Yang08 ; Hase09 The plateau was observed in a powder sample. Therefore, the plateau can appear irrespective of the applied magnetic field direction. As a result, the plateau is a quantum-mechanical magnetization plateau generated by an energy gap in the magnetic excitation spectrum.
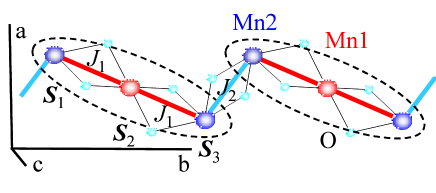
It is important to determine the origins of the quantum-mechanical nature (magnetization plateau) in SrMn3P4O14. We could explain well the magnetic-field and dependences of the magnetization using the spin-5/2 isolated linear trimer formed by the AF interaction ( K) depicted as ellipses in Fig.1.Hase09 Therefore, we consider that the magnetization plateau originates in discrete energy levels of the AF trimer. If the AF trimer model is valid, we can observe magnetic excitations indicating the discrete energy levels even in powder samples. Consequently, we performed inelastic neutron scattering experiments of SrMn3P4O14 powders.
II Methods of Experiments
We synthesized single crystals of SrMn3P4O14 under hydrothermal conditions at 473 K.Yang08 Each crystal was small. We used pulverized crystals for inelastic neutron scattering (INS) measurements.
We carried out INS measurements on the cold neutron triple-axis spectrometer LTAS installed at JRR-3M in JAEA. The final neutron energy was fixed at 2.6 meV. Higher-order beam contamination was effectively eliminated using a cooled Be filter before the sample. The horizontal collimator sequence was guide-80’-Be-sample-120’-open. This setup yields an energy resolution of 0.1 meV (full width at half maximum, FWHM) at an energy transfer meV. The resolution was determined from incoherent scattering of the sample. The powder sample of about 9 g was mounted in a 4He closed cycle refrigerator.
III Results and discussion
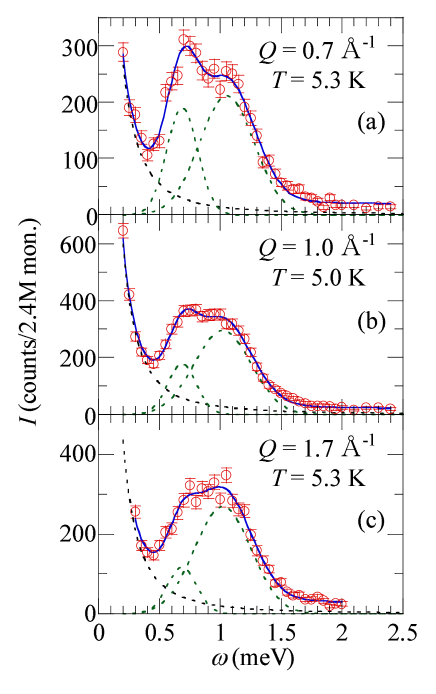
We performed all the INS measurements above the transition temperature. Circles in Fig. 2 show the dependence of the INS intensity (constant- scan spectra) around 5 K. The value of is the magnitude of the scattering vector. Excitations are apparent between 0.5 and 1.5 meV. Two kinds of excitations with different peak positions seem to overlap each other. The spectra are almost independent of except for difference in intensities. The weak dependence indicates that the excitations are transitions between discrete energy levels. We consider that the intensities in the vicinity of 0 meV cannot be explained only by incoherent scattering because of dependence of spectra as shown later. Low-energy excitations exist.
We compared each spectrum above 0.2 meV in Fig. 2 with a sum of two Gaussians and one Lorentzian (plus constant backgrounds).
| (1) |
Here the sum is from to 2. The two Gaussians correspond to the excitations between 0.5 and 1.5 meV. The Lorentzian corresponds to the excitations in the vicinity of 0 meV. Each sum of two Gaussians and one Lorentzian (solid line) reproduces well the corresponding spectrum in Fig. 2. Obtained values of the fitting parameters are shown in Table I. The peak position in the spectrum at Å-1 is 0.68 meV or 1.02 meV. The peak width (FWHM) is 0.28 meV and 0.55 meV for the 0.68 meV and 1.02 meV excitation, respectively. These widths are larger than the energy resolution of 0.1 meV at meV, indicating existence of weak dispersion caused by inter-trimer interactions.
| 0 meV | 0.68(1) meV | 1.02(2) meV | 0.46(5) meV | ||||||
| FWHM | FWHM | FWHM | FWHM | ||||||
| Å-1 | K | meV | meV | meV | meV | ||||
| 0.7 | 5.3 | 379(58) | 0.24(8) | 60(9) | 0.30(3) | 119(11) | 0.53(5) | ||
| 0.8 | 5.7 | 475(136) | 0.31(10) | 58(8) | 0.34(4) | 159(21) | 0.62(10) | ||
| 1.0 | 5.0 | 1091(33) | 0.16(4) | 52(9) | 0.28(3) | 172(13) | 0.55(4) | ||
| 1.2 | 5.4 | 1123(34) | 0.16(4) | 32(9) | 0.25(5) | 190(14) | 0.53(4) | ||
| 1.5 | 5.1 | 968(54) | 0.18(3) | 31(6) | 0.23(3) | 177(13) | 0.54(3) | ||
| 1.7 | 5.3 | 795(51) | 0.16(4) | 36(13) | 0.29(6) | 157(13) | 0.55(6) | ||
| 1.0 | 5.0 | 1091(33) | 0.16(4) | 52(9) | 0.28(3) | 172(13) | 0.55(4) | ||
| 11.2 | 562(296) | 0.43(20) | 36(6) | 0.28 | 156(12) | 0.55 | 17(12) | 0.25(0.14) | |
| 15.6 | 515(78) | 0.53(7) | 31(6) | 0.28 | 141(12) | 0.55 | 17(11) | 0.25 | |
| 20.3 | 518(179) | 0.56(16) | 29(6) | 0.28 | 117(11) | 0.55 | 17(10) | 0.25 | |
Circles in Fig. 3 show constant- scan spectra at Å-1. The 0.68 meV and 1.02 meV excitations are also seen at 11.2 K. Intensities around 0.5 meV are larger at 11.2 K than at 5.0 K, suggesting appearance of another transition. Therefore, we compared the spectrum above 0.2 meV at 11.2 K with a sum of three Gaussians and one Lorentzian (plus constant backgrounds) given in Eq. (1) with to 3. To reduce variable parameters, we assumed that the peak position (0 meV) of the Lorentzian, and the peak positions (0.68 and 1.02 meV) and widths of the two Gaussians were constant. We used the values obtained at 5.0 K. This assumption is reasonable for transitions between discrete energy levels. The sum of the three Gaussians and one Lorentzian (solid line) reproduces well the spectrum at 11.2 K. The peak position of the third Gaussian is 0.46 meV. The peak width (FWHM) is 0.25 meV and is larger than the energy resolution of 0.1 meV at meV.
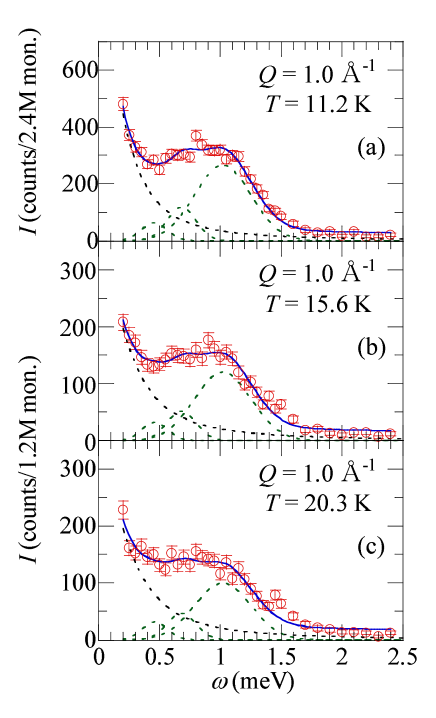
The spectra at 15.6 K and 20.3 K shown respectively in Figs. 3(b) and (c) resemble the spectrum at 11.2 K. Therefore, we compared the spectrum above 0.2 meV at 15.6 K or 20.3 K with a sum of three Gaussians and one Lorentzian (plus constant backgrounds) given in Eq. (1) with to 3. In the fitting, we assumed that the peak position of the Lorentzian, and the peak positions and widths of the three Gaussians were constant. The sum (solid line) reproduces well each experimental spectrum. Spectra are featureless above 30 K. We did not compare the spectra with calculated curves. The integrated intensity between 0.5 and 1.5 meV decreases slightly on heating. The Bose factor proportional to phonon intensity at 0.68 meV and 20.3 K, on the other hand, is about 9 times as large as that at 0.68 meV and 5.0 K. Therefore, contribution of phonon is small enough and magnetic excitations are dominant between 0.5 and 1.5 meV.
We examined whether the spin-5/2 AF trimer model with K can account for the observed excitations. Figures 4(a) depicts a schematic drawing of low-lying energy levels.Hase09 The following selection rules of transitions are derived theoretically.Furrer79
| (2) |
is the spin operator in the trimer. and is defined as and , respectively. is the component of . Arrows in Fig. 4(a) indicate allowed transitions from the ground state (GS), first-excited state (1ES) or second-excited states (2ES). In our experimental setup, we can observe transitions with an energy difference up to 8 when K. Here, is defined as (: eigen energy).
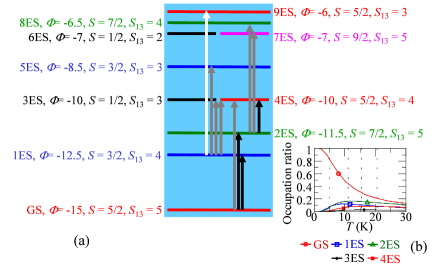
Figure 4(b) depicts dependence of calculated occupation ratio of the five low-lying energy levels. An inelastic neutron scattering intensity strongly depends on the occupation ratio. From Fig. 4(b), we know that excitations from GS are dominant around 5 K. We considered that the 0.68 and 1.02 meV excitations correspond to transitions from GS to 1ES and 2ES, respectively, indicated by black arrows. The respective energy differences are and . The value of is evaluated as 0.27 meV (3.2 K) or 0.29 meV (3.4 K). These values are slightly smaller than the value determined in the magnetization results ( K). Excitations from 1ES or 2ES are also expected at 11.2 K. We considered that the 0.46 meV excitation corresponds to the transition from 2ES to 4ES indicated by a black arrow. The energy difference is . The value of is evaluated as 0.30 meV (3.5 K) and is close to the values evaluated from the other two transitions.
We examined whether we observed all the allowed transitions that are possible in our experimental setup. As was described, we observed the three black-arrow transitions. The gray-arrow transitions may exist. However, we could not prove the existence of the gray-arrow transitions. Energy differences of some gray-arrow transitions ( and ) are the same as or close to the energy differences of black-arrow transitions ( and ). Therefore, we could not extract contribution of the gray-arrow transitions from the experimental results. Energy differences of the other gray-arrow transitions are meV and meV when meV. Small INS intensities are seen around these energies in Figs. 2 and 3. In our analyses, the small intensities correspond to the tail of the 1.02 meV excitation. However, the peak width is larger in the 1.02 meV excitation (FWHM = 0.55 meV) than in the 0.46 meV excitation (FWHM = 0.25 meV) or the 0.68 meV excitation (FWHM = 0.28 meV). The gray-arrow transitions may exist in the tail. We could not detect the white-arrow transition. We do not have theoretical INS intensities. Therefore, we could not determine the reason why we could not detect the white-arrow transition. The INS intensity of the white-arrow transition may be very small. Transitions from 3ES or higher excited states must exist at 11.2 K and higher . However, we could not prove existence of these transitions because of the same reason for the gray-arrow and white-arrow transitions in Fig. 4(a)
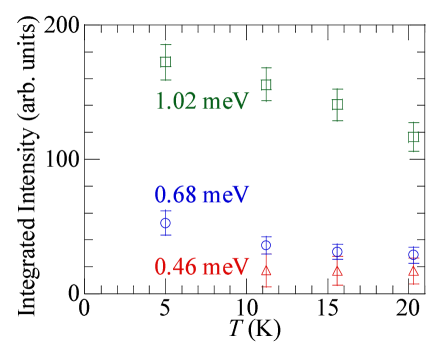
Figure 5 shows the dependence of the integrated intensity of the 0.46, 0.68, and 1.02 meV excitations. The integrated intensity of the 0.46 meV excitation is nearly independent of . The integrated intensity of the 0.68 or 1.02 meV excitation gradually decreases with increasing . As is shown in Fig. 4(a), several transitions are expected to exist. Therefore, the dependence of the integrated intensity in Fig. 5 cannot be compared directly with the occupations ratios in Fig. 4(b).
The dependence of the INS intensity in the AF trimer is given in the following formula.Furrer79 ; Matsuda05 ; Podlesnyak07
| (3) |
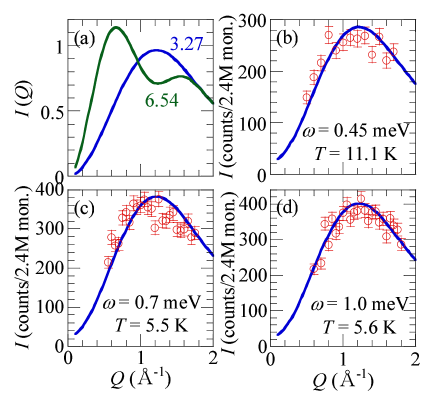
The values 3.27 and 6.54 indicates the Mn1-Mn2 and Mn2-Mn2 length in the AF trimer, respectively. The function is the magnetic form factor of Mn2+ ions.InternationalTable The coefficients and depend on two eigen states between which the transition occurs. The coefficients are not derived theoretically. Figure 6(a) represents the two terms in Eq. (3). Circles in Figs. 6(b) - (d) show constant- scan spectra of SrMn3P4O14. The lines indicate the first term in Eq. (3) plus constant backgrounds. The INS intensity in the vicinity of meV is small and almost independent of , , and . Therefore, we used the intensity at meV for the value of constant backgrounds. The each line is consistent with the corresponding constant- scan spectrum. If is much larger than in the observed transitions, this consistency indicates that the AF trimer model can explain the experimental .
We comment on inter-trimer interactions. The dispersion relation of magnetic excitations was calculated in spin dimers with weak inter-dimer interactions using random phase approximation.Leuenberger84 A similar dispersion relation was inferred in interacting spin tetramers.Hafliger09 According to the results, we speculate that the following dispersion relation may be applicable to spin trimers with weak inter-trimer interactions.
| (4) |
Here, is an energy difference between ground and excited states. is a coefficient derived from transition matrix elements. The value of is 2 for the spin-1/2 dimer Sasago97 or 5 for the spin-3/2 dimer.Leuenberger84 is a Fourier transform of inter-trimer interactions. is a difference in thermal populations of ground and excited states. We consider that the dominant inter-trimer interaction is the interaction. is expressed approximately as . We assume that excitation energies are the same at 0 and 5.0 K. The excitation energy at 0 K at the bottom of the dispersion , where the INS intensity is the strongest, is expressed as follows.
| (5) |
We assume that only the interaction is the origin of the difference between the expected excitation energy K and experimental excitation energy 0.68 meV = 7.9 K in the transition between GS and 1ES. Using K and K, we obtained K. If is large, a value can be small enough in comparison with the value.
We observed magnetic excitations that are consistent with excitations expected in the spin-5/2 AF trimer. Therefore, the discrete energy levels of the AF trimer are the origins of the quantum-mechanical nature (magnetization plateau) in SrMn3P4O14. In the strict sense, the energy difference between GS (S=5/2) and 2ES (S=7/2) generates the magnetization plateau. The magnetization plateau appears even in the ordered state.Yang08 ; Hase09 The property of the cluster (trimer in this case) can remain in the ordered state. The total spin of the ground state of the AF trimer is finite (5/2). Therefore, we consider that the magnetic LRO is stabilized by the and weak three-dimensional inter-trimer interactions. Several cluster substances can maintain their cluster properties in their ordered states. For example, the 1/2 quantum-mechanical magnetization plateau is generated by discrete energy levels of a spin-1/2 tetramer in Cu2CdB2O6.Hase05 ; Hase09b The plateau remains in the ordered state. With the aid of other researchers, some of the present authors determined the magnetic structure below the transition temperature of K using neutron powder diffraction data.Hase11 The magnetic structure has a long-range period. We are now considering the origin of the long-range period. We will report details of the magnetic structure in a subsequent paper.
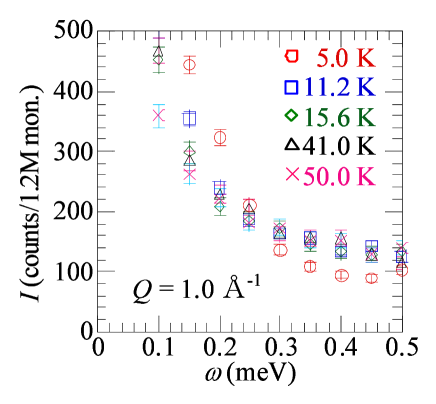
We comment on the INS intensity in the vicinity of 0 meV. Figure 7 shows constant- scan spectra at Å-1 below 0.5 meV. As was described, the increase of the intensity around 0.4 meV is caused by the 0.46 meV excitation. The intensity between 0.1 and 0.2 meV decreases with increasing . This temperature dependence cannot be explained by incoherent scattering or phonon. In addition, we observed diffuse scattering between and in neutron powder diffraction patterns (wavelength Å).Hase11 This range corresponds to to 1.7 Å-1 in the present INS experiments. The shape of the diffuse scattering resembles one-dimensional or two-dimensional Bragg scattering with a cutoff at low and long tail at large . The integrated intensity of the diffuse scattering shows a maximum in the vicinity of . Several magnetic reflections appear below between and . Therefore, the origin of the diffuse scattering is magnetic. Consequently, magnetic excitations exist in the vicinity of 0 meV. The magnetic excitations cannot be explained by transitions between energy levels in the trimer. Spin fluctuation in the ground state generates the magnetic excitations. Therefore, we used the Lorentzian with the 0 meV peak in the fitting of the constant- scan spectra in Figs. 2 and 3. In future studies, we will perform INS measurements of SrMn3P4O14 in the ordered state. Anisotropy of the Mn2+ spins is small.Hase09 Therefore, a gap of spin-wave excitations is small. We may observe spin-wave excitations in the vicinity of 0 meV in addition to the trimer excitations.
IV Summary
In order to confirm the spin system, we performed inelastic neutron scattering (INS) experiments of powders of the spin-5/2 antiferromagnetic trimer substance SrMn3P4O14. We observed plural magnetic excitations. The peak positions are 0.46, 0.68, and 1.02 meV. The weak dependence of constant--scan spectra indicates that the excitations are transitions between discrete energy levels. The experimental results are consistent with results expected in the trimer model with the intra-trimer interaction value of 0.29 meV (3.4 K) without considering the other interactions.
Acknowledgements.
We are grateful to T. Masuda for invaluable discussion. The neutron scattering experiments were carried out in the framework of JAEA Users’ Program and within the NIMS-RIKEN-JAEA Cooperative Research Program on Quantum Beam Science and Technology. This work was partially supported by grants from NIMS.References
- (1) H. Nojiri, Y. Tokunaga, and M. Motokawa, J. Phys. (Paris), 49, 1459 (1988).
- (2) T. Nikuni and H. Shiba, J. Phys. Soc. Jpn. 62, 3268 (1993).
- (3) M. Hase, I. Terasaki, and K. Uchinokura, Phys. Rev. Lett. 70, 3651 (1993).
- (4) M. Hase, I. Terasaki, K. Uchinokura, M. Tokunaga, N. Miura, and H. Obara, Phys. Rev. B 48, 9616 (1993).
- (5) E. Dagotto, J. Riera, and D. Scalapino, Phys. Rev. B 45, R5744 (1992).
- (6) M. Azuma, Z. Hiroi, M. Takano, K. Ishida, and Y. Kitaoka, Phys. Rev. Lett. 73, 3463 (1994).
- (7) M. Hase, I. Terasaki, Y. Sasago, K. Uchinokura, and H. Obara, Phys. Rev. Lett. 71, 4059 (1993).
- (8) M. Hase, N. Koide, K. Manabe, Y. Sasago, K. Uchinokura, and A. Sawa, Physica B 215, 164 (1995).
- (9) M. Hase, K. Uchinokura, R. J. Birgeneau, K. Hirota, and G. Shirane, J. Phys. Soc. Jpn. 65, 1392 (1996).
- (10) M. Azuma, Y. Fujishiro, M. Takano, M. Nohara, and H. Takagi, Phys. Rev. B 55, R8658 (1997).
- (11) M. Azuma, M. Takano, and R. S. Eccleston, J. Phys. Soc. Jpn. 67, 740 (1998).
- (12) M. C. Martin, M. Hase, K. Hirota, G. Shirane, Y. Sasago, N. Koide, and K. Uchinokura, Phys. Rev. B 56, 3173 (1997).
- (13) T. Yang, Y. Zhang, S. Yang, G. Li, M. Xiong, F. Liao, and J. Lin, Inorg. Chem. 47, 2562 (2008).
- (14) M. Hase, T. Yang, R. Cong, J. Lin, A. Matsuo, K. Kindo, K. Ozawa, and H. Kitazawa, Phys. Rev. B 80, 054402 (2009).
- (15) A. Furrer and H. U. Güdel, J. Magn. Magn. Mater. 14, 256 (1979).
- (16) M. Matsuda, K. Kakurai, A. A. Belik, M. Azuma, M. Takano, M. Fujita, Phys. Rev. B 71, 144411 (2005).
- (17) A. Podlesnyak, V. Y. Pomjakushin, E. V. Pomjakushina,K. Conder, and A. Furrer, Phys. Rev. B 76, 064420 (2007).
- (18) P. J. Brown, International Tables for Crystallography Vol. C (Edited by E. Prince), chapter 4.4.5 (Magnetic form factors), 454.
- (19) B. Leuenberger, A. Stebler, H. U. Güdel, A. Furrer, R. Feile, and J. K. Kjems, Phys. Rev. B 30, 6300 (1984).
- (20) P. S. Häfliger, S. T. Ochsenbein, B. Trusch, H. U. Güdel, and A. Furrer, J. Phys.: Condens. Matter 21, 026019 (2009).
- (21) Y. Sasago, K. Uchinokura, A. Zheludev, and G. Shirane Phys. Rev. B 55, 8357 (1997).
- (22) M. Hase, M. Kohno, H. Kitazawa, O. Suzuki, K. Ozawa, G. Kido, M. Imai, and X. Hu, Phys. Rev. B 72, 172412 (2005).
- (23) M. Hase, A. Dönni, V. Yu. Pomjakushin, L. Keller, F. Gozzo, A. Cervellino, and M. Kohno, Phys. Rev. B 80, 104405 (2009).
- (24) M. Hase et al., unpublished.