Underflight calibration of SOHO/CDS and Hinode/EIS with EUNIS-07
Abstract
Flights of Goddard Space Flight Center’s Extreme-Ultraviolet Normal-Incidence Spectrograph (EUNIS) sounding rocket in 2006 and 2007 provided updated radiometric calibrations for SOHO/CDS and Hinode/EIS. EUNIS carried two independent imaging spectrographs covering wavebands of 300370 Å in first order and 170205 Å in second order. After each flight, end-to-end radiometric calibrations of the rocket payload were carried out in the same facility used for pre-launch calibrations of CDS and EIS. During the 2007 flight, EUNIS, SOHO CDS and Hinode EIS observed the same solar locations, allowing the EUNIS calibrations to be directly applied to both CDS and EIS. The measured CDS NIS 1 line intensities calibrated with the standard (version 4) responsivities with the standard long-term corrections are found to be too low by a factor of 1.5 due to the decrease in responsivity. The EIS calibration update is performed in two ways. One is using the direct calibration transfer of the calibrated EUNIS-07 short wavelength (SW) channel. The other is using the insensitive line pairs, in which one member was observed by EUNIS-07 long wavelength (LW) channel and the other by EIS in either LW or SW waveband. Measurements from both methods are in good agreement, and confirm (within the measurement uncertainties) the EIS responsivity measured directly before the instrument’s launch. The measurements also suggest that the EIS responsivity decreased by a factor of about 1.2 after the first year of operation (although the size of the measurement uncertainties is comparable to this decrease). The shape of the EIS SW response curve obtained by EUNIS-07 is consistent with the one measured in laboratory prior to launch. The absolute value of the quiet-Sun He ii 304 Å intensity measured by EUNIS-07 is consistent with the radiance measured by CDS NIS in quiet regions near the disk center and the solar minimum irradiance obtained by CDS NIS and SDO/EVE recently.
Subject headings:
instrumentation: spectrographs — Sun: activity — Sun: corona — Sun: UV radiation1. Introduction
The extreme ultraviolet (EUV; 150 – 1200 Å) waveband is replete with emission lines formed at temperatures that range from several times K to several times K, and is thus well suited for studying numerous features and phenomena that occur in the solar atmosphere. Like most solar EUV instruments, the Solar EUV Research Telescope and Spectrograph (SERTS) sounding rocket payload observed only part of the EUV waveband. SERTS was designed to improve on earlier solar EUV instrumentation by (1) retaining the stigmatic imaging capability of the NRL spectroheliograph on Skylab (Tousey et al., 1977) but with a spatial selection capability that reduced image overlap, and (2) achieving high spectral resolution. The version of SERTS flown in 1989 (SERTS-89; Neupert et al., 1992) gathered EUV radiation with a grazing incidence telescope (as did subsequent SERTS flights), and carried a standard gold-coated toroidal diffraction grating. SERTS-89 observed hundreds of first-order emission lines between 235 and 450 Å, as well as dozens of second-order lines between 170 and 225 Å (Thomas & Neupert, 1994; Young et al., 1998). The version of SERTS flown in 1991 (SERTS-91; Brosius et al., 1993, 1996; Falconer, 1994) and 1993 (SERTS-93; Brosius et al., 1996, 1997a, 1997b) incorporated a multilayer-coated diffraction grating that enhanced the instrument’s first-order responsivity over that of the gold-coated grating by factors up to nine. The version flown in 1995 (SERTS-95; Brosius, Davila, & Thomas, 1998a, b; Brosius et al., 1999) incorporated a multilayer-coated grating that enhanced the instrument’s second-order ( 170 – 225 Å) responsivity, thus bringing out many lines that had not been seen during any of the previous flights, and allowing them to be measured with the highest spectral resolution ( 30 mÅ) ever achieved for spatially resolved active region and quiet-Sun spectra in this wavelength range.
For the SERTS flights of 1989–1995 data were recorded on EUV-sensitive photographic film that was developed and digitized after each flight. For the flights of 1989–1993 the relative radiometric calibration was derived by combining laboratory measurements of component responsivities with “insensitive ratios” (solar emission line pairs whose intensity ratios are insensitive to variations in the electron density and temperature), while for the flight of 1995 the relative radiometric calibration was derived strictly by the insensitive ratio method. In all four cases the relative radiometric calibration was placed onto an absolute scale by requiring the sum of the He ii 303.78 Å and Si xi 303.32 Å quiet-Sun intensities to match the values reported by Mango et al. (1978) based on earlier observations from satellites and sounding rockets. In Mango et al. (1978) the summed intensity is 7115 ergs cm-2s-1sr-1 at disk center and brightens by about 30% toward the limb. The absolute radiometric calibration of SERTS derived this way was estimated to be accurate within a factor better than 2.
The version of SERTS flown in 1997 (SERTS-97; Brosius et al., 2000a, b) incorporated the same multilayer-coated toroidal diffraction grating that was flown in 1991 and 1993, but recorded spectrographic data on an intensified CCD-detector. Its spectral bandpass was 299 – 353 Å, with an instrumental resolution (FWHM) of 115 mÅ. An end-to-end radiometric calibration of SERTS-97 was performed after the flight at Rutherford-Appleton Laboratory (RAL), UK, in the same facility used to calibrate the Coronal Diagnostic Spectrometer (CDS; Harrison et al., 1995) on the Solar and Heliospheric Observatory (SOHO) spacecraft and the Extreme-ultraviolet Imaging Spectrometer (EIS; Culhane et al., 2007) aboard the Hinode satellite (Kosugi et al., 2007), and using the same EUV light source re-calibrated by Physikalisch-Technische Bundesanstalt (PTB) against the synchrotron radiation of BESSY I (a primary radiation standard). This was the first time that the SERTS instrument underwent an absolute radiometric calibration while fully assembled. The uncertainty on the SERTS-97 absolute radiometric calibration was 15%. Coordinated, cospatial, time-invariant SERTS-97 and CDS spectra were used to carry out an intensity cross-calibration that yielded an improved responsivity curve for the CDS Normal Incidence Spectrometer’s NIS 1 (308 – 380 Å) waveband (Thomas et al., 1999; Thomas, 2002). The importance of a reliable radiometric calibration for SERTS, CDS, EIS, or any EUV instrument cannot be over emphasized. Without it, quantitative analyses of properties like temperature, density, emission measure, and element abundances, along with the physical interpretations that emerge from studies of those properties, are impossible.
The Extreme Ultraviolet Normal Incidence Spectrograph (EUNIS) is the successor to SERTS. EUNIS contains two independent but co-pointing spectrographs (each with a normal incidence telescope), one of which covers a short wavelength (SW; 170–205 Å) channel while the other covers a long wavelength (LW; 300–370 Å) channel. The instrument and its end-to-end absolute radiometric calibration is described below. Spectra obtained from the 2006 flight (EUNIS-06) were used to investigate a bright point (Brosius, Rabin, & Thomas, 2007; Brosius et al., 2008), a cool transient brightening (Brosius, Rabin, & Thomas, 2008), and transition region velocity oscillations (Jess et al., 2008), as well as to derive a calibration update for CDS NIS 1 (Wang et al., 2010). EUNIS was last flown on 2007 November 6, when the solar disk contained no active regions. EUNIS-07 obtained coordinated observations of quiet-Sun areas near disk center with both CDS and EIS. In what follows we derive updates to the CDS and EIS absolute radiometric calibrations based on these coordinated observations. Section 2 describes the observations and data reduction; §3 discusses the absolute radiometric calibration of the EUNIS-06 and EUNIS-07 long wavelength channel; in §4 we derive the calibration update for CDS NIS with EUNIS-07; §5 presents the absolute radiometric calibration of the EUNIS-07 SW channel; in §6 we derive the calibration update for both EIS channels with EUNIS-07; and in §7 we discuss and summarize our conclusions.
2. Observations and data reduction
EUNIS-07 was launched from White Sands Missile Range, New Mexico, at 18:00 UT on 2007 November 6. It has a payload mass of 473 kg and reached an apogee of 303 km, spending 369 s above 150 km where low EUV extinction permits science-quality data. A total of 257 exposures, each containing solar spectra and images, were recorded between 1802 and 1808 UT with a frame rate of 1.3 s. EUNIS observed the quiet region with bright points near the solar disk center. Coordinated observations were obtained with the Hinode/EIS, the EUV Imaging Telescope (EIT; Delaboudinière et al., 1995) and the CDS aboard SOHO, as well as the Transition Region and Coronal Explorer (; Handy et al., 1999). We coalign the data from different instruments using a cross-correlation method by taking EIT images as reference.
2.1. EUNIS
EUNIS comprises two independent, spatially co-aligned telescope/spectrographs of identical optical design, one covering EUV lines between 300 and 370 Å seen in first order (LW channel), and a second covering lines between 170 and 205 Å seen in second order (SW channel). Each telescope is a 110-mm diameter off-axis parabola that forms a real image on a precision slit formed from a single-crystal silicon wafer using a technique developed at GSFC. The slit image is dispersed, magnified and reimaged by a toroidal grating onto the entrance face of a microchannel plate (MCP) intensifier. Each slit has a “dumbbell” configuration. The center 660 is a conventional narrow slit (2). Above and below the narrow slit is a 150200 “lobe” that acts as a slitless spectrograph to produce monochromatic context images in strong emission lines. These images have proven to be extremely useful for coaligning EUNIS spectra with other instruments. EUNIS has a designed first-order spectral dispersion of 25 mÅ pixel-1 and a designed spatial scale of 0.927 pixel-1 (Thomas & Davila, 2001). For the flight of EUNIS-06, its optics limited the actual spatial resolution to about 5 and the measured spectral resolution was 200 and 100 mÅ FWHM in the LW and SW channels.
For the flight of EUNIS-07, the lobe-slit fields of view (FOVs) were oriented North-South near the center of the solar disk. In this flight all observations were made in scanning mode. The solar image was scanned perpendicular to the slit at a continuous rate of about 2.4 s-1 with full spectral images on all detectors recorded every 1.3 s (maximum frame rate). Pointing began at nominal field center, scanned eastward to 50, reversed, scanned westward to 50, and returned to center. This operation was repeated until the door was closed, giving almost 7 complete 660100 spectroheliograms in addition to 253 lobe images in LW channel and 256 in SW channel. All of the raw data were processed with several routine adjustments, including dark image subtraction, flat-fielding and non-linearity correction before being converted from the recorded Data Numbers (DN) into Relative Exposure Units (REU), which are then used in all subsequent analyses.
2.2. Hinode/EIS
EIS has both imaging (40 and 266 slots) and spectroscopic (1 and 2 slits) capabilities, in the short wavelength (SW) range of 170210 Å and the long wavelength (LW) range of 250290 Å. EIS has a spectral resolution of about 55 mÅ and a spatial resolution of about 3–4 per pixel. Its spectroscopic mode can operate in a rastering mode (repeated exposures while scanning over the observation target) or a sit-and-stare mode (repeated exposures at the same spatial location). The Hinode spacecraft tracks the solar rotation.
The EIS observations were conducted on 2007 November 6 using EIS Study 209 EUNIS_EIS_Cross_Calibration. Two rastered images were obtained using 2512 slit at 60 or 61 positions with 50 s exposures. One began at 17:09:41 and ended at 18:00:43 UT prior to the EUNIS flight, and the other from 18:02:41 to 18:54:34 UT started during the EUNIS flight. The EIS sequence includes 5 spectral windows in SW covering nearly the full spectrum and 17 windows in LW covering selected spectral lines. The raw data were processed by the standard routine eis_prep provided by SolarSoftWare (SSW) to remove detector bias and dark current, hot pixels, and cosmic rays, and to make absolute radiometric calibration. The EIS slit tilt and orbital variation in the line centroids were also removed from the data. The pointing between EIS SW and LW detectors has offsets of 2 in the x-direction and about 18 in the y-direction (Young et al., 2007).
| Wavelength(Å) | Ion | Ie07 | I | I | I | Ie07/I | Ie07/I | Ie07/I |
|---|---|---|---|---|---|---|---|---|
| 303.78 | He ii | 4759 | 5244 | 4484 | 4290 | 0.91 0.13 | 1.06 0.15 | 1.11 0.16 |
| 313.76 | Mg viii | 25.2 | 31.7 | 25.9 | 14.1 | 0.79 0.11 | 0.97 0.14 | 1.79 0.25 |
| 314.31 | Si viii | 25.1 | 36.1 | 30.0 | 24.1 | 0.70 0.10 | 0.84 0.12 | 1.04 0.15 |
| 315.01 | Mg viii | 62.3 | 37.6 | 31.7 | 22.0 | 1.66 0.23 | 1.97 0.28 | 2.83 0.40 |
| 316.20 | Si viii | 39.2 | 44.7 | 38.7 | 26.6 | 0.88 0.12 | 1.01 0.14 | 1.47 0.21 |
| 319.81 | Si viii | 60.5 | 48.6 | 45.5 | 26.4 | 1.24 0.18 | 1.33 0.19 | 2.29 0.32 |
| 341.91 | Si ix | 15.0 | 17.0 | 15.4 | 13.9 | 0.88 0.12 | 0.97 0.14 | 1.08 0.15 |
| 345.04 | Si ix | 34.0 | 66.8 | 60.9 | 46.5 | 0.51 0.07 | 0.56 0.08 | 0.73 0.10 |
| 345.67 | Fe x | 20.6 | 14.7 | 13.4 | 15.7 | 1.40 0.20 | 1.54 0.22 | 1.31 0.19 |
| 347.34 | Si x | 24.0 | 27.6 | 25.6 | 22.2 | 0.87 0.12 | 0.94 0.13 | 1.08 0.15 |
| 352.58 | Fe xi | 30.3 | 19.9 | 20.0 | 20.4 | 1.52 0.22 | 1.51 0.21 | 1.49 0.21 |
| 368.11 | Mg ixbbThe listed line intensity for Mg ix 368.1 Å includes the emission from the blended line, Mg vii 367.7 Å. | 285.8 | 262.4 | 252.4 | 172.1 | 1.09 0.15 | 1.13 0.16 | 1.66 0.23 |
2.3. SOHO/CDS
The CDS includes a Normal Incidence Spectrometer (NIS) that can be used to obtain stigmatic EUV spectra within its 308381 Å (NIS 1) and 513633 Å (NIS 2) wavebands along its 240 long slit. Several slit widths are available, the most commonly used being 4. The instrument can be operated in a sit-and-stare mode or a rastering mode. In the latter case, the CDS scans a region of the Sun from the West to East without compensation for solar rotation, thus the actual FOV of a rastered spectroheliogram is stretched out in the x-direction when the targeted region is located on the solar disk. In this study, the CDS rastered image was observed from 17:00:28 to 19:01:00 UT, consisting of 60 pointing positions. The FOV is 260. The pointing difference between CDS NIS 1 and NIS 2 has been corrected when applying mk_cds_map in SSW IDL library.
2.4. Coalignments
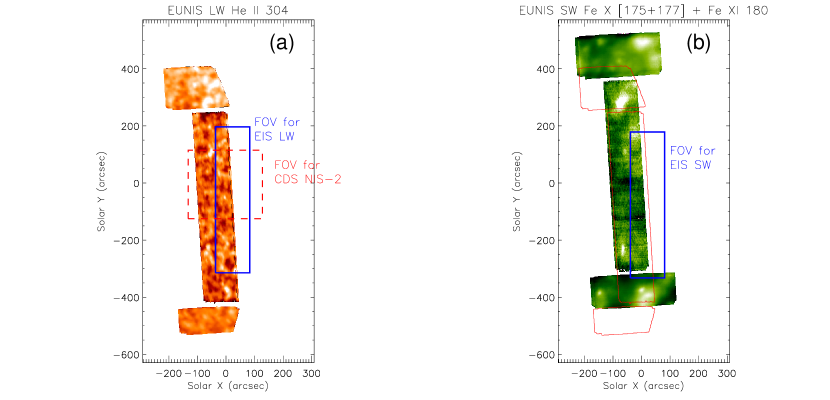
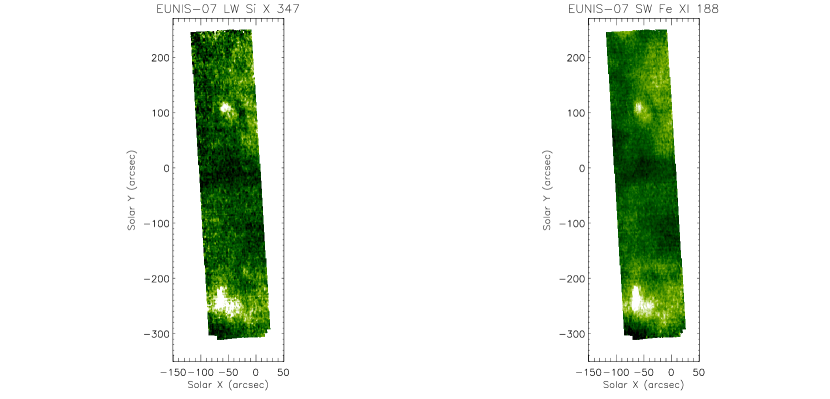
We first built up EUNIS rastered slit-lobe images in selected spectral lines for LW and SW channels using all exposure frames. Figure 1 shows the LW He ii 304 Å slit-lobe image and the SW composite image from three coronal lines, Fe x 174.5 Å, Fe x 177.2 Å and Fe xi 180.4 Å. We then determined the pointing, roll angle, and actual spatial scale of EUNIS slit images by coaligning them with EIT images in 304 Å and 195 Å passbands using the method as described in Wang et al. (2010). For the EUNIS LW images we obtained the actual pixel size of 0.926 pixel-1 and the roll angle of 3∘.47 counterclockwise from the North. For the SW images we obtained the actual pixel size of 0.920 pixel-1 and the roll angle of 3∘.64. The measurements show that the LW and SW channels have nearly the same pixel size and roll angle, and they were well co-pointed in the direction perpendicular to the slit with a small offset of 18.5 in solar x-direction and an offset of 108.5 in solar y-direction. Figure 1 shows the coaligned EUNIS-07 SW and LW slit-lobe images, indicating that their FOVs are mostly overlaid in the slit part. Figure 2 illustrates their cospatial rastered slit images in Si x 347 Å line of LW channel and Fe xi 188 Å line of SW channel.
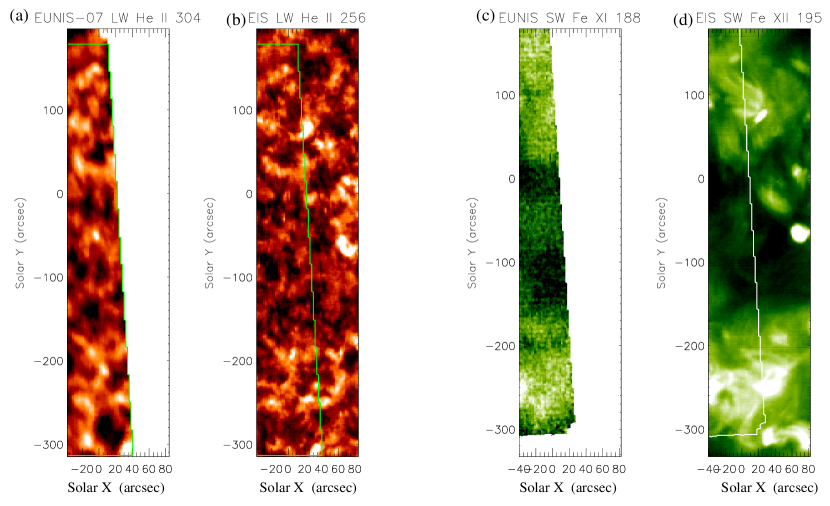
The pointing of EIS LW band was determined by coaligning the He ii 256 Å rastered image obtained during 18:02–18:54 UT with the average image of EIT 304 Å at 18:01 and 18:09 UT. The pointing of EIS SW band was determined by coaligning the Fe xii 195 Å raster image with the average image of EIT 195 Å at 17:55 and 18:22 UT, where the average was made after the two EIT images were rotated to a common time. The measured pointings for both bands are the same considering the existing offsets between them. Figure 3 illustrates the accurate coalignments between EUNIS-07 and EIS in both bands.
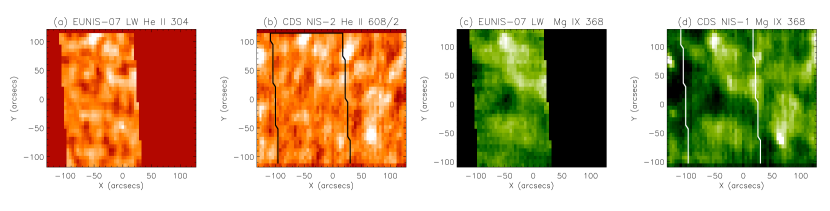
The pointing of CDS NIS was determined by coaligning the He ii 304 Å (second order) rastered image observed during 17:0019:00 UT with the EIT 304 Å image at 18:01 UT. Figure 4 illustrates a good coalignment between EUNIS and CDS NIS as seen in He ii 304 Å and Mg ix 368 Å rastered images. Comparisons between the FOVs of coaligned EUNIS, EIS, and CDS NIS are shown in Figure 1.


3. Absolute radiometric calibration of EUNIS-06 and EUNIS-07 LW channel
Radiometric calibration of the EUNIS-06 LW channel was carried out in August 2006 and that of the EUNIS-07 LW channel was in May 2008. They were performed at the RAL in the same facility and using the same EUV light source as was used for preflight calibrations of CDS (Lang et al., 2002). Recalibration of the German PTB light source against the primary EUV radiation standard of BESSY-II (English: Berlin Electron Storage Ring Society for Synchrotron Radiation) in March 2007 showed that it had remained stable within its 7% uncertainty.
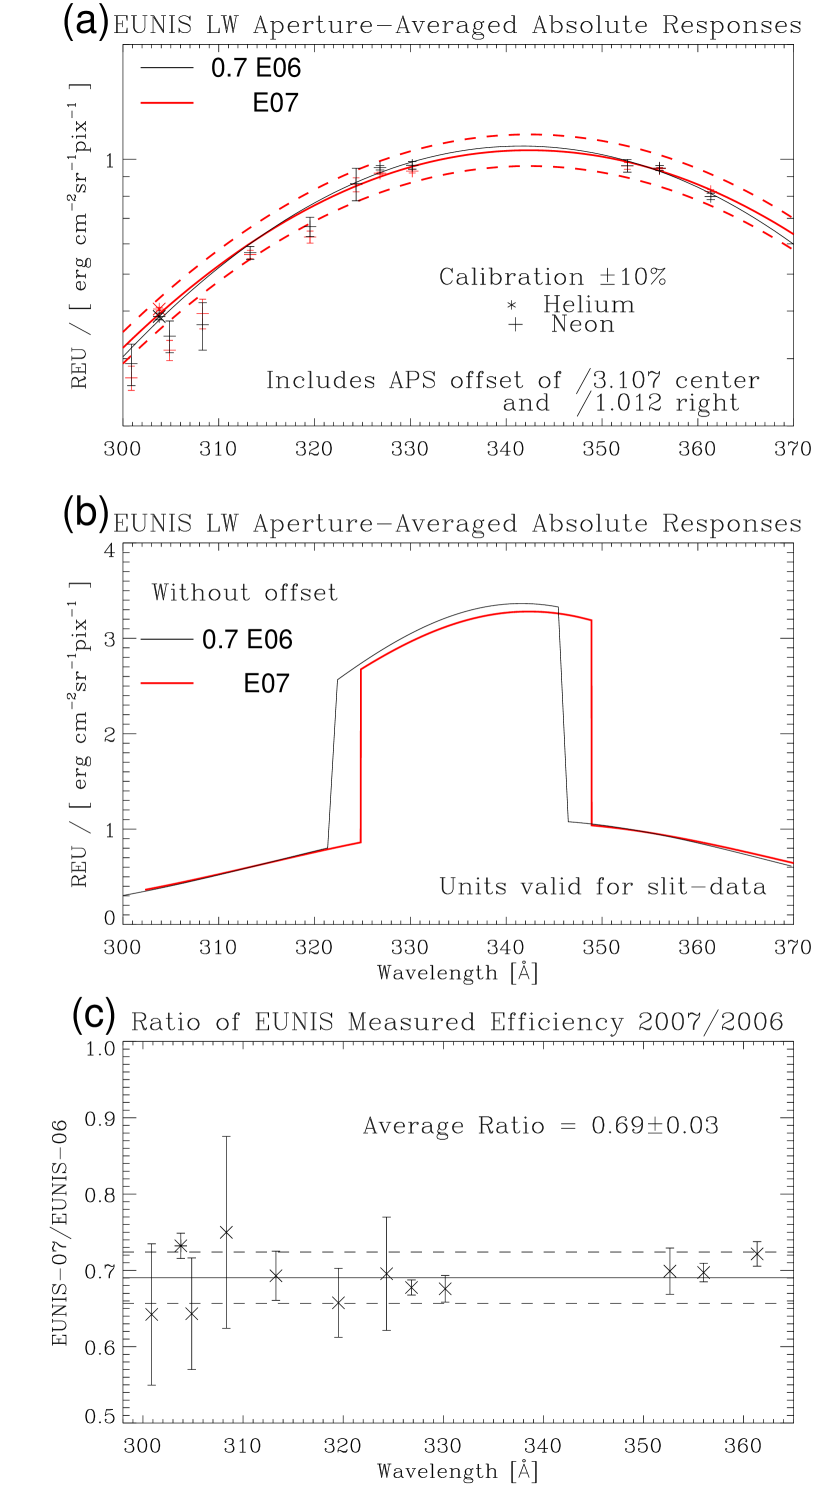
The end-to-end calibration of EUNIS-07 was made using the He ii 304 Å line at 88 individual locations, and using 11 distinct Ne features between 300 and 370 Å at 176 individual locations covering the instrument’s entrance aperture. The aperture-averaged response at each wavelength was combined with the known source flux and with geometric factors, such as aperture area and pixel size, resulting in the absolute EUNIS responsivity within a total uncertainty of 10% over its full LW bandpass. The spectral responsivity measures the recorded data numbers per photon flux in ergs cm-2s-1sr-1. The measured absolute responsivities of EUNIS-07 and EUNIS-06 as a function of wavelength are shown in Figure 5. The shape of the response curve is mainly due to the multilayer coating on the spectrograph grating which is applied to enhance its EUV efficiency. Error bars reflect the total range of values measured from the various entrance aperture positions. The fiber-optic coupling between the MCP and three active pixel sensors (APS) arrays in each optical channel leads to differences in the overall responsivity of each APS array relative to the other two. After correcting for these factors () which can be measured in laboratory, the response curve () in the range of 300–370 Å of three APS arrays was obtained by a least-square parabolic fit to the measurements using
| (1) | |||||
| (2) | |||||
| (6) |
where is the fitting function with =335 Å and is in units of REU (erg cm-2sr-1pixel-1)-1, where the pixel unit is referred to as ‘spectral pixel’ which is equal to 25 mÅ for first order spectrum. For EUNIS-07 we obtained the parameters, =(8.04.8)10-3, =(4.30.1)10-3, =(2.90.1)10-4, while for EUNIS-06 obtained =(1.80.1)10-1, =(4.20.4)10-3, =(3.20.2)10-4. The shape of the response curve for EUNIS-07 has little change compared to that of EUNIS-06 (Figures 5(a) and 5(b)), but its absolute responsivity has dropped by a factor of 1.450.06 (or decreased by 31%) (Figure 5(c)). There was a slight shift in wavelength covered by EUNIS-07 relative to EUNIS-06 due to a laboratory adjustment (see Fig. 5(b)). Validation of the laboratory calibration of the EUNIS-06 LW channel relevant to the shape of its response has been verified by checking its relative calibration using the density- and temperature-insensitive line ratio method (Wang et al., 2010). Therefore, no change in the shape of the response curve for EUNIS-07 supports the validation of its laboratory calibration. In other words, because the insensitive ratio method confirmed the EUNIS-06 calibration, and the shape of the EUNIS-07 response curve remained constant relative to EUNIS-06, there is no need to repeat the insensitive ratio test.
| Ion | Wavelength | Theo. RatioaaTheoretical line intensity ratios (relative to the LW line) calculated with CHIANTI package (ver.6). | Uncal. ISWbbUncalibrated SW line intensities in units of REU Å s-1. | IntensityccThe measured line intensity for LW and the derived line intensities for SW from the theoretical ratios in units of erg s-1cm-2sr-1. | Abs. RλddThe absolute responsivity for SW in units of 10-3 REU (erg cm-2sr-1Å-1)-1 (Column 4/Column 5). | Rel. RλeeThe relative responsivity with correction of APS relative sensitivity factors for the detectors, which has the same units as the absolute responsivity (see Eq. (7)). |
|---|---|---|---|---|---|---|
| (1) | (2) | (3) | (4) | (5) | (6) | (7) |
| Fe x | 345.74 | 1.00 0.00 | … | 22.90 2.29 | … | |
| 174.53 | 21.08 3.04 | 1.21 0.12 | 482.63 84.70 | 2.51 0.51 | 2.51 0.51 | |
| 177.24 | 11.59 1.54 | 0.81 0.08 | 265.35 44.13 | 3.05 0.59 | 3.05 0.59 | |
| 184.54 | 4.97 0.19 | 1.57 0.16 | 113.79 12.18 | 13.75 2.01 | 4.23 0.62 | |
| Fe xi | 352.66 | 1.00 0.00 | … | 31.33 3.13 | … | |
| 180.41 | 11.44 1.24 | 1.22 0.12 | 358.42 52.86 | 3.40 0.61 | 3.40 0.61 | |
| 188.23ffFor Fe xi 188.23, we have summed the intensities of the two Fe xi lines at 188.23 and 188.30 Å. | 7.87 0.24 | 3.29 0.33 | 246.57 25.78 | 13.33 1.93 | 4.10 0.59 | |
| Fe xii | 364.47 | 1.00 0.00 | … | 21.04 2.10 | … | |
| 192.39 | 1.94 0.06 | 0.40 0.04 | 40.83 4.27 | 9.80 1.42 | 3.01 0.44 | |
| 193.51 | 4.06 0.15 | 0.93 0.09 | 85.44 9.11 | 10.84 1.58 | 3.33 0.49 |
4. Calibration update of CDS NIS with EUNIS-07
The CDS NIS instrument was calibrated end-to-end at RAL, and various underflight calibrations were implemented later on, forming the version 4 of the NIS ‘standard’ calibration (implemented on May 21, 2002). The history of the NIS calibration was described in detail by Del Zanna et al. (2010). Del Zanna et al. (2001) used the line-ratio technique to obtain an independent set of responsivities which were consistent, to within a relative 30%, with the ‘standard’ values (see the 2002 book on the SOHO calibration). The MCP in NIS detector is known to have a drop in sensitivity over time due to exposure to solar radiation. This results in a depression at the core of the lines when one of the 2 or 4 slits is used (the so-called burn-in of the lines). This effect in the NIS spectra has been monitored since launch with the NIMCP study and is routinely corrected. The use of the wide 90 slit was thought to be the main cause of the responsivity loss over long time-scales (Thompson, 2006). An empirical correction was implemented within the standard software, and is still applied by default. However, Del Zanna et al. (2010) used the same NIMCP study to actually show that the burn-in due to the use of the 90 slit is a secondary effect, while the responsivity in both NIS channels has been steadily dropping. Del Zanna et al. (2010) provided a wavelength-dependent long-term correction for this drop over the period 1996-2010. The Del Zanna et al. (2010) long-term corrections, combined with the Del Zanna et al. (2001) responsivities provided good agreement between the irradiances of most CDS lines with those measured with the prototype of the Solar Dynamics Observatory (SDO) EVE instrument, flown on a rocket on April 14, 2008.
The EUNIS LW channel has a wavelength range overlapping with that of CDS/NIS 1, so can provide a direct calibration update for it. The lab-calibrated SERTS-97 was successfully used to improve the response curve for the CDS NIS 1 waveband based on their coordinated, cospatial spectra (Thomas, 2002). Based on observations of active region spectra, EUNIS-06 provided a new calibration update for CDS NIS (Wang et al., 2010), which showed an overall decrease in NIS 1 responsivity by a factor about 1.7 compared to that of the previously implemented calibration (version 4, 2002) with the NIS “standard” long-term corrections, while the responsivity in NIS 2 second order at 303304 Å with the NIS “standard” long-term corrections remained nearly constant (Fig. 8(a)). It needs to be pointed out that the measured CDS He II 304 intensity in Wang et al. (2010) was underestimated by a factor of 2 due to a bug found in the calibration routine, nis_calib, which was fixed as of 2011 May. In the following we present the CDS underflight calibration update with EUNIS-07 measurements.
Figure 4 shows the common FOVs between EUNIS-07 LW and CDS NIS as illustrated by the rastered images in He ii 304 Å and Mg ix 368 Å, indicating that a quiet region was observed. Figure 6 shows their cospatial average spectra, where 202 exposure frames were averaged for EUNIS-07. Note that the two regions around the 335 and 360 Å lines of CDS NIS 1 spectrum are suffering from depression due to wide-slit burn-in effects from the Fe xvi lines, where the long-term correction is more uncertain (Del Zanna et al., 2010). Both the calibrated EUNIS-07 LW and CDS NIS spectra (as well as the calibrated EUNIS-07 SW and EIS spectra shown in Figure 11 and Figure 13) exhibit a significant background particularly in the low-responsivity wavelength range. This mainly resulted from a combined effect of the instrumental noise and scattered light with the special shape of their response curves. For the EUNIS spectra, we first divided the full spectral window into several small sections, and then fitted spectral lines by a multiple Gaussian function with a linear background using the standard line fitting routine (xcfit.pro) in SSW. In this way the slowly, smoothly varying (with wavelength) “background” level only slightly affects the integrated intensities of the fitted line profiles. Measurements of the line intensities from EUNIS-07 SW and EIS SW/LW spectra in Sections 5 and 6 were made using the same technique. The CDS line intensities were obtained by fitting multiple broadened Gaussian functions to the full spectrum. The broadened Gaussian function is a combination of a Gaussian term plus a term describing the wings (Thompson, 1999). We chose the broadening with no asymmetry and kept the relative amplitude of the wings equal to a value of 0.8, but allowed the width of the Gaussian term for the line to vary (within 0.29 and 0.4 Å in FWHM), as well as its centroid and peak values. All lines were fitted at once, with the background fitted with a polynomial curve. Figure 7 shows the fitted CDS line profiles in two selected wavelength ranges. Even with its moderate spectral resolution, CDS can resolve the lines that we used for calibration. The uncertainty caused by the moderate spectral resolution of CDS is relatively small compared to that in the background when assuming the common background fit for all spectral lines.
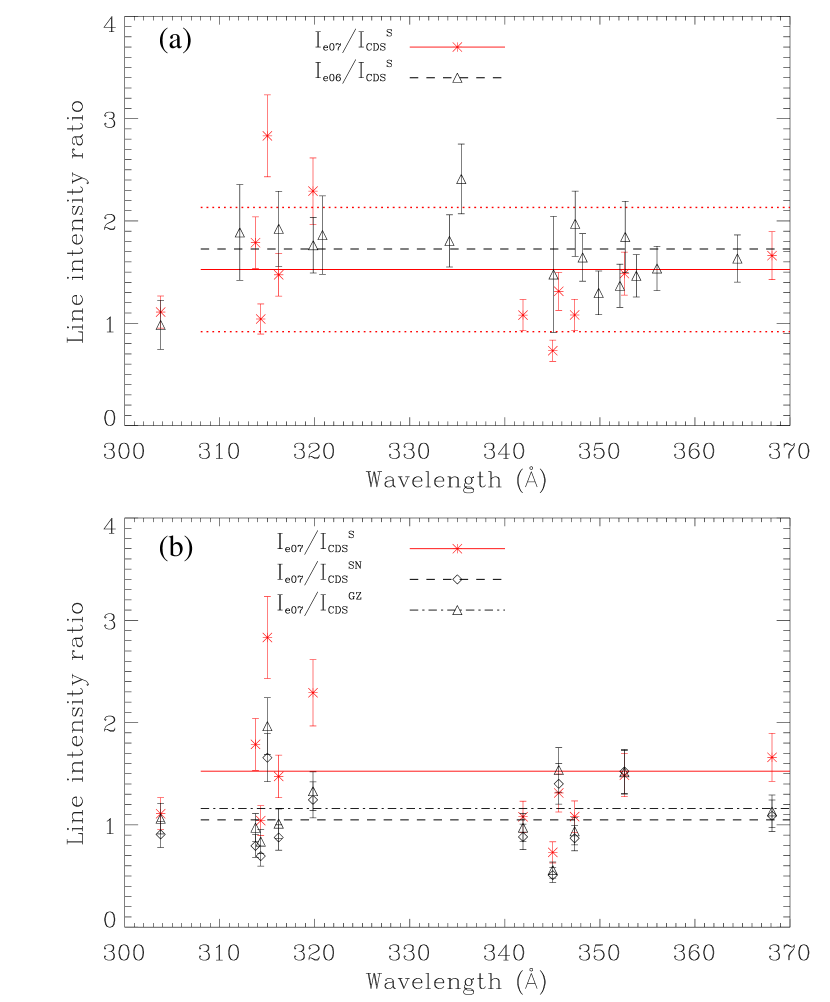
Table 1 lists 12 strong emission lines observed by both EUNIS LW and CDS (NIS 1 in first order and NIS 2 in second order). To examine the current CDS responsivities and long-term corrections, we measured the line intensities with three kinds of calibration as used in Del Zanna et al. (2010). The fourth column () shows the intensities obtained with the current standard CDS responsivities and the new long-term corrections derived by Del Zanna et al. (2010), which has been implemented with the keyword alt_slit6 in the SSW routine vds_calib. The fifth column () shows the intensities obtained with the Del Zanna et al. (2001) scaled responsivities (using nis_resp_gdz_2010 in SSW) and the new long-term corrections. Note that differences between the standard CDS responsivities and the Del Zanna et al. (2001) scaled ones are small, overall of the order of 10% or so. The sixth column () shows the intensities obtained with the current standard CDS responsivities (version 4, 2002) and the standard long-term corrections (using vds_calib with the keyword slit6 [default] ). Considering long-term corrections have the relative uncertainty of 20%, combined with the uncertainties in the background and the responsivities (20% to 30% see Del Zanna et al., 2001), it means a typical uncertainty of 30%–40% in measurements of CDS line intensities. Ratios of the EUNIS-07 to various CDS line intensities are listed in columns 79 and shown in Figure 8, where errors of the ratios were calculated by assuming 10% uncertainty (as a lower limit) in measurements of both EUNIS and CDS line intensities.


The differences are significant between the EUNIS-07 line intensities and the CDS ones applied with standard responsivities and standard long-term corrections, especially for those lines in the wavelength range of 310320 Å. The NIS 1 responsivity (with standard long-term corrections) overall decreased by a factor of 1.50.6, which is consistent with that derived by EUNIS-06. While the EUNIS-07 line intensities are well consistent with the CDS ones applied with new long-term corrections in many lines (with differences less than 15%). Their average ratio is 1.050.36 in the case of the standard responsivities and it is 1.160.39 in the case of the Del Zanna et al. (2001) scaled ones. Therefore, the results of EUNIS-06 and EUNIS-07 flights confirmed the new long-term corrections for NIS 1 response obtained by Del Zanna et al. (2010), and strongly suggest the application of keyword, alt_slit6, in using vds_calib or nis_calib to calibrate CDS data. In addition, our measurements show that the differences are small (on the order of 10%) between He ii 304 Å intensities obtained by EUNIS-07 in first order and by CDS NIS-2 in second order applied with the standard or new long-term corrections, indicating that the second-order standard (version 4) responsivity of NIS 2 updated by SERTS-97 (Thomas, 2002) and EGS (Woods et al., 1998) remains to work well (with a decrease in uncertainty) when the standard long-term corrections are applied. Finally, we notice that even after the new long-term corrections, the CDS intensities for some lines showed large (30%) difference from the EUNIS ones. This could be due to the uncertainties involved in difficulty of background (scattered light) estimate for the CDS spectrum.
| Ion | Wavelength | I (Uncal.E07)aaUncalibrated EUNIS-07 SW line intensities in units of REU Å s-1. | I (Cal.E07)bbCalibrated EUNIS-07 SW line intensities in units of erg s-1cm-2sr-1. | I (Uncal.EIS)ccUncalibrated EIS SW line intensities in units of DN spec_pix s-1. | I (Cal.EIS)ddCalibrated EIS SW line intensities in units of erg s-1cm-2sr-1. | IE07/IEISeeThe ratio of calibrated EUNIS-07 SW line intensities to the EIS SW line intensities. | EIS RλffThe derived responsivity for EIS SW in units of DN spec_pix (erg cm-2sr-1)-1 (Column 5/Column 4). |
|---|---|---|---|---|---|---|---|
| (1) | (2) | (3) | (4) | (5) | (6) | (7) | (8) |
| Fe x | 174.54 | 1.281 0.128 | 522.37 52.24 | 0.799 0.080 | 393.03 39.30 | 1.329 0.188 | 1.53e-03 2.16e-04 |
| Fe x | 177.24 | 0.799 0.080 | 261.56 26.16 | 1.313 0.131 | 212.94 21.29 | 1.228 0.174 | 5.02e-03 7.10e-04 |
| Fe xi | 180.39 | 1.261 0.126 | 344.89 34.49 | 5.530 0.553 | 257.12 25.71 | 1.341 0.190 | 1.60e-02 2.27e-03 |
| Fe x | 184.54 | 1.617 0.162 | 122.16 12.22 | 8.524 0.852 | 102.33 10.23 | 1.194 0.169 | 6.98e-02 9.87e-03 |
| Fe viii | 185.22 | 0.484 0.048 | 36.46 3.65 | 3.035 0.303 | 30.48 3.05 | 1.196 0.169 | 8.32e-02 1.18e-02 |
| Fe viii | 186.60 | 0.335 0.034 | 25.35 2.54 | 3.229 0.323 | 23.41 2.34 | 1.083 0.153 | 1.27e-01 1.80e-02 |
| Fe xii | 186.88 | 0.318 0.032 | 24.13 2.41 | 3.204 0.320 | 21.93 2.19 | 1.100 0.156 | 1.33e-01 1.88e-02 |
| Fe xi | 188.23ggFor Fe xi 188.23, we have summed the intensities of the two Fe xi lines at 188.23 and 188.30 Å. | 3.515 0.351 | 272.88 27.29 | 39.602 3.960 | 209.95 21.00 | 1.300 0.184 | 1.45e-01 2.05e-02 |
| Fe x | 190.04 | 0.676 0.068 | 55.53 5.55 | 12.383 1.238 | 49.60 4.96 | 1.120 0.158 | 2.23e-01 3.15e-02 |
| Fe xii | 192.40 | 0.444 0.044 | 40.93 4.09 | 10.596 1.060 | 32.49 3.25 | 1.260 0.178 | 2.59e-01 3.66e-02 |
| Fe xii | 193.51 | 0.959 0.096 | 94.80 9.48 | 26.673 2.667 | 74.79 7.48 | 1.268 0.179 | 2.81e-01 3.98e-02 |
5. Absolute radiometric calibration of EUNIS-07 SW channel
The insensitive line ratio method was proposed by Neupert & Kastner (1983) as a means of monitoring relative calibration variations of inflight EUV spectrometers and was used by Thomas & Neupert (1994) and Brosius et al. (1996) to adjust the laboratory calibration curve for SERTS-89, SERTS-91 and SERTS-93. Brosius, Davila, & Thomas (1998a, b) derived the SERTS-95 relative radiometric calibration for both the first-order and second-order wave bands with this technique. In the following we used the lab-calibrated EUNIS-07 LW channel to calibrate its SW channel by means of density- and temperature-insensitive line intensity ratios because the responsivity of its SW channel could not be directly measured at RAL.
Figure 2 shows the common FOV between LW and SW channels of EUNIS-07 as illustrated by the rastered images in coronal lines, Si x 347.4 Å from LW and Fe xi 188 (188.2188.3) Å from SW. Figure 9 shows the spectra averaged over the same spatial area for 202 exposure frames observed from 18:02:14 to 18:06:34 UT. Line intensities of the EUNIS LW spectrum were measured with the Gaussian fit, while those of the SW spectrum with the broadened Gaussian fit. Table 2 lists three groups of emission lines for Fe x, Fe xi, and Fe xii. Column (3) gives theoretical line intensities relative to the one in the wavelength range for LW, which were calculated with the CHIANTI ver. 6 package (Dere et al., 1997, 2009). The line ratios exhibit slight variations with electron density (), so the mean value over a range of was taken, with the uncertainty corresponding to half of the difference between the maximum and minimum values. In each case, the intensity ratios were calculated at the temperature of maximum ion abundance (i.e., the lines’ formation temperature), using the ionization equilibrium data (chianti.ioneq). Column (4) gives the uncalibrated line intensity of SW spectral lines. In Column (5) the absolute intensity for LW lines was directly measured from the average spectrum, while the absolute intensity of SW lines was derived from the measured LW line intensity and CHIANTI theoretical insensitive line ratio. Column (6) gives the absolute responsivities, which are the ratio of the measured uncalibrated intensity (Column (4)) to the derived calibrated intensity (Column (5)) for SW lines. Column (7) gives the relative responsivities which were derived from the absolute ones by correcting for the relative sensitivity factors (). Figure 10(a) shows the relative responsivities and a least-squares parabolic fit on a logarithmic scale. The radiometric calibration response curve () in the range of 170205 Å is shown in Figure 10(b), obtained by Equations (1) and (2), where is the fitting function with =187.5 Å, =2.400.04, =(7.45.9)10-3, =(1.80.8)10-3, and the relative sensitivity factors for the three APS arrays were determined in laboratory as
| (7) |
The has units of REU (erg cm-2sr-1Å-1)-1. The shape of the SW response curve of EUNIS-07 is consistent with that of EUNIS-06 within the 15% uncertainty, but its responsivity has decreased by a factor of 2. Note that because the responsivity had fallen significantly and the observed region was very quiet, no emission lines were observed by the right ASP detector in SW channel which covers the wavelength range from 196 to 207 Å, including three Fe xiii (200.0, 203.7, 202.0 Å) lines that had been used for EUNIS-06 SW radiometric calibration. Therefore, the responsivities in the wavelength range between 194 and 205 Å are not directly constrained by observations.
| Ion | Wavelength | Theo. RatioaaTheoretical line intensity ratios (relative to the EUNIS-07 LW line) calculated with CHIANTI package (ver.6). | IE07bbFor wavelengths between 330 and 370 Å, the absolute intensity (in erg s-1cm-2sr-1) was measured from the calibrated EUNIS-07 LW spectrum, while for wavelengths between 170 and 280 Å, the absolute intensity was derived from the EUNIS-07 LW line intensity and CHIANTI ver.6. | IEISccThe measured absolute intensities (in erg s-1cm-2sr-1) for EIS SW and LW insensitive lines. | IE07/IEISddThe EUNIS-07 to EIS line intensity ratios. |
|---|---|---|---|---|---|
| (1) | (2) | (3) | (4) | (5) | (6) |
| Fe x | 345.74 | 1.000.00 | 23.352.34 | … | … |
| 174.53 | 21.07 3.04 | 491.98 86.37 | 389.96 39.00 | 1.26 0.25 | |
| 177.24 | 11.58 1.54 | 270.39 44.99 | 209.59 20.96 | 1.29 0.25 | |
| 184.54 | 4.97 0.19 | 116.05 12.42 | 101.55 10.16 | 1.14 0.17 | |
| Fe xi | 352.66 | 1.000.00 | 35.253.77 | … | … |
| 188.23eeFor Fe xi 188.23, the intensities of two self-blended lines at 188.23 and 188.30 Å were summed. | 7.87 0.24 | 277.42 30.85 | 212.92 21.29 | 1.30 0.19 | |
| 192.83ffFor Fe xi 192.83 Å, the blending from a weak line O v 192.8 Å could lead to the derived EUNIS-to-EIS intensity ratio underestimated by about 7%. | 1.20 0.06 | 42.30 4.99 | 34.99 3.50 | 1.21 0.19 | |
| Fe xi | 341.11 | 1.000.00 | 10.731.08 | … | … |
| 188.23eeFor Fe xi 188.23, the intensities of two self-blended lines at 188.23 and 188.30 Å were summed. | 28.33 4.67 | 303.98 58.64 | 212.92 21.29 | 1.43 0.31 | |
| 192.83ffFor Fe xi 192.83 Å, the blending from a weak line O v 192.8 Å could lead to the derived EUNIS-to-EIS intensity ratio underestimated by about 7%. | 4.31 0.77 | 46.25 9.47 | 34.99 3.50 | 1.32 0.30 | |
| Fe xii | 352.11 | 1.000.00 | 13.103.37 | … | … |
| 192.39 | 3.22 0.14 | 42.17 11.01 | 32.86 3.29 | 1.28 0.36 | |
| 193.51 | 6.75 0.34 | 88.39 23.18 | 76.74 7.67 | 1.15 0.32 | |
| 195.12 | 10.63 0.19 | 139.20 35.91 | 117.14 11.71 | 1.19 0.33 | |
| Fe xii | 364.47 | 1.000.00 | 21.072.69 | … | … |
| 192.39 | 1.94 0.06 | 40.88 5.37 | 32.86 3.29 | 1.24 0.21 | |
| 193.51 | 4.06 0.15 | 85.54 11.37 | 76.74 7.67 | 1.11 0.19 | |
| 195.12 | 6.39 0.21 | 134.64 17.75 | 117.14 11.71 | 1.15 0.19 | |
| Fe xii | 338.26 | 1.000.00 | 3.280.33 | … | … |
| 186.85ggFor Fe xii 186.85 Å, the intensities of two self-blended lines at 186.85 and 186.89 Å were summed. | 9.32 1.94 | 30.527.06 | 24.08 2.41 | 1.27 0.32 | |
| Si x | 347.41 | 1.000.00 | 30.903.09 | … | … |
| 261.04 | 0.79 0.12 | 24.414.44 | 19.31 1.93 | 1.26 0.26 | |
| 277.28 | 0.48 0.07 | 14.83 2.6 | 11.63 1.16 | 1.28 0.26 | |
| 272.01 | 0.59 0.09 | 18.23 3.32 | 17.03 1.70 | 1.07 0.22 |


6. Calibration update of EIS with EUNIS-07
We determined the EIS radiometric calibration using two methods. One is based on direct transfer of the radiometric calibration for EUNIS-07 SW channel, whose wavelength range overlaps that of the EIS SW band. The other is based on the temperature- and density-insensitive line ratio technique, in which one member of each insensitive line pair was observed by EUNIS-07 LW channel, and the other by EIS LW or SW band. In the following we applied the first method to the EIS raster observed after the EUNIS-07 flight, and applied the second method to the EIS rasters observed both before and after the EUNIS-07 flight.
6.1. Method 1: Calibration transfer from EUNIS-07 SW to EIS SW
Figure 11 shows the cospatial average spectra of EUNIS-07 SW and EIS SW bands over a common FOV shown in Figures 3(c) and 3(d). The EUNIS SW spectrum was calibrated with the response curve determined in Section 5. The EIS spectrum was calibrated using the standard routine, eis_prep in SSW, which used the pre-launch radiometric calibration based on laboratory measurements (Seely et al., 2004; Lang et al., 2006; Culhane et al., 2007; Brown et al., 2008). The EIS average spectrum was fitted using an interactive multi-Gaussian (with a linear background) fitting routine, spec_gauss_eis in SSW. Table 3 lists the measured calibrated and uncalibrated line intensities for 11 strong emission lines of Fe viii, Fe x, Fe xi, and Fe xii. A 10% uncertainty was assumed for the measured EUNIS and EIS line intensities because the statistical errors in the fitting were negligible, while the uncertainties due to absolute radiometric calibration may be up to 20%. Column (7) gives the EUNIS-to-EIS line intensity ratios (see Figure 12(a)). Column (8) gives the derived EIS responsivities which are ratios of the uncalibrated EIS to calibrated EUNIS line intensities (see Figure 12(b)). Our measurements indicate that the EIS responsivity decreased by a factor of 1.220.09 after a year inflight. The shape of the derived EIS response curve is well consistent with the one measured before its launch. The EIS response curve (in units of DN (erg cm-2sr-1pixel-1)-1) derived with a least-squares parabolic fit on a logarithmic scale in the wavelength range of 174194 Å is
| (8) |
where =185 Å, =1.100.03, =0.1110.003, =(5.20.6)10-3. Note that the EIS responsivity (R) derived above is for 2 slit, while in the case of 1 slit it should be reduced by a factor of 2.
6.2. Method 2: EIS calibration by EUNIS-07 LW using insensitive line ratios
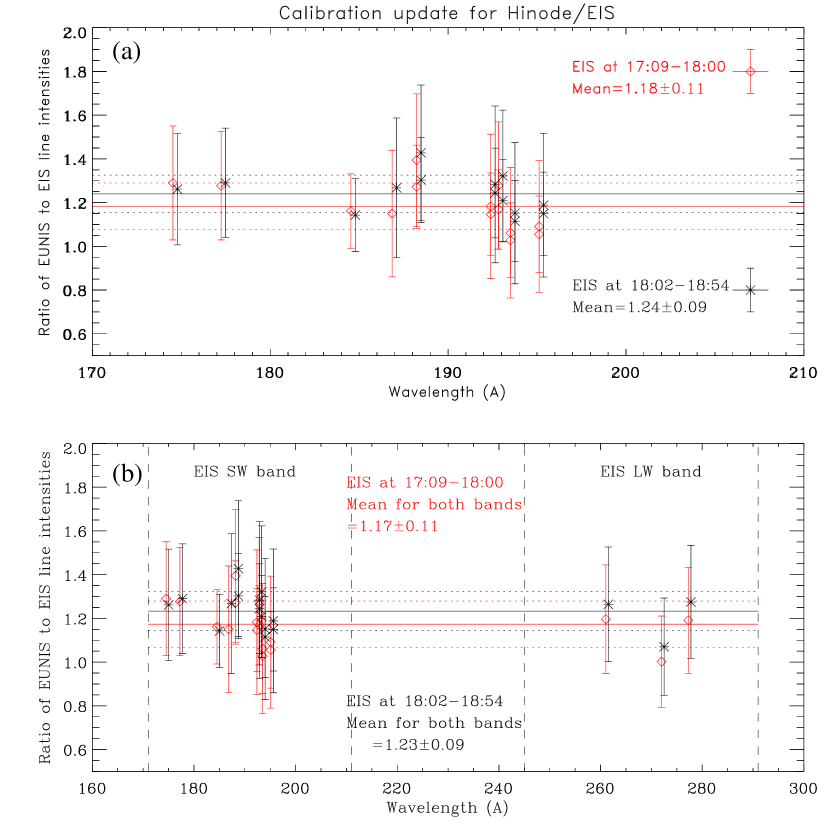
Figure 13 shows the absolutely calibrated spectra for EUNIS-07 LW and EIS LW and SW bands, averaged over a common FOV shown in Figures 3(a) and 3(b). Table 4 lists seven groups of temperature- and density-insensitive lines from Fe x, Fe xi, Fe xii, and Si x. Since the two Fe xi LW lines, 352.66 and 341.11 Å, and the two Fe xii LW lines, 352.11 and 364.47 Å, are insensitive line pairs, they were separated forming two groups which include the same SW line members. Column (3) gives theoretical line intensities normalized to the first member (EUNIS LW line) in each group. In Column (4) the absolute intensity of the EUNIS LW line was directly measured from the average spectrum, while those of the SW lines were derived using the theoretical ratios. Column (5) gives the absolute intensity of EIS SW lines measured from the average spectrum. Column (6) are ratios of the EUNIS-derived line intensity to the EIS directly measured one, which are shown in Figure 14. Our measurements from the EIS data set obtained from 18:02 to 18:54 UT indicate that the EIS responsivities in both bands decreased by a factor of 1.230.09 compared to the pre-launch ones measured in laboratory, which are in good agreement with the result obtained using method 1.
In the case using the EIS data set observed from 17:09 to 18:00 UT prior to the EUNIS-07 flight, the obtained line ratios (red symbols shown in Figure 14) indicate that the EIS responsivities decreased by a factor of 1.170.11, about 5% smaller than that obtained in the former case. This small difference may be caused by some cooling bright points observed at the southern end of the FOV. By averaging the results from two EIS data sets, we derived that the responsivities of two EIS bands degraded by a factor of 1.2 (or by 17%) after one year flight although the size of the measurement uncertainties is comparable to this decrease.

7. Discussion and Conclusions
Using coordinated, cospatial spectroscopic observations of a quiet region of the Sun, the lab-calibrated EUNIS-07 LW channel has been directly applied to update the CDS NIS calibration. We have found that the measured CDS NIS 1 line intensities calibrated with the standard (version 4) responsivities with the standard long-term corrections are overall underestimated by a factor of 1.50.6 due to the improper treatment of the decrease in responsivity, while the EUNIS-07 measurements are in very good agreement with the new long-term corrections for NIS 1 derived by Del Zanna et al. (2010). The difference is small (by about 10%) between the He ii 304 intensities measured by EUNIS-07 in first order and by CDS NIS 2 in second order with the standard or new long-term corrections. Therefore the EUNIS-07 and EUNIS-06 have provided the consistent calibration updates for CDS NIS 1 in the wavelength range of 301–370 Å and NIS 2 in second order at 303–304 Å and confirmed the inflight calibration update by Del Zanna et al. (2010). It is worth pointing out both the standard and the new long-term corrections for CDS/NIS include a wavelength-dependent decrease in responsivity. A major difference lies in that the standard correction assumed that the brightest lines would be most affected, so applies a correction which is too large for the strongest lines, while too small for the weaker lines. The new long-term corrections indicate an overall decrease in the NIS responsivity at all wavelengths.
The lab-calibrated EUNIS-07 LW channel is also applied to derive the EUNIS-07 SW channel calibration using a technique based on density- and temperature-insensitive line intensity ratios. The EIS calibration update is performed in two ways. One is using the direct calibration transfer of the calibrated EUNIS-07 SW channel. The other is using the insensitive line pairs, in which one member was observed by EUNIS-07 LW channel and the other by EIS in either LW or SW waveband. The response curve of EIS SW waveband is derived using the first method, which well coincides in shape with the lab-calibrated one prior to launch. Results obtained from the two methods are in good agreement, and confirm (within the measurement uncertainties) the EIS responsivity measured directly before the instrument’s launch. The measurements also suggest that the responsivity of both EIS wavebands decreased by a factor of 1.2 (or dropped to 83% of their prelaunch value) after a year flight (2007 November 6). The overall uncertainty due to the slightly temperature- and density-sensitivity of theoretical line ratios is less than 10%.
Responsivity loss of EUV spectrometers is often measured by monitoring the intensities of solar spectral lines from the basal chromospheric-transition region of quiet Sun, which are known on average not to vary over the cycle (e.g. Del Zanna et al., 2010). A recent EIS Science Nugget by Doschek (2011) reported an e-folding time of 6.4 years for the EIS instrument’s responsivity by measuring the intensity variation of the He ii line at 256.32 Å using the synoptic data between January 2007 and July 2009. By including quiet Sun data near disk center early in the mission before the synoptics started and the synoptic data in 2010, Mariska (2011, private communication) updated the measurement of e-fold time to be 5.2 years, which gives a decrease of responsivity by a factor of 1.2 for the first year’s flight, very well consistent with that derived in the present work. However, a preliminary investigation of the EIS radiometric calibration based on CHIANTI Beta v.7 showed that the updated atomic data would reduce the EUNIS-to-EIS line ratios by 10% for Fe xi and Si x, and thus the degradation of EIS responsivity by a factor of about 1.2 derived here may still be within the uncertainties of the EIS prelaunch calibration. In addition, based on the SUMER/EIS joint campaigns in 2007 March–April, Muglach et al. (2010); Landi & Young (2010) made the SUMER–EIS relative intensity calibration and found that the two instruments agreed with each other within uncertainties.
| Instrument | Obs. Date | Source | IntensityaaThose values for Full Sun (in lines 3-6) are converted from the irradiance in bracket which has units of 108 photons s-1 cm-2. | Reference |
|---|---|---|---|---|
| EUNIS-07bbAverage intensity for the common FOV between LW and SW channels. | 2007-Nov-06 | Quiet Region | 4960496 | This paper |
| EUNIS-06ccAverage intensity for a very quiet area near an active region with the absence of Fe xiv line emission. | 2006-Apr-12 | Quiet Region | 4108411 | This paper |
| SDO/EVE | 2010 May-Dec | Full Sun | 5670190 (592) bl | This paper |
| Prototype-EVE rocket | 2008-Apr-14 | Full Sun | 5766 (60) bl | Del Zanna & Andretta (2011) |
| CDS NIS | 2006-2008 | Full Sun | 5382288 (563) | Del Zanna & Andretta (2011) |
| CDS NISddRecalibration of SOHO/CDS NIS with the EUV Grating Spectrograph (EGS) on the NASA/LASP rocket. | 1997-May-15 | Full Sun | 65201304 (6814) | Brekke et al. (2000) |
| CDS NISeeThe values in Warren (2005); Brooks & Warren (2006) are doubled to correct the calibration (Warren & Brooks 2011, private communication). | 1998-May-1 | Quiet Region | 6856132 | Brooks & Warren (2006) |
| CDS NISeeThe values in Warren (2005); Brooks & Warren (2006) are doubled to correct the calibration (Warren & Brooks 2011, private communication). | 1996 Mar-Jun | Quiet Region | 72048 | Warren (2005) |
| CDS NISffAverage of two measurements for observations at 18:40 and 19:49 UT. | 1997-Nov-18 | AR’s Quiet Surroundings | 8520144 | This paper |
| SERTS-97ggAverage intensity for a quiet area near an active region observed at SERTS pointing position 2 (Swartz et al., 1999). | 1997-Nov-18 | AR’s Quiet Surroundings | 8270929 | Brosius et al. (2000b) |
| SERTS-97hhAverage intensity for the quiet regions observed at SERTS pointing position 1 (Swartz et al., 1999). | 1997-Nov-18 | Quiet Region | 7400 (4500–12000) | This paper |
| SERTS-95iiCalibrations were made based on the ‘standard’ quiet Sun intensity given by Mango et al. (1978). | 1995-May-15 | Quiet Region | 9510 1070 | Brosius, Davila, & Thomas (1998b) |
| SERTS-93iiCalibrations were made based on the ‘standard’ quiet Sun intensity given by Mango et al. (1978). | 1993-Aug-17 | Quiet Region | 6940778 | Brosius et al. (1996) |
| SERTS-91iiCalibrations were made based on the ‘standard’ quiet Sun intensity given by Mango et al. (1978). | 1991-May-7 | Quiet Region | 7760869 | Brosius et al. (1996) |
| Skylab | 1973-Aug | Quiet (cell and network) | 8406 (752710998) bl | Vernazza & Reeves (1978) |
| Skylab | 1973-1974 | Quiet (Center-to-limb) | 71159321 bl | Mango et al. (1978) |
| Average for OSO-3,4,6, | 19671974 | Full disk | 84131085 bl | Mango et al. (1978) |
| Skylab and rocketsjjAverage of 9 measurements taken from Table 2 of Mango et al. (1978). | in 7280-11050 bl |
The quiet Sun emission of the He ii 304 Å line has been known for a long time to remain fairly constant. Early observations from Rocket, Skylab and OSO in 1960-70s give typical intensities of 70009000 erg s-1cm-2sr-1 for the He ii + Si xi blend (see Table 5 and Del Zanna & Andretta (2011) who summarized almost all historical records). The center-to-limb curve for quiet Sun He ii + Si xi intensity of such values reported by Mango et al. (1978) was used as a natural “standard” light source for absolute radiometric calibrations of SERTS-89, SERTS-91, SERTS-93 and SERTS-95 (Thomas & Neupert, 1994; Brosius et al., 1996; Brosius, Davila, & Thomas, 1998b). SERTS-97 was directly calibrated at RAL in the same facility used to characterize the CDS and EUNIS instruments, and provided the calibration update for CDS NIS-1 first-order and NIS-2 second-order lines. SERTS-97 pointed at two locations during its observation (Swartz et al., 1999). The slit position in pointing 1 was in the quiet region with average He ii intensity of 7400 erg s-1cm-2sr-1, while it covered the “quiet surroundings” of an AR in pointing 2 with average He ii intensity 8270 erg s-1cm-2sr-1 (Brosius et al., 2000b). The quiet-Sun He ii radiance measured by SERTS-97 is consistent with the value measured near the disk center by Mango et al. (1978) from Skylab, and is also well consistent with those measured by CDS NIS 2 during 1996–1998 (e.g. Brekke et al., 2000; Warren, 2005; Brooks & Warren, 2006).
However, we find that the quiet Sun He ii radiances measured by EUNIS-07 on the order of 5000 erg s-1cm-2sr-1, which is about a factor of 1.4 smaller than that measured by SERTS-97 and about a factor of 1.6 smaller than the old measurements in 1960–70s (see Table 5). Note that the old measurements include the blending emission from Si xi line, but the blending typically contributes less than 10% of the total intensity of these two lines in the quiet Sun, so cannot explain the big difference from the EUNIS-07 measurement. Based on the long-term monitoring of CDS NIS irradiances from 1998 to 2010, Del Zanna & Andretta (2011) suggested that the Skylab values of the He ii 304 Å line in the quiet Sun were overestimated, and so did for those by SERTS-89, SERTS-91, SERTS-93 and SERTS-95 whose absolute radiometric calibration was based on the Skylab measurements. Whereas the large difference between the SERTS-97 and EUNIS-07 measurements which were both based on the direct lab-calibration suggests that the large dispersion of measurements from different instruments may be partially ascribed to true variations depending on observed locations if the average is limited in a small FOV, and on observing times (e.g. different phases of a solar cycle, or different solar cycles). For example, the intensity of the He ii 304 Å line in “quiet surroundings” of an active region may be significant larger than that in the very quiet region. EUNIS-06 showed that the “quiet surroundings” have the values of 60008000 erg s-1cm-2sr-1, while the very quiet region considered where Fe xiv emission is nearly absent has the value of about 4100 erg s-1cm-2sr-1. The SERTS-97 observation at pointing 1 showed variations of He ii intensities in “quiet region” from 4500 to 12000 erg s-1cm-2sr-1 over the 353-long slit. Del Zanna & Andretta (2011) showed that the He ii irradiance measured during this solar minimum (2006–2008) is about a factor of 1.3 smaller than that measured in 1998 at the beginning of the last solar cycle. The dispersion of He ii intensities shown in Table 5 suggests that one should be cautious about using the quiet-Sun He ii line as a standard light source.
In addition, we may verify the EUNIS-07 radiometric calibration by comparing the measured quiet-Sun He ii 304 Å intensity with the radiance converted from irradiance measurements (the full-disk flux measured at Earth from this line or a narrow waveband centered at 304 Å) during the solar minimum. Since the He ii lines have negligible limb-brightening and off-limb contribution (Del Zanna & Andretta, 2011), the conversion for the quiet Sun can be simply made by the relation (Warren et al., 1998)
| (9) |
where is the irradiance, is the solar radius, is the Earth-Sun distance, and is the intensity at disk-center. When the irradiance uses the unit of photons s-1 cm-2 and the intensity is in erg s-1cm-2sr-1, the conversion coefficient between and at 304 Å is 1.04106 sr photons erg-1. From the quiet-Sun intensity of 4960 erg s-1cm-2sr-1 by EUNIS-07, it derives irradiance to be photons s-1 cm-2, which is well consistent with recent measurements ((56) photons s-1 cm-2) by CDS NIS-2 during the solar minimum from 2006 to 2008 (Del Zanna & Andretta, 2011), and those (about 60 photons s-1 cm-2 including the blended Si xi line) by prototype-EVE rocket in April 2008 (Del Zanna & Andretta, 2011) and by SDO/EVE over May-December 2010 (see Table 5). These comparisons verify the good radiometric calibration for EUNIS-07.
Finally, we may check the absolute intensity of the quiet-Sun He ii 304Å line from EUNIS-07 using the theoretical line ratio and coordinated, cospatial EIS measurements. The CHIANTI (ver.6.0) shows that the He ii 256 Å/304 Å ratio in optically thin condition is somewhat density sensitive, with a minimum value of 0.036 at log = 8.0, and a maximum value of 0.117 at log = 11.0, but a most likely value of 0.0510.011 for 9.0log10.0. In comparison, Jordan (1975) gave the observed ratio of this line pair to be 0.052, and Brosius, Davila, & Thomas (1998b) measured the ratio of He ii+Si x 256Å to He ii 304Å to be 0.0460.008 for an active region. These measurements agree with the predicted value within uncertainties. Taking the theoretical ratio from CHIANTI and the measured EIS intensity of the He ii 256 Å line (with calibration correction by EUNIS-07, ie. scaled by a factor of 1.2), we derived the intensity of He ii 304Å to be 48101040 for the EIS 17:0918:00 UT raster and 46301000 for the EIS 18:0218:54 UT raster. Despite the He ii lines being possibly optically thick, the quiet-Sun He ii 304 Å intensity derived from EIS is well consistent with that directly measured by EUNIS-07, confirming an agreement between the EUNIS-07 and EIS cross-calibration.
In the next flight (expected in 2011 November) EUNIS will focus on the study of thermal structure of coronal loops and coordinated observations with SDO/AIA. Based on SDO images, two slit locations and rotational alignments will be chosen before flight to sample both active regions and quieter areas. EUNIS-11 will continue to provide the EIS cross-calibration as done with EUNIS-07 using the insensitive line ratio technique. Active region spectra will allow applications of more line pairs such as from Fe xiiiFe xvi to provide a good coverage for the EIS LW band.
In conclusion, EUNIS-07 has provided important underflight calibration updates for CDS/NIS and Hinode/EIS. The results by EUNIS-07 well support the recent measurements of the long-term correction for the CDS and EIS instrument responsivities obtained by the inflight monitoring of the quiet-Sun intensity of the chromospheric-transition region lines. The absolute value of the quiet-Sun He ii 304 Å intensity measured by EUNIS-07 is well consistent with the radiance measured by CDS NIS in quiet regions near the disk center and the solar minimum irradiance obtained by CDS NIS and SDO/EVE recently, but it is about a factor of 1.4–1.6 smaller than the previous values from SERTS-97 and Skylab, reflecting possible real variations with locations and times.
References
- Brekke et al. (2000) Brekke, P., Thompson, W. T., Woods, T. N., Eparvier, F. G. 2000, ApJ, 536, 959
- Brooks & Warren (2006) Brooks, D. H., & Warren, H. P. 2006, ApJS, 164, 202
- Brosius et al. (1993) Brosius, J. W., Davila, J. M., Thompson, W. T., Thomas, R. J., et al. 1993, ApJ, 411, 410
- Brosius, Davila, & Thomas (1998a) Brosius, J. W., Davila, J. M., & Thomas, R. J. 1998a, ApJ, 497, L113
- Brosius, Davila, & Thomas (1998b) Brosius, J. W., Davila, J. M., & Thomas, R. J. 1998b, ApJS, 119, 255
- Brosius et al. (1996) Brosius, J. W., Davila, J. M., Thomas, R. J., & Monsignori-Fossi, B. C. 1996, ApJS, 106, 143
- Brosius et al. (1997a) Brosius, J. W., Davila, J. M., Thomas, R. J., Saba, J. L. R., Hara, H., & Monsignori-Fossi, B. C. 1997a, ApJ, 477, 969
- Brosius et al. (1997b) Brosius, J. W., Davila, J. M., Thomas, R. J., & White, S. M. 1997b, ApJ, 488, 488
- Brosius, Rabin, & Thomas (2007) Brosius, J. W., Rabin, D. M., & Thomas, R. J. 2007, ApJ, 656, L41
- Brosius, Rabin, & Thomas (2008) Brosius, J. W., Rabin, D. M., & Thomas, R. J. 2008, ApJ, 682, 630
- Brosius et al. (2008) Brosius, J. W., Rabin, D. M., Thomas, R. J., & Landi, E. 2008, ApJ, 677, 781
- Brosius et al. (1999) Brosius, J. W., Thomas, R. J.,& Davila, J. M. 1999, ApJ, 526, 494
- Brosius et al. (2000a) Brosius, J. W., Thomas, R. J., Davila, J. M., & Landi, E. 2000a, ApJ, 543, 1016
- Brosius et al. (2000b) Brosius, J. W., Thomas, R. J., Davila, J. M., & Thompson, W. T. 2000b, Sol. Phys., 193, 117
- Brown et al. (2008) Brown, C. M., Feldman, U., Seely, J. F., Korendyke, C. M., & Hara, H. 2008, ApJS, 176, 511
- Culhane et al. (2007) Culhane, J. L., et al. 2007, Sol. Phys., 243, 19
- Delaboudinière et al. (1995) Delaboudinière, J.-P., et al. 1995, Sol. Phys., 162. 291
- Del Zanna et al. (2001) Del Zanna, G., Bromage, B. J. I., Landi, E., & Landini, M. 2001, A&A, 379, 708
- Del Zanna et al. (2010) Del Zanna, G., Andretta, V., Chamberlin, P. C., Woods, T. N., & Thompson, W. T. 2010, A&A, 518, 49
- Del Zanna & Andretta (2011) Del Zanna, G., & Andretta, V. 2011, A&A, 528, 139
- Dere et al. (1997) Dere, K. P., Landi, E., Mason, H. E., Monsignori Fossi, B. C., & Young, P. R. 1997, A&AS, 125, 149
- Dere et al. (2009) Dere, K. P., Landi, E., Young, P. R., Del Zanna, G., Landini, M., & Mason, H. E. 2009,A&A, 498, 915
- Falconer (1994) Falconer, D. A. 1994, PhD Thesis, Univ. of Maryland
- Handy et al. (1999) Handy, B. N., et al. 1999, Sol. Phys., 187, 229
- Harrison et al. (1995) Harrison, R. A., et al. 1995,Sol. Phys., 162, 233
- Jess et al. (2008) Jess, D. B., Rabin, D. M., Thomas, R. J., Brosius, J. W., Mathioudakis, M., & Keenan, F. P. 2008, ApJ, 682, 1363
- Jordan (1975) Jordan, C. 1975, MNRAS, 170, 429
- Kosugi et al. (2007) Kosugi, T., et al., 2007, Sol. Phys., 243, 3
- Landi & Young (2010) Landi, E., & Young, P. R. 2010, 714, 636
- Lang et al. (2002) Lang, J., Thompson, W. T., Pike, C. D., et al., in The Radiometric Calibration of SOHO, eds. A. Pauluhn, M.C.E. Huber and R. von Steiger, ESA SR-002, p.105
- Lang et al. (2006) Lang, J. et al. 2006, Appl. Opt., 45, 8689
- Mango et al. (1978) Mango, S. A., Bohlin, J. D., Glackin, D. L., & Linsky, J. L. 1978, ApJ, 220, 683
- Muglach et al. (2010) Muglach, K., Landi, E., & Doschek, G. A. 2010, ApJ, 708, 550
- Neupert & Kastner (1983) Neupert, W. M. & Kastner, S. O. 1983, A&A, 128, 188
- Neupert et al. (1992) Neupert, W. M., Epstein, G. L., Thomas, R. J., & Thompson, W. T. 1992, Sol. Phys., 137, 87
- Seely et al. (2004) Seely, J.F., et al. 2004, Appl. Opt., 43, 1463
- Swartz et al. (1999) Swartz, M., Condor, C. E., Davila, J. M., et al. 1999, NASA/TP, 1999-208640
- Thomas & Davila (2001) Thomas, R. J., & Davila, J. M. 2001, Proc. SPIE, 4498, 161
- Thomas & Neupert (1994) Thomas, R. J., & Neupert, W. M. 1994, ApJS, 91, 461
- Thomas (2002) Thomas, R. J. 2002, in The Radiometric Calibration of SOHO, eds. A. Pauluhn, M.C.E. Huber and R. von Steiger, ESA SR-002, 225
- Thomas et al. (1999) Thomas, R. J., Davila, J. M., Thompson, W. T., Kent, B. J., & Hollandt, J. 1999, BAAS, 31, 850
- Thompson (1999) Thompson, W. 1999, CDS Software note No.53 (http://solar.bnsc.rl.ac.uk/software/notes.shtml)
- Thompson (2006) Thompson, W. T. 2006, in SOHO-17. 10 Years of SOHO and Beyond, ESA SP, 617, 80
- Tousey et al. (1977) Tousey, R., Bartoe, J.-D. F., Brueckner, G. E., & Purcell, J. D. 1977, Appl. Opt., 16, 870
- Vernazza & Reeves (1978) Vernazza, J. E., & Reeves, E. 1978, ApJS, 37, 485
- Wang et al. (2010) Wang, T. J., Brosius, J. W., Thomas, R. J., Rabin, D. M., Davila, J. M. 2010, ApJS, 186, 222
- Warren (2005) Warren, H. P. 2005, ApJS, 157, 147
- Warren et al. (1998) Warren, H. P., Mariska, J. T., Lean, J. 1998, J. Geophys. Res., 103, 12077
- Woods et al. (1998) Woods, T. N., Rottman, G. J., Bailey, S. M., Solomon, S. C., & Worden, J. R. 1998, Sol. Phys., 177, 133
- Young et al. (2007) Young, P. R., Del Zanna, G., Mason, H. E., et al. 2007, PASJ, 59S, 727
- Young et al. (1998) Young, P. R., Landi, E., & Thomas, R. J. 1998, A&A, 329, 291