The reaction on p-shell nuclei
FINUDA Collaboration , , , , , , , , , , , , , , , , , , , , , , , , , , , , , , , , , , , , , , ††thanks: corresponding author. E-mail: stefano.piano@ts.infn.it; Fax:+39.040.5583350. ††thanks: deceased. Abstract: This letter is concerned with the study of the reaction in p-shell nuclei, i.e., , , and . The emission rates are reported as a function of . These rates are discussed in comparison with previous findings. The ratio in p-shell nuclei is found to depart largely from that on hydrogen, which provides support for large in-medium effects possibly generated by the sub-threshold . The continuum momentum spectra of prompt pions and free sigmas are also discussed as well as the missing mass behavior and the link with the reaction mechanism. The apparatus used for the investigation is the FINUDA spectrometer operating at the DANE -factory (LNF-INFN, Italy).
PACS:21.80.+a, 25.80.Nv
I. INTRODUCTION
This letter describes an experimental study of the reaction , where is , , , and . In this study, the charged -hyperons are reconstructed through their decay channels . The requirement of having one neutron and two charged pions in the final state excludes charged ’s and neutral ’s from the two-body absorption process since both final channels are characterized by a single pion. Moreover, the request for a final excludes detection of the conversion reaction, , and thus the identification of possible -hypernuclear states. For these reasons, this measurement studies the elementary process with the absorbing proton being embedded in .
To understand the nuclear and the nucleon(s) interactions, FINUDA pursued a program of experimental studies through the methodical analysis of the reaction channels. This was to determine the -dependence of capture into hypernuclear bound states [1, 2], which helped to constrain the threshold nuclear potential [3]. Study of the mesonic [4] and non-mesonic [5, 6] weak decay of p-shell -hypernuclei was also part of the studies since it helps in understanding the weak interaction. The analyzes of the pion-less absorption leading to the selected [7], [8] and [9] channels established the possibility of ’s forming quasi-bound states. This is still a debated topic; however, it has spurred widespread interest [10]. The presence of nuclear matter may sensibly modify the sub-threshold behavior of the -N interaction depending on the nuclear density [11, 12, 13, 14]. This occurrence may favorably be probed with the reaction since the channel prevails over the other competing channels. Furthermore, the measurement involves a single proton bound in and takes place at threshold, which also facilitates the study of the under-threshold behavior of the -N interaction.
Kaons, after stopping in nuclei, initially form K-atoms, leading to kaon absorption by nucleons lying at the nuclear surface, giving rise to a number of quasi-free reactions. This analysis selectively examines the processes, where is a bound proton. The prompt pion and free sigma momentum distributions describe the - and -continuum behavior in the reaction . These spectra are discussed in detail rather than the invariant masses. In this case, the channel is filled by two resonances and as well as the continuum whose phase space develops in the same region as the two resonances [15]. The effects of - and - final-state interactions further complicate this scenario since they distort the initial shape of invariant mass distributions. The momentum spectra may give a clearer picture of the dynamics of the absorption by a bound . The missing mass spectra are discussed with the aim of measuring the energy lost via undetected particles. This is to investigate the number of nucleons involved in the kaon absorption and hence the reaction mechanism. The article also focuses on the emission rates, which are compared to earlier bubble chamber measurements. Moreover, they are used to form the ratio (i.e., /) which is known to change significantly when moving the kaon absorption from a free proton to a bound proton [11, 12, 13, 14].
II. THE EXPERIMENTAL PROCEDURE
All the particles involved in the reaction, i.e., ’s (and correlated ’s), ’s and ’s (from decays), are fully reconstructed. Negative and positive kaons result from decays of phi meson, (B.R. 50%), ’s produced by the reaction at the DANE collider. The mesons are created nearly at rest giving rise to kaon pairs which are emitted in nearly opposite directions with a kinetic energy of 16.11.5 MeV. The kaon pairs, after traversing the 2 inner layers of the spectrometer, stop in 0.25 gr/cm2 thick targets about 20.05.3 cm2 in area. Most are solid slabs except for and , the first of which is carbon powder and second liquid . When a starts the reaction, the pair triggers the inner layer of FINUDA and, simultaneously, a final state particle must be detected by the outer layer of FINUDA. Such a selective trigger is mandatory to reject the overwhelming background originated by electrons and positrons circulating in DANE.
The inner (TOFINO [16]) and outer (TOFONE [17]) sensitive layers of FINUDA are two segmented detectors made of plastic scintillator, which are organized as the staves of a barrel. The TOFINO barrel, which encloses the interaction volume, has a diameter of 11 cm and is used for starting the time-of-flight system () and for triggering purposes. TOFONE, which consists of 72 trapezoidal slabs 255 cm long and 10 cm thick, is the stop-counter of the FINUDA , which is used to determine the momentum of neutrons as well as for triggering purposes. The neutron momentum resolution of FINUDA is obtained from the distribution width of monokinetic neutrons arising from the decays of stopped positive sigmas. The momentum distribution of such neutrons is shown in Fig. 1(a), which displays a peak at 187.60.2 MeV/c and a width of 8.40.2 MeV/c at . This width is slightly narrower than the one reported in a previous analysis 9.40.2 MeV/c [18] due to a finer calibration of the present FINUDA . Neutrons from the first run of FINUDA cannot be utilized for this analysis because of the high threshold chosen for TOFONE, which was mainly used for triggering purposes. As a result, neutrons below 20 MeV were hardly
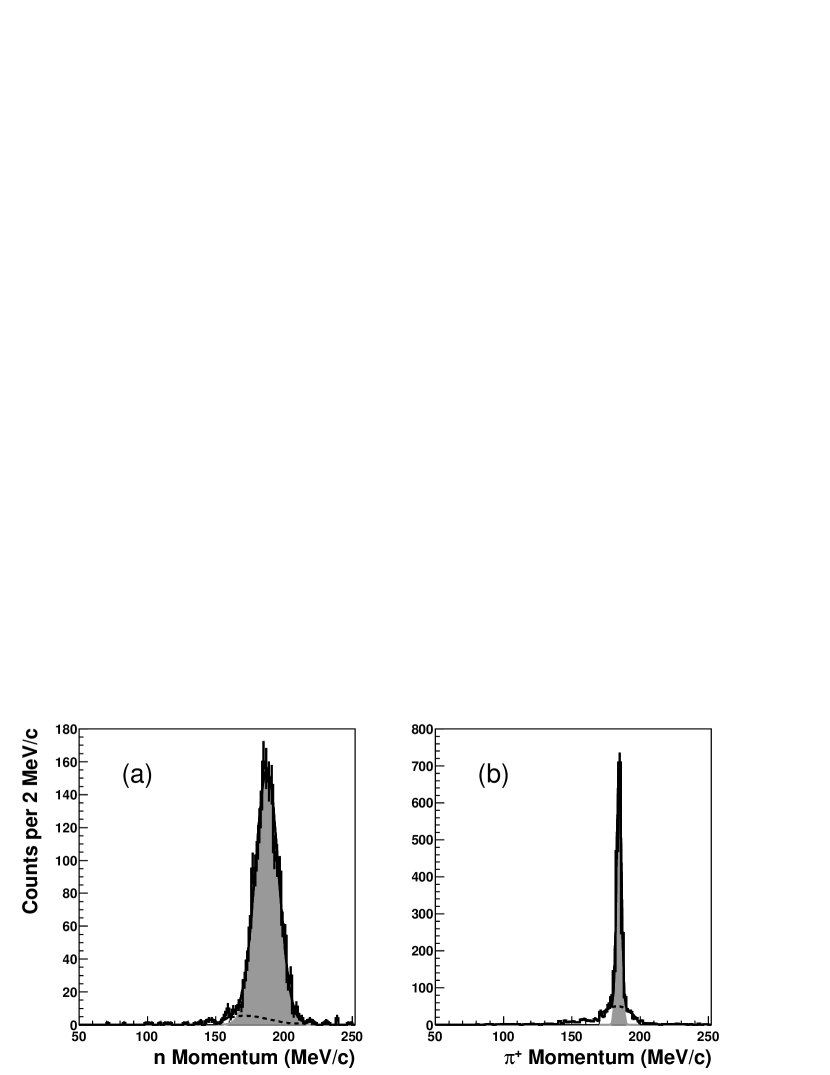
detected and hence sigmas could not actually be reconstructed. The tracking system of FINUDA is located between TOFINO and TOFONE. It consists of a vertex detector [19], two intermediate layers of low-mass drift chambers [20] and an outer array of straw tubes [21]. The vertex detector comprises 2 layers of double-sided micro-strip silicon sensors [19] whose internal layer is located at about 7 cm from the trajectories of the crossing beams. The 2 layers closely surround a stack of 8 solid targets. The outer six layers of straw tubes [21] has the inner layer set at 111.0 cm from the crossing beams. With the nominal field set at 1 T, the spectrometer is capable of analyzing 184.50.1 MeV/c positive pions with a resolution at of 1.720.06 MeV/c (see Fig. 1(b)), which only slightly worsens for pions of lower momenta. However, the reduced spectrometer resolution only weakly alters the continuous behavior of pion (and sigma) spectra.
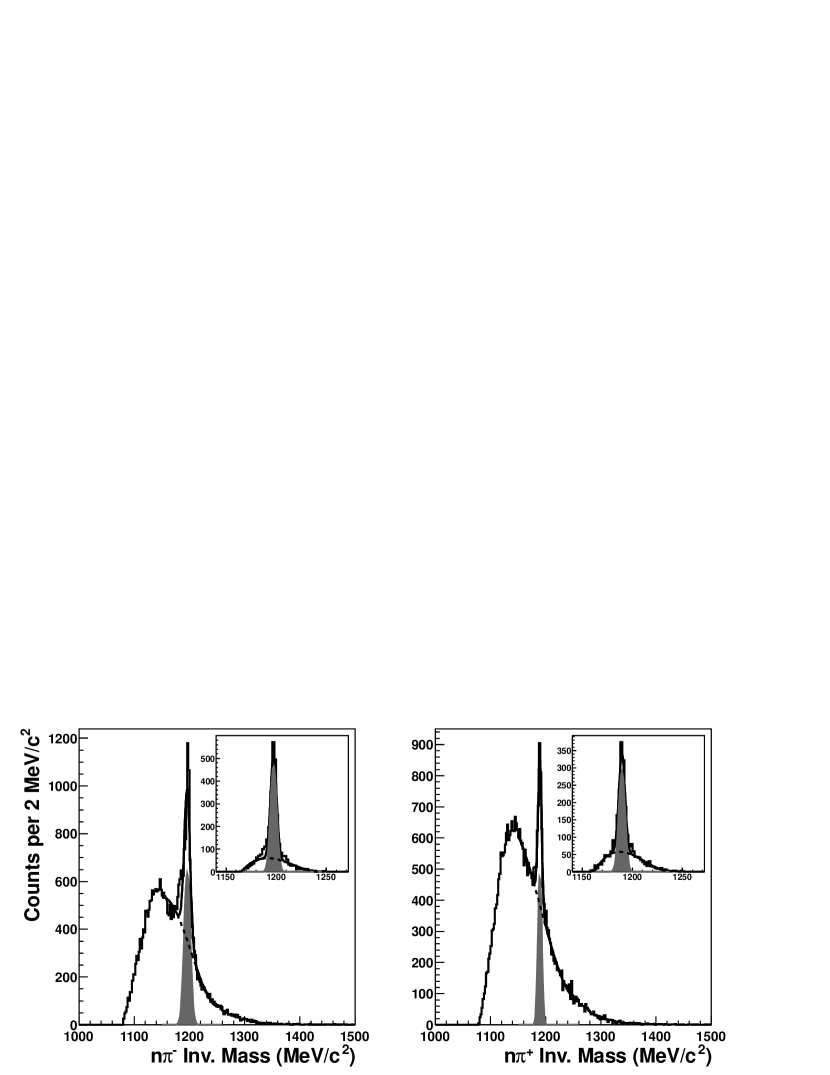
In the present analysis, both kinematic and topological constraints are applied to measured observables. The primary condition for processing a event requires a vertex in one of the targets between the trajectory described by the initial kaon pair and the track of one of the two final pions. A vertex position is reconstructed with an average spatial resolution of 0.7 mm, which is mostly due to the kaon straggling inside the target. In fact, the average resolution of the vertex detector in reconstructing a particle prong is 0.2 mm. The mass of a particle is then defined by the particle energy deposit ( technique) in the two layers of the vertex detector as well as in the two drift chambers. The technique ensures an overall pion ID efficiency above 98%. Fig. 2 shows the and invariant mass behaviors for . The sharp peaks identify the signals, which are placed at 1197.03.4() MeV/c2 and 1189.23.5() MeV/c2, respectively. The signal to background ratio assigned by a peak-fitting procedure is =1.0 and =0.7, where is the area of the grey-filled peaks taken at 2 and is the area below the dotted curves taken in the same mass range. For these spectra, the background is mostly due to gammas which may emulate neutrons in TOFONE, and by neutrons which may scatter before being detected. The background due to misidentification of pions is negligible. A clear background reduction is obtained by requiring the kinematic observables of the events to belong to the phase space volume of the decays, which safely includes the prompt pions. As an example, when applying the above phase space constraints to events, the and invariant mass distributions are dominated by and peaks, see the insets of Fig. 2. When peak fitting these distributions =4.5 and =3.6 thereby permitting a reliable discussion of the physics.
III. THE RESULTS
Prompt pions and free sigmas (see Fig. 2 and related discussion) are fully reconstructed, which ensures a quasi-exclusive character to this measurement. Accordingly, the observables involved in the analysis, i.e., missing masses, momentum distributions and emission rates, should be scarcely affected by background. Fig. 3 shows the () missing mass (M) spectra of . These spectra are formed
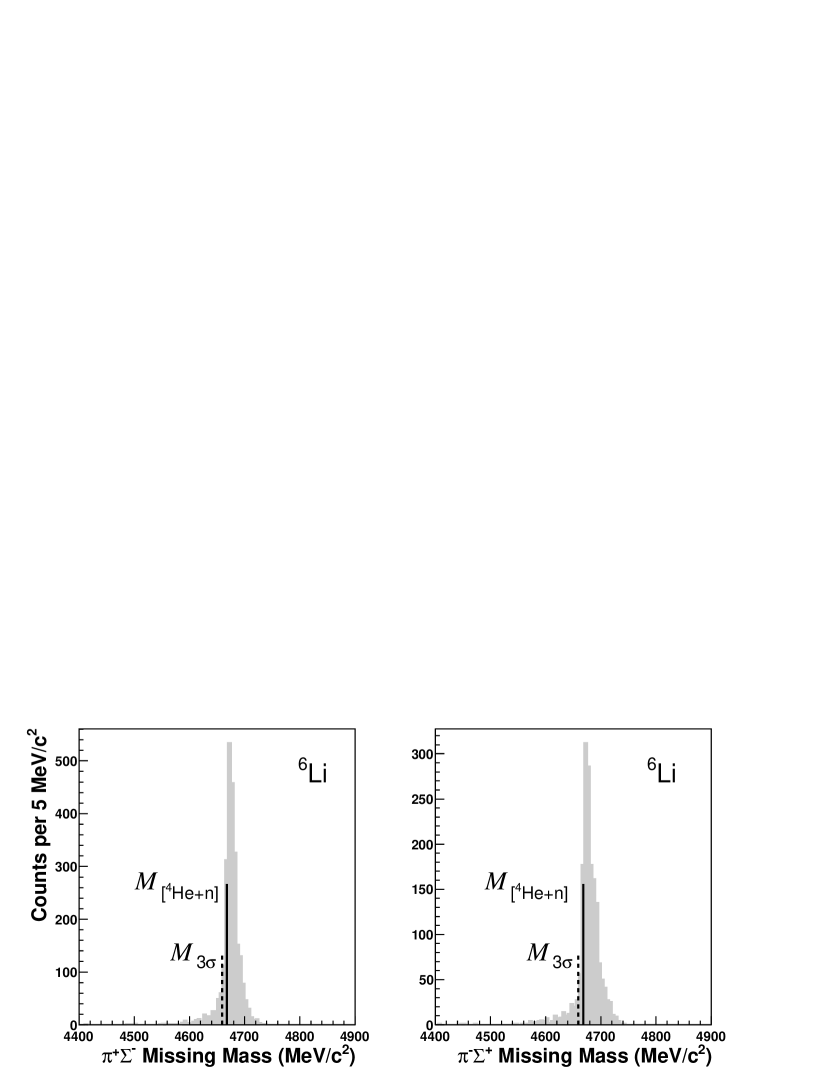
with the same data set of the constrained invariant masses, i.e., the grey-filled distributions in the insets of Fig. 2. The full line denotes the physical threshold of the missing mass, that is, the value acquired by M when . The dotted line points to the missing mass threshold (M3σ) used in this analysis, where the overall uncertainty in measuring M is =3.1 MeV/, or a full-width at half-maximum FWHM=7.3 MeV/. Both distributions are peaked at about 10 MeV/c2 above M and have a FWHM in the range 22-24 MeV/c2.
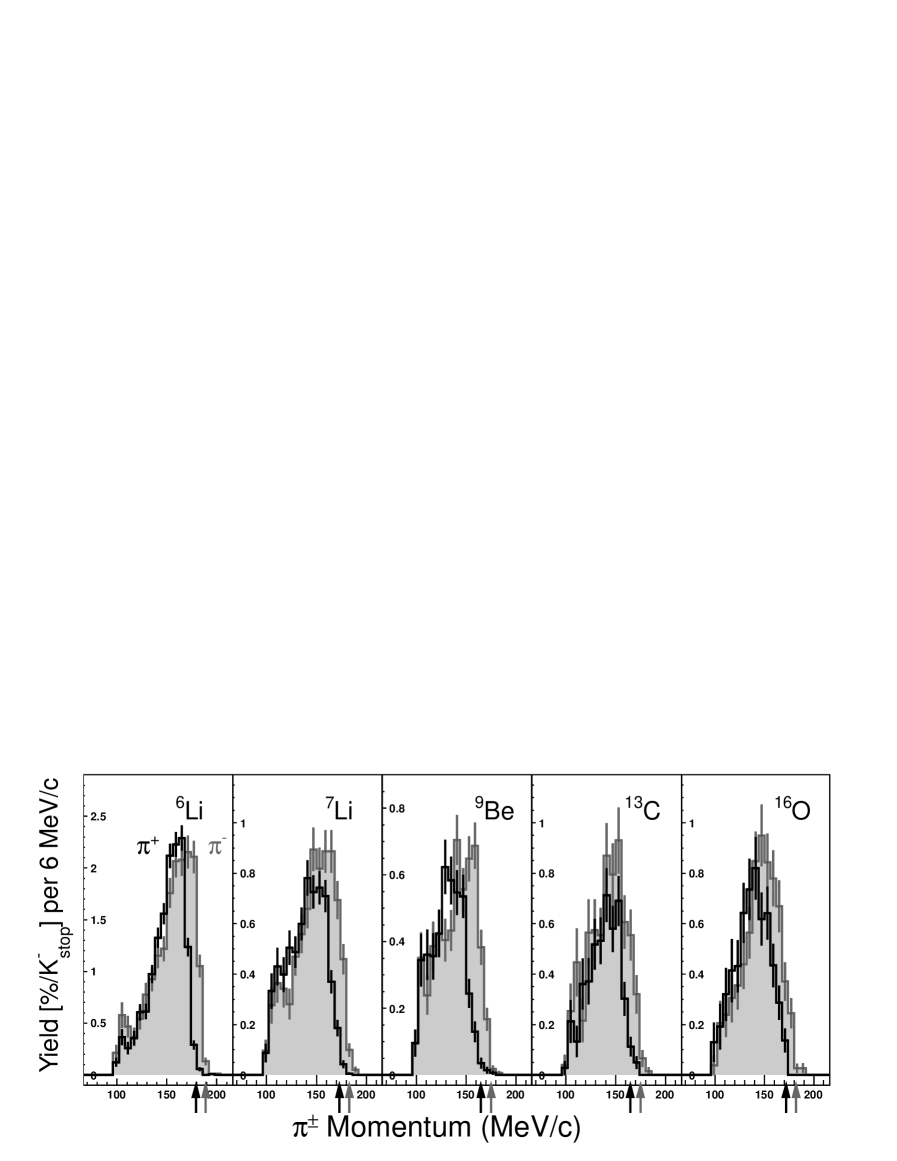
Fig. 4 shows the measured momentum distributions of prompt pions from the reactions. The arrows denote the condition p, where is the binding energy of possible -hypernuclei (). Therefore, broad peaks arising at p would disclose the presence of states. Such states cannot be observed in the present spectra since they are inhibited by requiring a to be present in the reaction exit channel. The distributions of pion (sigma in Fig. 5) momenta are corrected for the spectrometer acceptance, which is the largest source of systematic uncertainty. Such corrections relied on a Monte-Carlo code which embodied the FINUDA geometry. The code was required to generate events with the final particles distributed uniformly over a range of momenta required by the reaction kinematics. The generated events fully crossing the geometry of FINUDA were finally reconstructed with the analysis code. The ratio of the reconstructed to generated events defines the acceptance of the apparatus. For a selected momentum bin, the systematic uncertainty of the acceptance results from the statistical uncertainty of the reconstructed events and the systematic uncertainty arising from the reconstruction of real events, the two uncertainties being added in quadrature. Finally, the error bars associated with the data-points in Figs. 4 and 5 account for the statistics of real events and systematic uncertainty of the acceptance, again calculated by summing in quadrature the two uncertainties. The pion threshold of the spectrometer is slightly below 80 MeV/c; however, the pion momentum distributions are cut at 100 MeV/c to avoid large bin fluctuations due to acceptance correction. Note that above the p thresholds the spectra are scarcely affected by background.
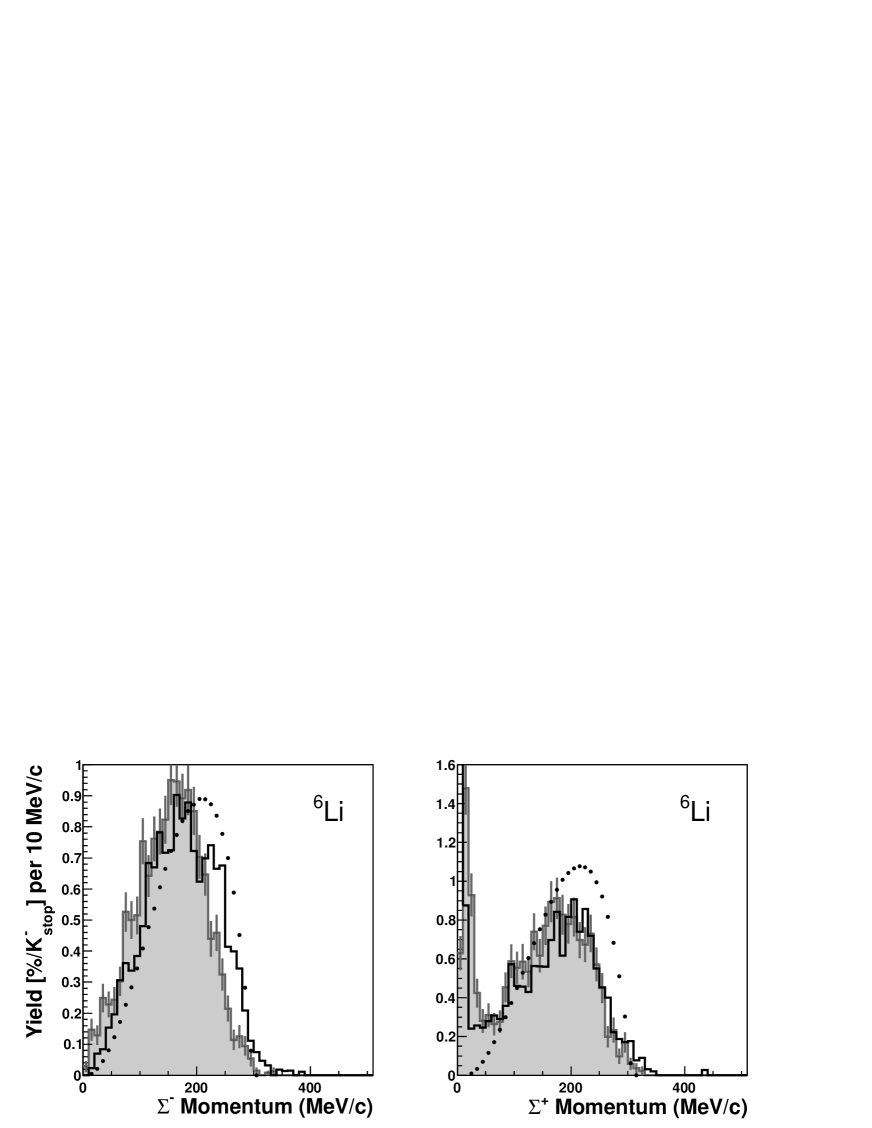
The momenta of ’s are determined by measuring the momenta of their decay products. For , the measured momentum distributions of -hyperons are shown in Fig. 5 (grey-filled histograms). For , the distribution resembles a rather symmetric bump peaked at about 165 MeV/c with a FWHM of 155 MeV/c and shows no strength at around 0 MeV/c. The momentum distribution is instead peaked at around 0 MeV/c and a 160 MeV/c broad-bump arises at 174 MeV/c. In this case, the FWHM of the bump is assessed by removing via a global-fitting method the 0 MeV/c peak, which ultimately smears out the line-shape of the bump. The bumps display little variation in shape: the 10 MeV/c peak shift is explained by the different sigma masses, while the 5 MeV/c wider bump of the -hyperons is well within the uncertainties in assessing the bump widths. For the other nuclei, the momentum distributions are not shown since they display shapes similar to the momentum distributions of with the only exception being the number of events in the 0 MeV/c peak, which basically depends on the target size and density. Such a behavior suggests a way for representing all the measured momentum distributions, which is based on the fact that their symmetric line-shapes can be fitted by means of Gaussian functions. With this approach, the momentum distributions are found to have a mean value of 1677 MeV/c and a FWHM 17820 MeV/c, and the momentum distributions a mean value of 15711 MeV/c and a FWHM 1619 MeV/c.
The sigma momentum distributions appear rather dissimilar at around 0 MeV/c. At these momenta, positive and negative sigmas behave differently when traveling through nuclear targets of finite thickness. For example, a can stop in a target without being absorbed by a surrounding nucleus, which explains the appearance of the peak at around 0 MeV/c. When a comes at rest, it is captured by a target nucleus and later undergoes a - conversion. -hyperons are not presently reconstructed hence the momentum distribution shows no strength at around 0 MeV/c. To account for the different behavior of low-energy charged sigmas in targets of finite size, a Monte-Carlo code was developed which employs the quasi-free reaction to generate the sigma momentum spectra. Then, the spectra were filtered through the geometry of FINUDA, which also accounts for the interaction of with the target media. The resulting momentum spectra (open histograms) are finally compared with the measured momentum spectra and show a reasonable overall agreement. The M-C generated momentum spectra are displayed in Fig. 5 with full dots.
The emission rate leading to final pairs is defined by the ratio:
| (1) |
where is the number of pairs produced when negative kaons stop in . These two observables can be related to the number of () and () counted events () through the equations:
| (2) |
where the parameters correct the observables and for instrumental flaws, namely, the apparatus finite acceptance, inability to fully reconstruct all the events, misidentification of particles and trigger inefficiencies. Both and are assessed with standard Monte-Carlo techniques. A second partially-independent approach to calculate both and is also available, which requires a muon from (BR=63.6%) in coincidence with the initial event. Such an approach avoids any trigger inefficiency but also reduces the useful data-set by at least BR, which causes the statistical uncertainties to augment. When taken with their overall uncertainties, these emission rates are consistent with those calculated by using eqn (1), so only ’s are reported in Table 1.
| 1.8 | |||||
| 30 | 1.20.10.1 | ||||
| 26 | 1.20.10.1 | ||||
| 38 | 1.30.10.2 | ||||
| 1.25 | |||||
| 12 | 1.50.20.1 | ||||
| 36 | 1.20.10.1 | ||||
The values are listed with their statistical and systematic uncertainties those listed in the column account for the loss () at momenta around 0 MeV/c. For a given nucleus, is calculated as follows: by using the momentum distribution of positive sigmas, a loss rate is initially defined by the ratio of the number of sigmas in the 0 MeV/c peak to the number of sigmas in the bump. The number of sigmas in the 0 MeV/c peak as well as in the bump is determined by a global best-fit analysis, where the bump is assumed to have a Gaussian line-shape. Then, the loss rate of positive sigmas is assigned to negative sigmas. As a final note, the data-set is not corrected for the pion attenuation in nor for the - conversion; therefore, these observables represent the emission rates of the reaction . In column five the ratio (the ratio between and ) is reported.
Table 1 also gives an account of the rates published by earlier bubble chamber measurements, the emission rates of [22] and the capture rates of [23]. For the purpose of comparison, the capture rates are reduced to emission rates by means of the numbers discussed in Ref. [23]. In this article, =12.7 (15.9) for the () channel, which becomes 7.9 (9.9) when the - conversion is neglected and finally 7.3 (9.2) when the pion-flux attenuation is not taken into account. The ratio between the emission and capture rates / remains the same 1.250.09. The same data on carbon are reanalyzed in a second article [24], which calculates the capture rates for some channels. In this article, a capture rate 0.004 for was found (about the same as the in the first article) and 0.010 for (about twice the value previously published) resulting in the ratio 2.240.12 [24]. Such a large value of the capture rate for is however based on an emission rate of 9.3, a value that can be assessed via the number of events reported in Table I of Ref. [24]. Such a value is in close agreement with 9.2 the value given in Table 1.
IV. DISCUSSION AND CONCLUSIONS
The analysis aimed at examining the elementary process with belonging to . The experimental method of searching for pairs relies on the capability of FINUDA to detect all the particles involved in the absorption process, i.e., (and the associated , and . For , this method assigns a signal-to-background ratio to sigmas (detected in coincidence with pions) of =3.6 and =4.5. The other targets show similar ratios.
Fig. 3 shows that the missing mass distributions are 22-24 MeV/c2 FWHM. These widths are only in part explained by the measurement uncertainty. When accounting for the instrumental uncertainty, FWHM=7.3 MeV/c2, the missing mass strength is mostly found in the range 1011 MeV/c2, where 10 MeV/c2 is the M peak position above the threshold and 11 MeV/c2 FWHM is the intrinsic width of the distribution. This missing energy must be compared with the available energy, the kaon rest mass, to realize that the final pairs take away from 96% to 100% of the energy available to the reaction. The fraction of energy lost is below 4%, which can be explained by the energy subtracted by de-excitation ’s or by unobserved fragments of as well as by the energy lost by sigmas when traveling through a target. This trait establishes the quasi-free nature of the reaction. Such a valuation also indicates that the kinematics is only slightly altered by final-state interactions. The above discussion is related to but similar conclusions can also be drawn for the other nuclei, , , and . In fact, the missing mass distributions (figures not shown) broaden out to a maximum of 20% when going from =6 to =16.
The data discussed in this article are the result of an exclusive measurement, more than 96% of the available energy is in fact taken by pairs. Previous results were obtained from either studies of inclusive measurements on [25] and [26] or semi-inclusive measurements on a variety of nuclei [27]. For this other class of measurements, there are several processes leading to the same final state; in Ref. [27], the momentum spectrum induced by the reaction is decomposed into six different processes, which makes the separation of the () process from the others difficult.
Fig. 4 shows the momentum spectra of prompt pions, which exhibit a continuum behavior from the kinematic threshold down to 100 MeV/c. These spectra are not corrected for the pion attenuation. Above the kinematic threshold (indicated by arrows in Fig. 4), the momentum spectra are seen to be nearly unaffected by background. The pion spectra are not compared with theoretical predictions, although the absorption of at-rest kaons in nuclei is addressed in Ref. [28]. The authors develop a plain model of the interaction, which is only capable of explaining the shape of the spectra without helping the interpretation of the data presently discussed. The similarity among the measured momentum distributions of sigmas shows that the absorption reaction depends weakly on for p-shell nuclei. This is also corroborated by the analyzes based on Monte-Carlo simulations, which show that the quasi-free reaction is capable of explaining the shapes of all the distributions. Moreover, the sigma momentum spectra are weakly distorted by - final-state interactions since they mainly proceed via the conversion reaction, which selectively removes sigmas from the outgoing flux. Therefore, the M-C generated sigma momentum distributions (full dots in Fig. 5) give a fair account of the shapes of sigma momenta. The to conversion rate was not determined for these spectra.
The emission rates / are reported in Table 1. They are also compared with earlier bubble chamber measurements for [22] and [23], which were published in the early seventies. To this day, these are the only available data. When the elementary process occurs on a bound proton the relationship 1 holds for light nuclei; in fact, the ratio ranges from 1.8 to 1.3 to 1.2 for , and , respectively. If the same process occurs on a free proton () then the relationship is reversed: =0.42 ( in Ref. [29]). Such a clear increase of , when moving the interaction from a free proton to a bound proton, can be related to the sub-threshold modification of the interaction.
For the light nuclei examined, the average value of is 1.30.1 whose flat behavior indicates that the kaon absorption occurs preferentially at the surface of a nucleus. This value of can be compared directly with the ratio =Yield /Yield being calculated in Ref. [11]. In this article, the behavior of is given as a function of , where is the nuclear density at saturation. is predicted to vary from 1.4 to 1.7 for ranging from 0.0 to 0.35, this range accounting for the nuclear skin densities of light nuclei. Moreover, the ratio corresponds to the model c option, that is, the option that accounts for final state particle absorption. The agreement between theoretical predictions and the experimental value of is remarkable. The discussion on the measured emission rates cannot take further advantage of the comparison with theory because of the lack of model calculations. The exception is the inclusive reaction , where capture rates as well as pion momentum spectra are calculated [13].
The absorption of stopped kaons involves only surface protons when the final state particles are pairs. Nevertheless, Table 1 shows that when a neutron is added to a nucleus drops for both channels; in fact, for the lithium isotopes is =0.44 for both and . This fact reflects the excess of surface neutrons over surface protons of with respect to . Such an excess has the net effect of depleting the number of stop centers leading to pairs. The same relationship is also found for the carbon isotopes, =0.75 for and 0.63 for . As a final note, the large values of ’s found for reflect the previously measured large value for since this nucleus forms the lithium core.
ACKNOWLEDGMENTS
This work was supported by the Istituto Nazionale di Fisica Nucleare (INFN) of Italy. It is a pleasure to thank Prof. A. Gal for the useful suggestions. The support received from the DANE crew was indispensable for the success of the experiment, which was highly appreciated.
References
- [1] M. Agnello et al., Phys. Lett. B622 (2005) 53.
- [2] M. Agnello et al., Phys. Lett. B698 (2011) 219.
- [3] A. Cieply et al., Phys. Lett. B698 (2011) 226.
- [4] M. Agnello et al., Phys. Lett. B681 (2009) 139.
- [5] M. Agnello et al., Nucl. Phys. A804 (2008) 151.
- [6] M. Agnello et al., Phys. Lett. B685 (2010) 247.
- [7] M. Agnello et al., Phys. Rev. Lett. 94 (2005) 212303.
- [8] M. Agnello et al., Phys. Lett. B654 (2007) 80.
- [9] M. Agnello et al., Phys. Lett. B669 (2008) 229.
-
[10]
W. Weise, Nucl. Phys. A835 (2010) 51.
A. Gal, Prog. Theor. Phys. Suppl. 186 (2010) 270. - [11] S. Wycech, Nucl. Phys. B28 (1971) 541.
- [12] L. R. Staronski and S. Wycech, J. Phys. G13 (1987) 1361
- [13] A. Ohnishi, Y. Nara and V. Koch, Phys. Rev. C56 (1997) 2767.
- [14] E. Friedman and A. Gal, Phys. Rep. 452 (2007) 89.
- [15] D. Jido, E. Oset and T. Sekihara, Eur. Phys. Jour. A47 (2011) 42.
- [16] V. Filippini, M. Marchesotti, and C. Marciano, Nucl. Instr. and Methods A424 (1999), 343.
- [17] A. Pantaleo et al., Nucl. Instr. and Methods A545 (2005) 593.
- [18] M. Agnello et al., Phys. Lett. B701 (2011) 556.
- [19] P. Bottan et al., Nucl. Instr. and Methods A427 (1999) 423.
- [20] M. Agnello et al., Nucl. Instr. and Methods A385 (1997) 58.
-
[21]
L. Benussi et al., Nucl. Instr. and Methods A361 (1995) 180;
L. Benussi et al., Nucl. Instr. and Methods A419 (1998) 648. - [22] P.A. Katz et al., Phys. Rev. D1 (1970) 1267.
- [23] C. Vander Velde-Wilquet et al., Nucl. Phys. A241 (1975) 511.
- [24] C. Vander Velde-Wilquet et al., Nuovo Cim. 39 A (1977) 538.
- [25] T. Harada and T. Akaishi Phys. Lett. B262 (1991) 205.
- [26] P. C. Gugelot, S. M. Paul and R. D. Ransome, Phys. Rew. C41 (1990) 2445.
- [27] H. Outa et al., Progr. of Theor. Phys. Suppl. 117 (1994) 177.
- [28] C. B. Dover, D. J. Millener and A. Gal, Phys. Rep. 184 (1989) 1.
- [29] R. J. Nowak et al., Nucl. Phys. B139 (1978) 61.