Photometric Study and Detection of Variable Stars in the Open Clusters - I : NGC 6866
Abstract
We present results of a variability search in the intermediate-age open cluster NGC 6866 from 29 nights over two observing seasons. We find 28 periodic variables, of which 19 are newly identified. The periods of these variables, which have magnitudes from 11.5 to 19.3 mag, range from 48 min to 37 d. We detected several -Scuti stars, some of which are of high amplitude, as well as -Doradus, rotational variables and eclipsing binaries. In order to study the physical properties of the cluster, we obtained photometry of all the stars on a good photometric night. The radial distribution of the stellar surface density shows that the cluster has a radial extent of about 7 arcmin ( 3 pc) with a peak density of stars/arcmin2 at the cluster center. The colour-colour diagram indicates a reddening of mag towards NGC 6866. A distance of 1.47 kpc and an age of 630 Myr is estimated from the colour-magnitude diagram using the theoretical isochrones of solar metallicity.
keywords:
open cluster:individual:NGC 6866–stars: variables:general–techniques:photometric1 INTRODUCTION
The study of Galactic open clusters is important for understanding the history of star formation and the nature of the parent star clusters. These systems are used to test stellar models and are vital for our understanding of stellar evolution. By comparing the colour-magnitude diagram of a star cluster with theoretical evolutionary models, its age may be estimated and information on the evolution of stars of nearly the same age and chemical composition could be obtained. However, uncertainties in various parameters such as reddening, distance and chemical composition compromise our efforts to measure the age and other parameters. Some cluster members also show various kinds of variability at different stages of their evolution. For example, a wide variety of pulsating variable stars such as Scuti and Cephei stars are found in open star clusters. Observations of these variables can be used to infer many important stellar parameters such as their masses, radii and luminosities. These parameters are required for an investigation of the relationships between rotation, stellar activity, age and masses (Messina et al. 2008, 2010) and impose constraints on stellar pulsation models. Recent work on cluster variable stars can be found in Hargis & Sandquist (2005), Parihar et al. (2009), Marchi et al. (2010), Saesen et al. (2010), among others.
At ARIES, Nainital, we have started a long-term observational survey of variable stars in unstudied or poorly studied young and intermediate age open clusters. The purpose of this survey is to search and characterize the variable star content of these clusters and to determine their fundamental parameters. Young clusters allow the study of pre-main sequence (PMS) stars and the effects of variability on the spread in cluster ages. Intermediate age clusters can be used to study short-period variables such as Scuti and Dor stars. Intensive un-interrupted observations over a few hours, as well as extensive observations spanning several months and years, are planned for many such clusters.
In this paper, we present a study of the intermediate age open cluster NGC 6866 (RA = 20:03:55, DEC = +44:09:30; ). The cluster is in the field observed by the Kepler satellite, whose aim is to search for earth-like planets by monitoring the light variations of more than 150 000 stars in a 105 square degree field situated in the Cygnus-Lyra region. The data obtained in this mission are also used for the asteroseismic study of pulsating variables and to investigate stellar characteristics with micro-magnitude precision and uninterrupted time coverage (see, Basri et al. 2010). The cluster NGC 6866 has not been extensively surveyed for variability. The Hipparcos and Tycho catalogues contain a few suspected variables in the cluster. Molenda-Zakowicz et al. (2009) obtained time-series CCD photometric observations of this cluster for 14 nights over a period of about 3 months. They found 19 variables in the field of the cluster, of which 12 seem to be periodic variables. However, due to their limited time coverage, the periods and characteristics of these variables are somewhat uncertain.
Details of the observations and data reduction are presented in §2. The photometric calibration and cluster parameters are studied in §3. In §4 we discuss identification of variable stars and their characteristics. This is followed by a discussion and the conclusions.
2 Observations and data reduction
Time-series observations of stars in NGC 6866 were obtained in the Johnson and Cousin bands using the 1.04-m Sampurnanand telescope at Manora Peak, Nainital. We used a 2k 2k CCD camera covering a field of view of about 13 13 arcmin. The readout noise and gain of the CCD are 5.3 e- and 10 e-/ADU respectively. The cluster was observed for 29 nights between 2008 September 26 and 2011 January 10 over two observing seasons. Priority was given to -band observations in order to increase the time sampling in this waveband. A total of 768 frames in the band and 50 frames in the band were accumulated. Bias and twilight flat frames were taken on a regular basis. To improve the signal-to-noise ratio, all observations were taken in binning mode ( arcmin). The exposure time for each frame ranged from 30 sec to 200 sec depending on sky conditions and time constraints. Typical seeing was 2 arcsec. In order to detect short-period variables we observed NGC 6866 continuously for more than 4 hours on 3 different nights with an observing cadence of about 2.2 min. A brief log of the observations is given in Table 1.
| Date | JDstart | Filters | No. of frames |
| (+2450000) | |||
| 2008 09 26 | 4736.088461 | V | 46 |
| 2008 09 27 | 4737.071076 | V,I | 57,2 |
| 2008 09 28 | 4738.090602 | V | 54 |
| 2008 09 30 | 4740.084549 | V | 50 |
| 2010 09 30 | 5470.132100 | V,I | 3,3 |
| 2010 10 05 | 5475.112778 | V | 51 |
| 2010 10 06 | 5476.106863 | V | 100 |
| 2010 10 07 | 5477.060637 | V | 142 |
| 2010 10 08 | 5478.046644 | V | 5 |
| 2010 10 10 | 5480.104676 | V | 108 |
| 2010 10 12 | 5482.275231 | V | 3 |
| 2010 10 20 | 5490.058611 | V | 3 |
| 2010 10 24 | 5494.084444 | V | 3 |
| 2010 10 25 | 5495.117824 | V | 3 |
| 2010 10 26 | 5496.076435 | V,I | 3,3 |
| 2010 10 27 | 5497.068206 | I | 3 |
| 2010 10 28 | 5498.065243 | V,I | 3,3 |
| 2010 10 31 | 5501.105200 | V,I | 3,3 |
| 2010 11 01 | 5502.088067 | V,I | 3,3 |
| 2010 11 02 | 5503.081900 | V,I | 7,3 |
| 2010 11 03 | 5504.048300 | V,I | 61,3 |
| 2010 11 04 | 5505.111852 | V | 51 |
| 2010 11 30 | 5531.032500 | V,I | 2,2 |
| 2010 12 02 | 5533.042700 | V,I | 2,2 |
| 2010 12 24 | 5555.034086 | V,I | 2,2 |
| 2011 01 04 | 5566.040800 | I | 3 |
| 2011 01 05 | 5567.041516 | V,I | 3,6 |
| 2011 01 06 | 5568.051100 | I | 3 |
| 2011 01 10 | 5572.043906 | I | 6 |
The basic steps of image processing, which include bias subtraction, flat fielding, and cosmic ray removal, were performed using IRAF. During the observations, it was not possible to keep all the stars at the same pixel position on every night. The IRAF tasks GEOMAP and GEOTRAN were used to align all the images with respect to a reference frame which was chosen so that the cluster center falls approximately at the center of the observed field. In most cases, we achieved a pixel accuracy of 0.1 arcsec.
3 Photometric study of the cluster NGC 6866
3.1 Photometric Calibration
Photometry was performed using DAOPHOT II profile fitting software (Stetson 1987). In order to perform consistent photometry from night to night on the aligned images, we made a master list of 2809 stars from 13 frames which have the best seeing and coverage of the target field. It should be noted that not all stars could be measured on every frame owing to different exposure times and sky conditions.
To determine the extinction coefficients, colour terms and zero points, we
used Landolt’s (1992) standard fields SA95 and PG 0231051. These were
observed on the night of 2010 November 30 in photometric sky conditions.
Exposure times of 300, 300, 200, 100, and 60-sec were used for , , ,
and respectively. We acquired two frames each of NGC 6866 and PG 0231+051 and
four frames of SA95. A total of fifteen standard stars with and
were observed during this night with airmasses ranging from
1.11 to 2.04. Nine of these stars are in SA95 and six in PG 0231051.
We used profile-fitting photometry to extract the magnitudes using the program
DAOGROW for obtaining the curve-of-growth corrections. A linear
least square regression was used to the standard system to derive the following
transformation equations:
where and are the aperture instrumental magnitudes and and are the standard magnitudes and is the airmass. Zero-point and colour-coefficient errors are 0.01 mag. These equations were used to generate secondary standard stars in the target field observed on the same night. To standardize the data on remaining nights, differential photometry was performed using these secondary stars. We used a linear fit between the standard and instrumental magnitudes on each night, assuming that most of the stars are non-variables. We rejected stars which deviated by more than deviations. In Fig. 1, we show the standard deviations as a function of magnitudes in bands. The photometric errors were computed on the night of standardization. The typical standard deviation is less than 0.05 mag for stars brighter than 19 mag in band.

3.2 Comparison with previous photometry
NGC 6866 has not been intensively observed in the past. photoelectric and photographic photometry were obtained by Hoag et al. (1961), Johnson et al. (1961), and Barkhatova and Zakharova (1970), mostly for bright stars. Recently, Molenda-Zakowicz et al. (2009; hereafter MOL09) obtained CCD photometry in a arcmin field centred on NGC 6866 using the 60-cm telescope at the Bialḱow Observatory of the Wroclaw University, Poland. They observed 552 stars and derived calibrated and photometry. We did not compare our photometry with the older photoelectric and photographic work as these contain relatively large errors and are mostly confined to the brighter stars. We do, however, compare our results with MOL09 which, in turn, have been compared with older photoelectric and photographic measurements. We have cross-identified our stars with those of MOL09 and find 511 stars in common. Fig. 2 shows the difference, , in and between our photometry and MOL09. A linear fit between our magnitudes and those of MOL09 shows a magnitude dependence which can be given by the following equation

Our magnitudes are noticeably brighter than MOL09 for the brightest stars, particularly towards mag. For faint stars, the magnitudes and colours between two photometry seem to be in agreement within their internal photometric errors.
3.3 Astrometry
To convert the pixel coordinates (X,Y) into celestial coordinates (, ), a linear astrometric solution was derived by matching about 134 bright stars in common between our catalogue and the 2MASS catalogue. We used the CCMAP and CCTRAN tasks inside IRAF for this purpose. Using these equations, we converted the (X,Y) position into J2000 celestial coordinates for all the stars in our catalogue. The typical rms scatter, as derived from the difference between calibrated and catalogued coordinates, is about 0.1 arcsec.
| ID | RA | DEC | U | B | V | R | I | |||
|---|---|---|---|---|---|---|---|---|---|---|
| 1 | 20:04:06.21 | 44:04:55.0 | 11.700.01 | 11.010.01 | 10.030.07 | 9.540.08 | 9.130.03 | 0.26 | 1.00 | 0.00 |
| 2 | 20:03:52.44 | 44:11:31.0 | 10.920.01 | 10.750.01 | 10.570.04 | 10.400.03 | 10.260.03 | 0.72 | 1.00 | 0.76 |
| 3 | 20:04:09.32 | 44:04:16.2 | 10.980.01 | 10.950.02 | 10.620.01 | 10.440.01 | 10.260.01 | 0.14 | 1.00 | 0.00 |
| 4 | 20:03:57.62 | 44:08:37.5 | 11.270.01 | 11.080.01 | 10.750.03 | 10.590.02 | 10.400.01 | 0.83 | 1.00 | 0.91 |
| 5 | 20:04:02.85 | 44:11:55.4 | 11.520.01 | 11.310.01 | 11.080.01 | 10.940.01 | 10.800.01 | 0.60 | 1.00 | 0.82 |
| 6 | 20:03:52.57 | 44:11:33.1 | 11.170.01 | 11.150.02 | 11.090.01 | 11.010.03 | 11.010.01 | 0.72 | 1.00 | 0.76 |
| 7 | 20:03:57.35 | 44:09:33.5 | 11.590.01 | 11.430.01 | 11.190.01 | 11.080.01 | 10.970.01 | 0.91 | 1.00 | 0.89 |
| 8 | 20:03:40.66 | 44:11:43.5 | 10.920.01 | 11.230.01 | 11.220.01 | 11.200.01 | 11.220.01 | 0.54 | 1.00 | 0.94 |
| 9 | 20:03:52.57 | 44:15:46.9 | 14.900.01 | 12.900.01 | 11.290.03 | 10.440.02 | 9.550.03 | 0.12 | 0.00 | 0.65 |
| 10 | 20:04:22.90 | 44:10:31.2 | 11.770.01 | 11.560.01 | 11.350.01 | 11.230.01 | 11.110.02 | 0.25 | 1.00 | 0.64 |
| 11 | 20:03:54.70 | 44:10:52.9 | 11.800.01 | 11.640.01 | 11.370.01 | 11.210.01 | 11.060.01 | 0.82 | 1.00 | 0.54 |
| 12 | 20:03:22.82 | 44:15:50.3 | 13.290.01 | 12.520.01 | 11.530.03 | 10.980.03 | 10.530.06 | 0.00 | 1.00 | 0.88 |
| 13 | 20:03:55.17 | 44:08:24.2 | 13.260.01 | 12.640.01 | 11.600.01 | 11.090.01 | 10.580.01 | 0.83 | 1.00 | 0.73 |
| 14 | 20:03:51.69 | 44:10:19.1 | 12.060.01 | 11.940.01 | 11.630.01 | 11.480.01 | 11.310.01 | 0.88 | 1.00 | 0.68 |
| 15 | 20:03:57.70 | 44:06:27.6 | 13.380.01 | 12.730.01 | 11.690.01 | 11.190.01 | 10.690.01 | 0.54 | 1.00 | 0.26 |
| 16 | 20:03:26.12 | 44:10:05.3 | 12.110.01 | 12.060.01 | 11.720.01 | 11.510.01 | 11.320.04 | 0.28 | 1.00 | 0.66 |
| 17 | 20:03:55.18 | 44:10:44.0 | 12.290.01 | 12.140.01 | 11.860.01 | 11.740.01 | 11.610.01 | 0.84 | 1.00 | 0.53 |
| 18 | 20:03:53.15 | 44:09:20.4 | 12.330.01 | 12.360.01 | 11.950.01 | 11.740.01 | 11.510.02 | 0.96 | 1.00 | 0.13 |
| 19 | 20:04:27.27 | 44:10:48.8 | 14.030.01 | 13.100.01 | 11.970.01 | 11.390.01 | 10.810.01 | 0.13 | 0.00 | 0.65 |
| 20 | 20:04:25.52 | 44:10:16.2 | 12.450.01 | 12.300.01 | 11.980.01 | 11.810.01 | 11.600.01 | 0.19 | 1.00 | 0.16 |
| 21 | 20:03:23.96 | 44:10:46.8 | 14.490.01 | 13.270.01 | 11.990.01 | 11.330.01 | 10.690.03 | 0.21 | 0.00 | 0.72 |
| 22 | 20:03:56.83 | 44:10:32.0 | 12.410.01 | 12.270.01 | 12.020.01 | 11.910.01 | 11.780.01 | 0.85 | 1.00 | 0.59 |
| 23 | 20:03:39.17 | 44:14:19.1 | 12.500.01 | 12.300.01 | 12.020.01 | 11.850.01 | 11.700.02 | 0.23 | 1.00 | 0.93 |
| 24 | 20:03:49.52 | 44:10:50.7 | 12.390.01 | 12.260.01 | 12.040.01 | 11.940.01 | 11.820.02 | 0.79 | 1.00 | 0.74 |
| 25 | 20:04:06.14 | 44:12:54.5 | 14.220.01 | 13.240.01 | 12.070.01 | 11.460.01 | 10.880.01 | 0.43 | 0.00 | 0.02 |
| 26 | 20:04:18.38 | 44:09:52.2 | 12.520.01 | 12.360.01 | 12.080.01 | 11.910.01 | 11.730.01 | 0.37 | 1.00 | 0.40 |
| 27 | 20:03:47.13 | 44:09:25.7 | 12.650.01 | 12.520.01 | 12.200.01 | 12.020.01 | 11.820.01 | 0.82 | 1.00 | 0.80 |
| 28 | 20:04:14.16 | 44:12:32.9 | 12.870.01 | 12.810.01 | 12.210.01 | 11.870.01 | 11.540.01 | 0.33 | 1.00 | 0.00 |
| 29 | 20:03:28.54 | 44:09:42.1 | 14.360.01 | 13.390.01 | 12.280.01 | 11.720.01 | 11.190.02 | 0.35 | 0.00 | 0.02 |
| 30 | 20:04:03.97 | 44:10:20.5 | 12.740.01 | 12.630.01 | 12.310.01 | 12.140.01 | 11.950.01 | 0.72 | 1.00 | 0.83 |
| 2472 | 20 03 33.64 | 44 13 43.2 | - | 21.850.31 | 21.240.30 | 20.190.20 | 18.990.32 | 0.21 | 0.08 | - |
| 2473 | 20:03:51.71 | 44:10:37.0 | - | 22.020.49 | 21.500.38 | 20.510.26 | 19.530.19 | 0.84 | 0.22 | - |
In Table 2, we present photometric measurements for 2473 stars identified in the field of the cluster NGC 6866. This is only a sample listing; the full table is available in electronic form. The table contains the star ID, its celestial coordinates for J2000 and magnitudes and their corresponding errors. It should be noted that we were able to determine the magnitudes for only about half of these stars owing to the low quantum efficiency of the CCD in the band.
3.4 Cluster parameters
3.4.1 Radius
The spatial structure of an open cluster, as derived from the stellar density distribution obtained by star counts, is difficult to estimate because of the irregular shape of the cluster. However, we can obtain some information about the core and the approximate cluster radius. To determine the radial density distribution (RDP), we divided the cluster into a number of concentric annular regions centred on the cluster. The center of the cluster was defined by the pixel coordinate (483, 519) in our reference CCD frame. The cluster radius is defined as the radius where the surface density becomes approximately equal to the average density of the surrounding field. To reduce field star contamination, we only used stars brighter than 19 mag in in determining the stellar surface density. The spacing of the annular regions was set to 40 pixels ( 30 arcsec). This was chosen in such a way that each zone contains a statistically significant number of stars.
We counted the number of stars in each annular region. The number density in zone is then , where and are the number of stars and the area of the zone respectively. The error bars are derived assuming that the number of stars in a zone follows Poisson statistics. The radial variation of the derived density distribution is shown in Fig. 3.

Kaluzny (1992) models the projected stellar density distribution as
where is the density at the cluster center, is the field density and is the core radius of cluster. The core radius is defined as the radius where the density, , is half of the central density, . A fit to this function is shown by the solid line in Fig 3. Using minimization, we determined the core radius and central density to be arcmin and stars/arcmin2 respectively. Even though our CCD frames did not encompass a large area, we are able to determine that the surface density is approximately equal to the density of the surrounding field stars at a radius of about 7 arcmin, which we take as the cluster radius.
3.4.2 Reddening
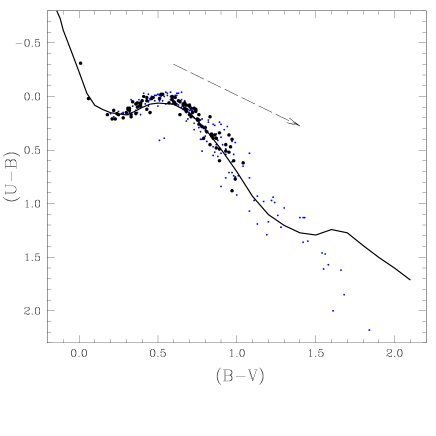
The reddening, , in the cluster region can be determined using the vs two-colour diagram (TCD). Because only half the stars have measurements, and also to avoid contamination by field stars, we used only stars with mag and , , smaller than 0.05 mag. The resulting TCD is shown in Fig. 4. The observed cluster sequence is clearly seen, as is the turn off which occurs at about spectral type A0. The most probable cluster members with mag and mag are shown by a different symbol.
We adopted the slope of the reddening vector . We then fitted the intrinsic zero-age main sequence (ZAMS) with solar metallicity, as given by Schmidt-Kaler (1982), to the observed main-sequence (MS) stars. This was done by shifting and along the reddening vector (shown in Fig. 4 by the dashed line). The best match results in a mean reddening of mag for NGC 6866.
3.4.3 Distance and Age
The identification of the cluster main sequence on the colour-magnitude diagrams (CMDs) allows a model-dependent mass, radius, and distance for each star to be determined. These are determined by fitting isochrones assuming that the star is on the main sequence. To derive these parameters, we constructed calibrated , , and vs diagrams of NGC 6866 using our data (Fig. 5). A well-defined cluster main sequence is clearly seen in all the CMDs. However, they are contaminated by the typical red field star population. In order to determine the age and distance of the cluster, theoretical isochrones of Girardi et al. (2002) for solar metallicity are over-plotted on the CMDs (solid lines in Fig. 5). Girardi isochrones are visually fitted by varying the distance modulus and age simultaneously while keeping the reddening fixed at mag (as estimated earlier using TCD). We have assumed that the total extinction . The best-fit model of the cluster gives a reddening-free distance modulus = 10.84 mag and an age of yrs.


The physical parameters determined for the cluster NGC 6866 in the present study are summarized in Table 3. We also compare our results with those given by Kharchenko et al. (2005). In general, our values are in good agreement. However, we obtained a significantly smaller core radius and reddening than Kharchenko et al. (2005).
| Cluster parameter | Present study | Kharchenko et al. (2005) |
|---|---|---|
| (arcmin) | 2.0 | 4.2 |
| (arcmin) | 7.0 | 8.4 |
| Mean | 0.10 | 0.17 |
| 11.15 | 11.33 | |
| log(Age/yr) | 8.8 | 8.68 |
| Distance (kpc) | 1.47 | 1.45 |
4 Variable stars in the cluster NGC 6866
4.1 Selection criteria to identify variables
After excluding observations taken under poor sky conditions, we considered only 718 photometric observations in and 47 in bands for the variability search. In order to search variable stars in the target field, the time-series band magnitude of all the stars are passed through the periodicity analysis explained in the following section. A star was analysed for variability only if it met the following criteria.
-
1.
The star should not be within 10 pixels of the edge of any frame.
-
2.
The magnitude of the star should have a standard deviation less than three times the mean error in the corresponding magnitude bin.
-
3.
The stellar magnitude needs to be measured in at least 100 frames.
4.2 Periodicity analysis
We used the Lomb-Scargle periodogram (Lomb 1976, Scargle 1982) to estimate the period of a variable star. This method computes the Fourier power spectrum by fitting sine and cosine terms over a large number of frequencies in the given frequency range and is applicable to unevenly sampled data. The period was derived using only the -band data because of the better sampling in this filter. In some cases, a few points were removed because either they were deviated by more than 0.2 mag in two sequential observations or strongly deviated from the mean magnitude. To search periodic variables, we have given a range of periods between 0.01 days to 100 days as our total time length was about 100 nights in 2010. The large range of period search was chosen because Lomb-Scargle method uses a period search in the logarithmic time scale hence shallower at the longer periods. However, we have not considered any period beyond 50 days, which is about half of the total observing span. We noticed that many spurious variables were found with periods which are harmonics or daily aliases of each other. These stars were rejected. The only stars lie in the magnitude range were considered for variability search as photometric magnitudes have large errors towards fainter end. Further, we have not considered 2008 observing data for the brighter stars having mag which shows large uncertainty in the photometric measurements.

After these selection criteria, we visually inspected the light curves of the remaining stars for periodic variation and found 28 variable stars. A phased light curve was derived for each star using an estimated period. A phase-folded light curve, binned in intervals of 0.01 phase, was constructed by taking the average of the magnitudes in these phase bins. It was noticed that some periodic variables, particularly in binary stars, the period-finding routine gives a ‘best-fit’ period that actually corresponds to half the orbital period. To detect such variables, we inspected the light phased at twice the period given by the period-finding algorithm. For example, variable ID 248 gives a period of 0.217-day using the Lomb-Scargle algorithm, but by visual inspection we found that the true period is 0.434-d because the light curve has two unequal minima. In this way, we found seven stars which were better represented with twice the period given by the Lomb-Scargle periodogram.
| Star | RA | DEC | Period | V | Membership Probability | Classification based on | ||||||
|---|---|---|---|---|---|---|---|---|---|---|---|---|
| ID | (J2000) | (J2000) | (days) | (mag) | (mag) | (mag) | Status | present study | MOL09 (ID, P) | |||
| 0016 | 20:03:26.12 | 44:10:05.3 | 0.465333 | 11.747 | 0.34 | 0.064 | 0.28 | 1.00 | 0.66 | likely | binary? | |
| 0020 | 20:04:25.52 | 44:10:16.2 | 0.380373 | 12.003 | 0.32 | 0.032 | 0.19 | 1.00 | 0.16 | unlikely | binary? | |
| 0027 | 20:03:47.13 | 44:09:25.7 | 0.143616 | 12.222 | 0.32 | 0.039 | 0.82 | 1.00 | 0.80 | member | Sct | Sct (V3, 0.1060.02) |
| 0036 | 20:03:42.47 | 44:10:06.4 | 0.214684 | 12.623 | 0.32 | 0.035 | 0.70 | 0.47 | 0.84 | likely | Sct | |
| 0039 | 20:03:54.18 | 44:06:46.0 | 0.836120 | 12.677 | 0.25 | 0.035 | 0.60 | 1.00 | 0.81 | likely | Dor | Dor (V12, 0.707) |
| 0047 | 20:04:11.20 | 44:05:33.3 | 0.275710 | 12.995 | 0.31 | 0.041 | 0.27 | 1.00 | 0.55 | unlikely | ? | Sct (V1, 0.066) |
| 0058 | 20:03:31.61 | 44:07:59.8 | 0.911577 | 13.246 | 0.97 | 0.052 | 0.38 | 0.00 | 0.00 | field | Dor | |
| 0074 | 20:03:34.93 | 44:14:50.1 | 0.321750 | 13.469 | 0.43 | 0.055 | 0.11 | 1.00 | 0.72 | likely | Ell | W UMa (V5, 0.321) |
| 0081 | 20:03:27.93 | 44:09:19.1 | 1.239157 | 13.548 | 0.43 | 0.058 | 0.33 | 1.00 | 0.92 | likely | Dor | Irr (V13) |
| 0094 | 20:03:59.34 | 44:10:25.8 | 0.740741 | 13.878 | 0.43 | 0.087 | 0.82 | 1.00 | 0.77 | member | Dor | Dor (V11, 0.805) |
| 0158 | 20:03:40.87 | 44:09:40.0 | 2.285714 | 14.902 | 0.68 | 0.052 | 0.66 | 1.00 | 0.75 | member | EA | |
| 0191 | 20:03:33.48 | 44:13:53.4 | 1.090513 | 15.285 | 0.67 | 0.085 | 0.19 | 1.00 | 0.67 | likely | binary? | |
| 0221 | 20:03:53.35 | 44:04:04.2 | 0.476872 | 15.564 | 0.83 | 0.079 | 0.21 | 1.00 | 0.86 | likely | PV | |
| 0231 | 20:03:48.28 | 44:10:56.6 | 0.327547 | 15.615 | 0.70 | 0.052 | 0.76 | 1.00 | 0.81 | member | PV | |
| 0239 | 20:04:19.00 | 44:07:05.8 | 37.037037 | 15.63 | 2.09 | 0.26 | 0.27 | 0.00 | 0.81 | unlikely | semi-reg | Irr (V18) |
| 0248 | 20:03:38.79 | 44:04:53.0 | 0.437446 | 15.66 | 0.82 | 0.21 | 0.22 | 1.00 | 0.74 | likely | Ell | Ell (V9, 0.434) |
| 0253 | 20:04:20.84 | 44:10:03.9 | 7.407407 | 15.73 | 1.18 | 0.06 | 0.31 | 0.00 | 0.32 | field | Rot | Irr (V14) |
| 0332 | 20:03:43.64 | 44:05:19.7 | 11.494253 | 16.19 | 1.44 | 0.14 | 0.33 | 0.00 | 0.18 | field | semi-reg | |
| 0349 | 20:04:11.78 | 44:13:06.9 | 12.048193 | 16.31 | 1.41 | 0.10 | 0.32 | 0.00 | 0.97 | unlikely | semi-reg | |
| 0444 | 20:04:21.25 | 44:15:40.6 | 16.260162 | 16.82 | 1.47 | 0.31 | 0.00 | 0.00 | 0.00 | field | EB | |
| 0487 | 20:03:49.82 | 44:11:08.5 | 0.415110 | 17.21 | 0.93 | 0.34 | 0.76 | 1.00 | 0.85 | member | W UMa | W UMa (V7, 0.415) |
| 0494 | 20:04:00.17 | 44:14:03.2 | 0.366704 | 17.26 | 1.03 | 0.44 | 0.34 | 1.00 | 0.00 | unlikely | W UMa | W UMa (V6, 0.366) |
| 1077 | 20:04:13.87 | 44:03:45.8 | 0.033559 | 18.58 | 0.66 | 0.34 | 0.02 | 0.00 | 0.96 | unlikely | HADS | |
| 1088 | 20:03:56.20 | 44:12:49.9 | 0.184775 | 18.67 | 1.02 | 0.28 | 0.53 | 0.04 | 0.03 | field | HADS | |
| 1274 | 20:04:26.66 | 44:05:35.9 | 0.462428 | 19.05 | 1.42 | 0.46 | 0.00 | 1.00 | - | unlikely | W UMa | W UMa (V4, 0.262) |
| 1292 | 20:03:41.23 | 44:12:17.9 | 0.295247 | 18.95 | 1.72 | 0.37 | 0.49 | 0.30 | 0.98 | unlikely | HADS | |
| 1421 | 20:03:41.08 | 44:08:47.4 | 0.041263 | 19.15 | 0.87 | 0.30 | 0.65 | 0.00 | 1.00 | unlikely | HADS | |
| 1583 | 20:03:58.70 | 44:11:33.5 | 0.082055 | 19.26 | 0.99 | 0.32 | 0.70 | 0.00 | 0.73 | likely | HADS | |
Among the 28 periodic variables identified in the present study, 19 are newly detected. Table 4 lists the identification number of variable stars, celestial coordinates, period, and its membership probabilities. We also give the intensity-averaged mean magnitude and the amplitude of brightness variation in band. The amplitude was estimated as the difference between the median values of the upper and lower 15% magnitude values of the light curve (cf., Herbst et al. 2002; Messina et al. 2010). In the last two columns, we give a possible class of variability from our analysis and corresponding identification in MOL09 and period if the star has already been identified. The band phased light curves of these variables are shown in Fig. 6.
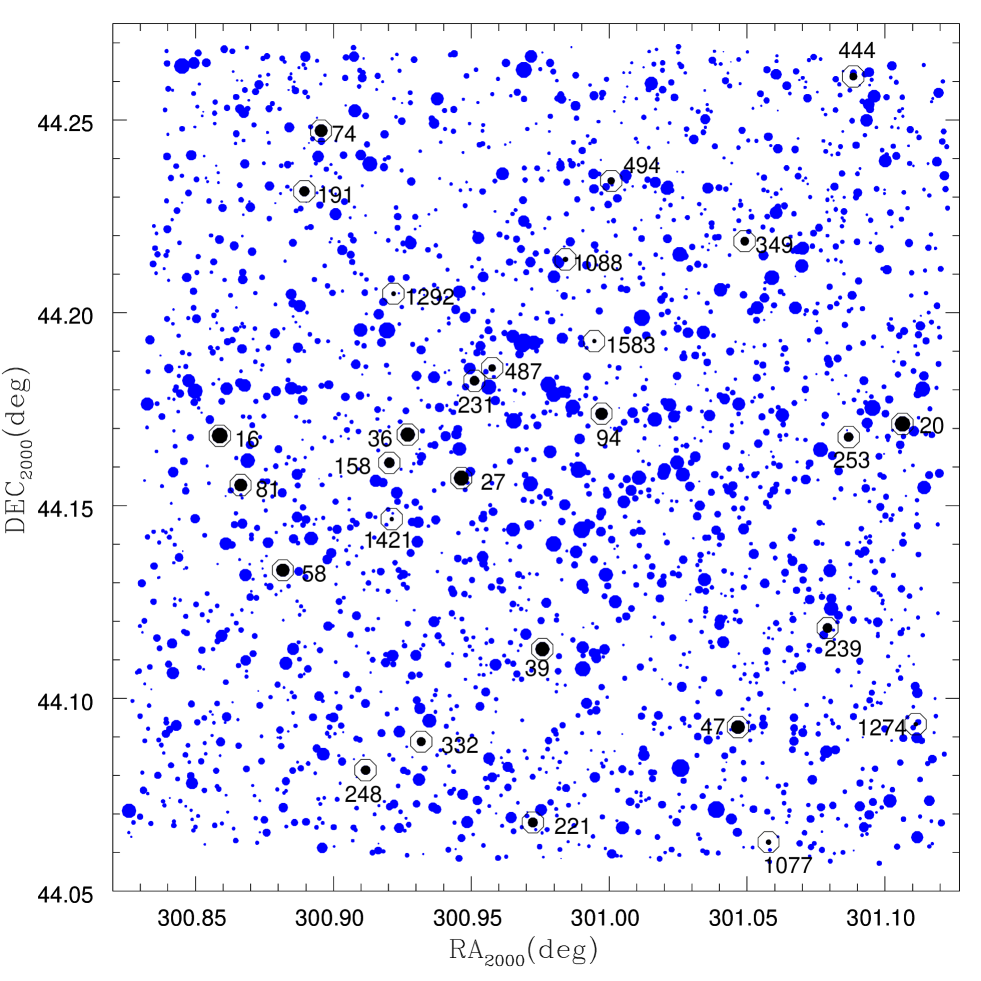
Having the lesser number of data points, smaller amplitude of variation and larger photometric error in band in comparison to band, we do not use band data in our analysis. However, band phase light curves for all the 28 variables along with their time-magnitude photometric data in and bands, are available in electronic form. In Fig. 7, we provide a finding chart of a arcmin field of the cluster marking the variable stars.
4.3 Comparison with other catalogues and previously known variables
No time-series photometric observations of NGC 6866 have been published prior to MOL09. They detected 19 variables, 12 of which were periodic variables. Out of 19 variable stars, we are able to find periodicity in 12 variables while 2 irregular variables V15 (ID 53) and V16 (ID 89) in their list has also shown irregular variation in our data. Remaining five variables from MOL09 are not included in our list of variable stars. Variable V2 (ID 30) is reported as Scuti star with an amplitude variation of only 0.006 mag. We are unable to detect such a low-amplitude variation in this bright ( mag) star owing to the uncertainties in our data towards brighter end. Star V08 (ID 92) is heavily blended by two very nearby stars brighter than this star. Though the light curve shows a significant flux variation in our data but not an ellipsoidal in nature as reported by MOL09. Since this is a contaminated star, its variability is highly susceptible to include it in our list of variable stars. The star V10 (ID 82) is listed as an eclipsing binary (EA) in their catalogue. For a period of 1.916 d, as reported by MOL09 for this star, we should be able to confirm the variations because our observations extend over a longer time span. However, we cannot confirm the eclipsing nature of this star from the present data. Two stars in their catalogue, V17 and V19, which were classified as irregular variables lie close to the edges of our frames. Since their reliable photometry could not be determined in at least 100 frames, we exclude them from our list of variable stars.
It can be seen from the Table 4 that there is a significant difference between our periods and those of MOL09 for 5 variables. We therefore created phase-folded light curves using periods from MOL09 for each variable in common and compared them by eye with our phased light curves. We do not see any systematic periodic variation for these variables using their period apart from the Scuti star V3 which could have either period. Variable V4 (ID 1274) is a faint star ( mag) which lies close to edge of our CCD chip in most of the frames hence could be detected only in 111 frames. We therefore caution that the our estimated period may not be very reliable due to its small number of data points.
4.4 Cluster membership of the variable stars
We assigned a probability of cluster membership to a star on the basis of its angular distance from the cluster center, its location in the color-magnitude diagram and its proper motion with reference to the mean proper motion of the cluster. The spatial probability (), which gives the position of the star in the field of the cluster, was determined as , where is the angular distance of stars from the cluster center, and (7 arcmin) is the radius of the cluster.
The photometric probability () was computed with reference to the blue and red limits in the vs diagram. The blue sequence was defined using empirical ZAMS colors (Schmidt-Kaler 1992) shifted in magnitude and color by 11.15 and 0.10 mag respectively to visually match the cluster sequence. The red sequence was defined by a shift of mag in and a shift of 0.042 in in order to account for unresolved MS binaries (Maeder 1974, Kharchenko 2004). Stars with colors lying within the binary sequence of the MS were assigned of 1 and are probable members of the cluster, while stars deviating along either direction were assigned a probability as , where is the difference of color from blue or red color limits and is the photometric error in color.
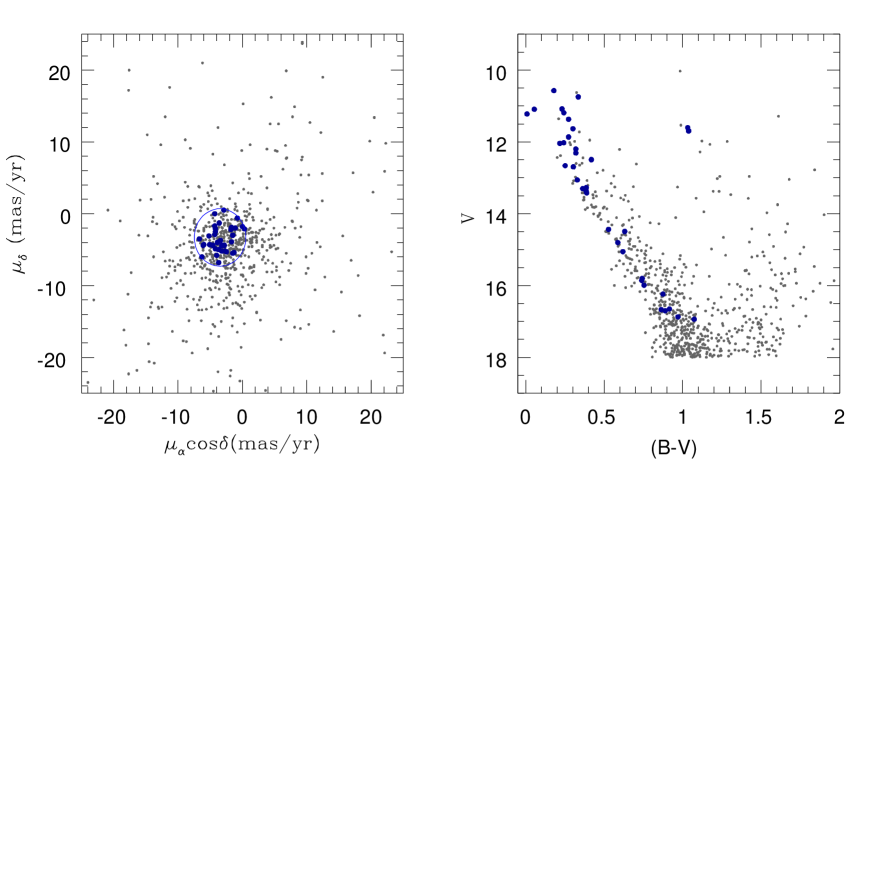
The proper motion probability () was calculated using the catalogue of Roeser et al. (2010) which lists positions in ICRS system (accuracy 80 to 300-mas) and absolute proper motion (accuracy 4 to 10-mas/yr) of about 900 million stars, derived from the optical USNOB1.0 and near-infrared 2MASS all sky catalogs. A cross-match of our photometry (2473 point sources) with that of Roeser et al. (2010) gave 1772 stars in common within a radius of 500 mas. For these stars, a scatter plot of the proper motion in right ascension () versus that in declination () is plotted in Fig. 8. Unlike other nearby well studied open clusters (see, e.g. Bellini et al. 2010), no clear trend separating members and field stars is seen. We therefore computed the mean proper motion of the cluster with mag, and , which gives mean proper motions, = mas/yr and = mas/yr 111The mean proper motion of NGC 6866 is consistent with the value () estimated by M09 who calculated an older catalogue of Roeser et al (2008) which lists proper motion data of only brightest ( mag) stars.. The computations were done iteratively using a -clipping algorithm and the uncertainties denote deviations. The for each star was computed following Kharchenko et al (2004) as , where and . We could thus assign for 1949 stars in common with the R10 catalog within a search radius of 1 arcsec. The probabilities , and are listed in Table 2.
On the basis of spatial probability, stars found in the core of the cluster NGC 6866 ( arcmin), for which is greater than 0.710.06, could be the cluster member. The star having =1.0 might belong to the cluster on the basis of photometric probability and, stars which have (1-) are most probably belong to the cluster on the basis of proper motion criteria. Five variable stars detected in the present study which satisfy all the three probability criteria are considered as definite members of the cluster NGC 6866. Nine stars which satisfy two criteria are considered as likely members while other 9 stars those satisfy either only one criterion or have are considered as unlikely members. Five stars that do not follow any membership criteria are considered as definite field stars. Membership probabilities and their status as a cluster member are given in the Table 4.
4.5 Characterization of the variable stars
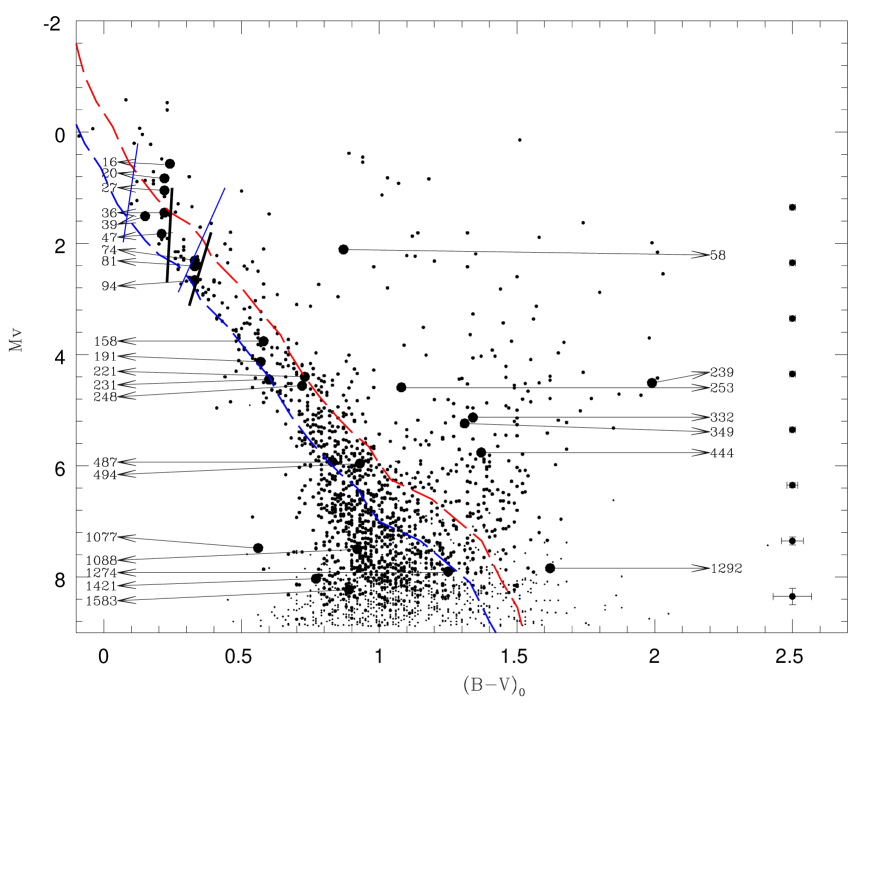
We assessed the classifications of variable stars by manually comparing their phase-folded light curves to template light curves of different class of variables. Our classification is primarily based on period, shape of the light curves and location of the star in the CMD. In Fig. 9, we show the position of the variable stars in the plane of the cluster. The intrinsic magnitude and color of the variable stars are determined using the distance modulus = 11.15 mag and extinction = 0.10 mag as estimated in our study. The dashed line is the ZAMS taken from Schmidt-Kaler (1982). In order to draw the classical instability strip in the CMD, we transformed the theoretical instability strip boundaries of Pamyatnysk et al. (2000) into our observational plane using color- relations from VandenBerg & Clem (2003). The characterization of the variable stars detected in our study is summarized as follows:
4.5.1 Previously identified variables
ID 27 is classified as a Scuti by MOL09. In the CMD, this star is located within the Scuti instability strip, justifying their classification. IDs 39 and 94 are reported as -Dor variables. The location of ID 39 is towards the blue edge of the Scuti instability strip, but its period suggests that it is a -Dor star. This makes it an interesting target for the future observations. Star 81 is classified as irregular variable in MOL09. We found a periodicity of 1.24 day in the present data, however, our observations do not give a uniform sampling at all the phases hence period may be little uncertain. This star along with the star 94 fall in the -Dor instability strip in the HR diagram which suggests that these stars belong to -Dor class of variables. MOL09 classified stars 74, 487, 494 and 1274 as W Ursa Majoris (W UMa) type variables. Our light curves support their classification for the stars 487, 494 and 1274, however, light curve of the star 74 looks like an ellipsoidal variation. Star 248 has an unusual light curve. This star is reported as an ellipsoidal variable but it does not have the typical light curve of interacting binaries. It shows the light minima of equal depth instead of the maxima. Such a strange light curve might arise if we view an interacting binary in a highly-eccentric orbit close to pole-on. The variation in brightness is a result of the change in sizes of the stars as they start approach periastron. Stars 239 and 253 are classified as irregular variables by MOL09, but our phased light curves show clear periodic variability. Star 239, which is an unlikely member of the cluster, is reddest (, ) and longest period ( 37 day) variable identified in the present study. This star is most-likely a background red giant and variability in these stars shows considerable periodicity in their light variation, accompanied or sometimes interrupted by various irregularities as seen in its light curve. We therefore classified this star as a semi-regular variable. Star 253 seems to be a rotating variable.
Star 47 is reported as 0.066 day -Sct variable (V1) by MOL09. Though this star falls in the -Sct instability strip in the CMD of our data, the shape of light curve is not a typical -Sct variation. Moreover, our study finds a period of 0.275 day and magnitude variation of 0.041 mag for this star which is significantly higher in comparison of MOL09. While proper motion probability for this star is reported as 72% by MOL09, present study gives a probability of only 55%. Based on the spatial distribution, this star has only 27% probability of belonging to the cluster. Therefore, despite this star falling in the -Sct instability strip in the CMD of the cluster, present observations suggests that the star is unlikely a cluster member and highly susceptible for being a -Sct variable.
4.5.2 New variables
A total of 16 new variables were detected from the time-series data analysis of NGC 6866. We classify star 36, a likely member of the cluster, as Scuti variable as it is located in the Scuti instability strip. Star 58, which is a field star, shows a light variation similar to a -Dor variable. Stars 16, 20 and 191 show similar light curves. They could be binary stars, though further data is needed to ascertain their exact nature of variability. Star 158 seems to be an eclipsing binary of the Algol (EA) type, where the primary and secondary eclipses are clearly seen in the phased light curve. Stars 221 and 231 show similar light curves. The periods and amplitudes are also similar. Star 221 is a likely member, 231 is a confirmed member of the cluster based on their membership probabilities. Both stars lie on or near the main sequence. These stars are placed in the group of pulsating variables (PV). Stars 332 and 349 look like a semi-regular or long period variable (LPV). Star 444 has a periodicity of 16.3 days and display signature of primary and secondary eclipses. More observations will be needed to see light variations at all the phases for this long period variable, nevertheless, we classify this star as Lyr (EB) type binary based on present observations. Stars 1077, 1088, 1292, 1421 and 1583 have periods similar to Scuti stars, but have significantly large amplitudes, suggesting that these stars could be high-amplitude -Sct stars (HADS).
Present study along with MOL09 classified stars 487, 494 and 1274 as W UMa type variable which are known to obey a PLC relationship between the period, color and absolute brightness (Rucinski 2004) as follows:
where is the intrinsic color index and is the orbital period in days. We derived the apparent distance modulus of each W UMa star from the absolute magnitude determined using the above relation and their mean magnitudes. A reddening of was assumed. Of the three W UMa variables, star 487 is the most interesting. It has a very high proper motion probability of 0.85, spatial probability of 0.76 and photometric probability of 1.0 and hence considered as a confirmed member of the cluster. However, of this star is estimated as 12.53 mag from the W UMa PLC relationship. This is 1.38 mag fainter than the apparent distance modulus of the cluster. Since the period and colour of this star is quite robust, a large value of suggests that either this star is not a cluster member or it does not belong to class of W UMa variables hence not following the above relationship. This star needs further attention to ascertain its true membership and nature of variability. Other two stars 494 and 1274 has zero proper motion and no proper motion information available respectively. Though both of them fall in the CMD, their spatial position in the target field is quite far from the cluster center. Furthermore, stars 494 and 1274 are fainter by 0.94 and 2.03 mag respectively than the estimated distance modulus of the cluster. This makes these two W UMa stars unlikely members of the cluster.
5 Summary
The work presented here is the first paper of our series of papers on detection and characterization of variable stars in young and intermediate age open clusters. In this work we have presented a search for variable stars in the cluster NGC 6866. We found 28 variables in the period range 0.03-day ( 48-mins) to 37-day and confirm the irregularity in the light curves of other two irregular variables reported by MOL09. Among them, 16 are newly-discovered periodic variables. We also determined period for 3 other variables which were reported as irregulars in MOL09. Prior to this study, the shortest period variable detected in NGC 6866 was a 13 mag -Sct star with a period of 1.6-hr. Since we have carried out continuous observations in the band for more than 4 hours on 3 nights, this has enabled us to find variable star with period as short as 48 min. In the field of NGC 6866, we did not find any variable star which shows variations in excess of 0.5 mag. In comparison with previous studies, we report more than twice the number of periodic variables in the field of NGC 6866.
In the present study, we have analysed membership of the stars on the basis of their distance from the cluster center, positions on the CMD, and their proper motions, wherever available. The membership probabilities of the stars on the basis of all the three criteria were estimated. Our analysis of 28 periodic variables suggests that 14 variables are either confirmed members or likely members of the cluster, while remaining 14 variables are either field stars or unlikely members of the cluster. Based on the shape and period of the light variations, together with the colour and amplitude, we found several Scuti, -Dor, rotational variable and eclipsing binaries. Few variables could not be classified with precision and more photometric observations are needed to ascertain the exact nature of these stars. Further multi-colour photometry and spectroscopic observations of these stars will help to determine their parameters such as masses and radii.
We also provide calibrated photometry of 2473 stars down to mag. These data were used to determine the physical parameters of the cluster and derive the cluster radius from the stellar density profile and the extinction, distance and age from the colour-colour and colour-magnitude diagrams. The basic parameters of the cluster NGC 6866 is obtained through isochrone fitting, giving yr, a distance modulus of = 10.84 mag, and extinction = 0.10 mag. The radial distribution of the stellar surface density indicates that the core and cluster radius is extended up to about 2 and 7 arcmin respectively with a peak density of star/arcmin2 at the cluster center.
Acknowledgments
We are thankful to J. Molenda-Żakowicz for providing photometric data of their published variables. Thanks to Rama Kant, N. K. Chakradhari, Manoj Patel and Vindor Kumar for their observational support. SJ acknowledge the grant received under the Indo-South Africa Science and Technology Cooperation INT/SAFR/P-3(3)2009) funded by Departments of Science and Technology of the Indian and South African Governments.
References
- (1) Barkhatova K. A., Zakharova P. E., 1970, UcZUr, 93, 3
- (2) Basri G., Walkowicz L. M., Batalha N., 2011, AJ, 141, 20
- (3) Bellini A., Bedin L. R., Pichardo B., et al., 2010, A&A, 513, 51
- (4) Girardi L., Bertelli G., Bressan A., et al., 2002, A&A, 391, 195
- (5) Hargis J. R., Sandquist, E. L., 2005, AJ, 130, 2824
- (6) Herbst W., Bailer-Jones C. A. L., Mundt R., Meisenheimer K., Wackermann R., 2002, A&A, 396, 513
- (7) Hoag A. A., Johnson H. L., Iriarte B., et al., 1961, Publ. US Nav. Obs., 17, 343
- (8) Johnson H. L., Hoag A. A., Iriarte B., Mitchell R. I., Hallam K. L., 1961, Bull. Lowell Obs. No. 113, Vol V, No. 8, 133
- (9) Kaluzny J., 1992, Acta Astron., 42, 29
- (10) Kharchenko N. V., Piskunov A. E., Roeser S., Schilbach E., Schola R., -D, 2004, Astro. Nachr., 325, 740
- (11) Kharchenko N. V., Piskunov A. E., Roser S., Schilbach E., Schola R., -D, 2005, A&A, 438, 1163
- (12) Landolt A. U., 1992, AJ, 104, 340
- (13) Lomb N. R., 1976, ApSS, 39, 447
- (14) Maeder A., 1974, A&A, 32, 177
- (15) Marchi F. De, Poretti E., Montalto M., Desidera S., Piotto G., 2010, A&A, 509, A17
- (16) Messina S., Distefano S., Parihar P., et al., 2008, A&A, 483, 253
- (17) Messina S., Parihar P., Koo J. -R., et al., 2010, A&A, 513, A29
- (18) Molenda-Zakowicz J., Kopacki G., Steslicki M., Narwid A., 2009, AcA, 59, 193 (MOL09)
- (19) Pamyatnykh A. A., 2000, ASPC, 210, 215
- (20) Parihar P., Messina S., Distefano E., Shantikumar N. S., Medhi, B., 2009, MNRAS, 400, 603
- (21) Roeser S., Demleitner M., Schilbach E., 2010, AJ, 139, 2440
- (22) Rucinski S. M., 2004, NewAR, 48, 703
- (23) Saesen S., Carrier F., Pigulski A., et al., 2010, A&A, 515, A16
- (24) Scargle J. D., 1982, ApJ, 263, 835
- (25) Schmidt-Kaler Th., 1982, In: Landolt/Bornstein, Numerical Data and Functional Relationship in Science and Technology, New series, Group VI, Vol. 2b, Scaifers K., Voigt H. H. (eds.) Springer - Verlog, Berlin, p. 14
- (26) Stetson P. B., 1987, PASP, 99, 191
- (27) VandenBerg D. A., Clen J. L., 2003, 126, 778