Possible detection of the M31 rotation in WMAP data
Abstract
Context. Data on the cosmic microwave background (CMB) radiation by the Wilkinson Microwave Anisotropy Probe (WMAP) had a profound impact on the understanding of a variety of physical processes in the early phases of the Universe and on the estimation of the cosmological parameters.
Aims. Here, the 7-year WMAP data are used to trace the disk and the halo of the nearby giant spiral galaxy M31.
Methods. We analyzed the temperature excess in three WMAP bands (W, V, and Q) by dividing the region of the sky around M31 into several concentric circular areas. We studied the robustness of the detected temperature excess by considering 500 random control fields in the real WMAP maps and simulating 500 sky maps from the best-fitted cosmological parameters. By comparing the obtained temperature contrast profiles with the real ones towards the M31 galaxy, we find that the temperature asymmetry in the M31 disk is fairly robust, while the effect in the halo is weaker.
Results. An asymmetry in the mean microwave temperature in the M31 disk along the direction of the M31 rotation is observed with a temperature contrast up to K/pixel. We also find a temperature asymmetry in the M31 halo, which is much weaker than for the disk, up to a galactocentric distance of about ( kpc) with a peak temperature contrast of about K/pixel.
Conclusions. Although the confidence level of the signal is not high, if estimated purely statistically, which could be expected due to the weakness of the effect, the geometrical structure of the temperature asymmetry points towards a definite effect modulated by the rotation of the M31 halo. This result might open a new way to probe these relatively less studied galactic objects using high-accuracy CMB measurements, such as those with the Planck satellite or planned balloon-based experiments, which could prove or disprove our conclusions.
Key Words.:
Galaxies: general – Galaxies: individual (M31) – Galaxies: disks – Galaxies: halos1 Introduction
Galaxy rotation, in particular for the Andromeda galaxy (M31) has been well studied especially in the optical, IR, and radio bands, and it gives important information on the mass distribution not only in galactic disks but also in their halos (Binney, 1998). On the other hand, since they are not directly observable, but their presence is deduced from their effect on galactic dynamics, galactic halos are relatively less studied structures of galaxies. Various populations, such as globular clusters, RR Lyrae, subdwarfs, and other types of stars, have been used to trace the halo of the Galaxy, its vertical structure, and its rotation speed (Kinman et al., 2004). Nevertheless, there are still many ambiguities not only in the main halo constituents, but also in the basic properties such as, in particular, in rotation.
The degree to which galactic halos rotate with respect to the disks is difficult to investigate; actually, as stated in the most recent study of M31 (Courteau et al., 2010), testing for the rotation of M31’s halo is still beyond our reach. Naturally, the importance of understanding the galactic halos is closely related to the nature and distribution of the dark matter, which is relevant for the formation and dynamics of galaxies. In this respect, the methodology adopted in the present paper of using WMAP data to probe both the disk and the halo of M31, even if with the limitation of the presently available data, may suggest a novel way of approaching this problem.
2 The 7-year WMAP analysis
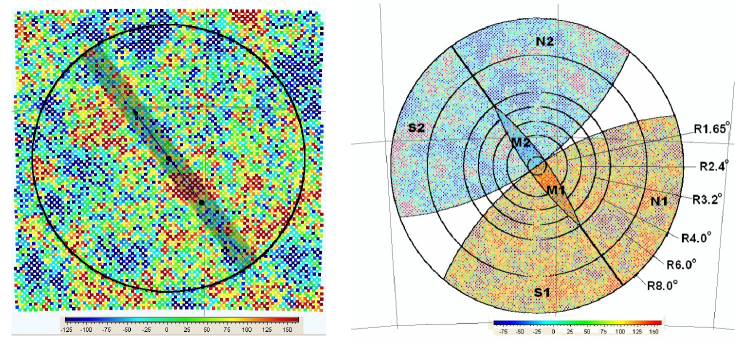
In our analysis we use the seven-year WMAP data (Jarosik et al., 2011) in the three bands W (94 GHz), V (61 GHz), and Q (41 GHz). Using three WMAP bands is important in revealing the possible contribution of the Galactic foregrounds since dust, free-free, and synchrotron emission contributes differently in each band. Here we remind the reader that the band least contaminated by the synchrotron radiation of the Galaxy is the W-band, which also has the highest angular resolution. The CMB map’s general structure in the W-band in the region of M31, with the marked radius circle (although our analysis extends farther out), is shown in Fig. 1 (left panel). In our analysis, we also used the maps provided by the WMAP Collaboration with the Galactic disk contribution modeled and removed (Gold et al., 2011). It is always specified in the text when we considered these data. To reveal the different contributions by the M31 disk and halo, the region of the sky around the M31 galaxy was divided into several concentric circular areas as shown in Fig. 1 (right panel). In the optical band the total extent of the M31 galaxy along the major axis is slightly more than about and along the minor axis is about . Radio observations have shown that the M31 HI disk is more extended with respect to the stellar disk (Chemin et al., 2009; Corbelli et al., 2010), with a major axis sizes of about and a minor axis size of about . In this paper, the adopted M1 and M2 disk regions (Fig. 1, right panel) have major axis size of and minor axis size of ; this allows us to retain the warped part of the M31 disk in the M1 and M2 regions. Moreover, we have checked that it is irrelevant, as far as our analysis is concerned, to extend the M31 minor axis to . The mean temperature excess per pixel , in K/pixel, in each region was obtained in each band and is shown in Table 1 with the error 111The standard error of the mean is calculated as the standard deviation of the excess temperature distribution divided by the square root of the pixel number in each region. We have verified that, within the errors, the sigma values calculated in that way are consistent with those evaluated by using the covariance matrix obtained by a best-fitting procedure with a Gaussian to the same distribution., along with the number of pixels in each area. For convenience, Table 1 gives the temperature excess in each M31 region up to , even if our analysis was extended to the region around the M31 disk with concentric annuli with radii up to .
| R, deg, kpc | Region | N, pix | W, | V, | Q, |
|---|---|---|---|---|---|
| 1.65, 21.4 | N1 + M1 + S1 | 324 | |||
| N2 + M2 + S2 | 321 | ||||
| N1 + S1 | 205 | 45.5 5.7 | 38.0 5.3 | 64.1 4.0 | |
| N2 + S2 | 205 | 33.8 5.9 | 34.3 5.3 | 41.8 4.1 | |
| M1 | 119 | ||||
| M2 | 116 | ||||
| 2.40, 31.1 | N1 + M1 + S1 | 670 | |||
| N2 + M2 + S2 | 664 | ||||
| N1 + S1 | 506 | 41.0 3.5 | 32.2 3.1 | 55.6 2.6 | |
| N2 + S2 | 504 | 24.5 4.3 | 23.6 3.9 | 34.8 3.3 | |
| M1 | 164 | ||||
| M2 | 160 | ||||
| 3.20, 41.5 | N1 + M1 + S1 | 1176 | |||
| N2 + M2 + S2 | 1166 | ||||
| N1 + S1 | 980 | 35.3 2.7 | 34.0 2.3 | 53.9 2.1 | |
| N2 + S2 | 976 | 16.4 3.0 | 11.5 2.8 | 27.7 2.4 | |
| M1 | 196 | ||||
| M2 | 190 | ||||
| 4.00, 51.9 | N1 + M1 + S1 | 1818 | |||
| N2 + M2 + S2 | 1808 | ||||
| N1 + S1 | 1610 | 36.8 2.2 | 36.9 1.9 | 53.3 1.7 | |
| N2 + S2 | 1609 | 0.4 2.5 | 3.8 2.2 | 13.5 1.9 | |
| M1 | 208 | ||||
| M2 | 200 | ||||
| 6.00, 77.8 | N1 + S1 | 3748 | 29.7 1.5 | 27.0 1.4 | 44.0 1.2 |
| N2 + S2 | 3749 | 11.3 1.7 | 7.1 1.5 | 25.8 1.3 | |
| 8.00, 103.8 | N1 + S1 | 6606 | 34.3 1.2 | 34.7 1.1 | 51.5 4.0 |
| N2 + S2 | 6600 | 19.2 1.3 | 15.0 1.2 | 38.7 1.0 |
3 Results for the M31 disk
For the M31 disk, our analysis shows that each M1 region is always hotter than the corresponding M2 region, as can be seen from Table 1. Indeed we find a temperature excess contrast (i.e. the difference between the temperature excesses per pixel) between the M1 and M2 regions in all three WMAP bands that turns out to be about K/pixel within 21.4 kpc (in the W band) and then slightly decreases (but remains as large as about K/pixel at about 50 kpc). This effect seems to come from the rotation induced Doppler shift of the gas and dust emission from the M31 disk - indeed, the hotter (M1) region corresponds to the side of the M31 disk that rotates towards us. 333A detailed study of the frequency dependent temperature asymmetry in the CMB arising from different distributions of gas and dust in the M31 disk is left to a forthcoming paper. In any case, although some inhomogeneity in the disk structure is not excluded, there is no reason to assume that it is the sole cause. If one compares what WMAP data show towards the M1 and M2 regions with the maps of the M31 thick HI disk obtained at 21 cm (Chemin et al., 2009; Corbelli et al., 2010) one sees a remarkable superposition of the hot (M1) and cold (M2) regions in both observations.
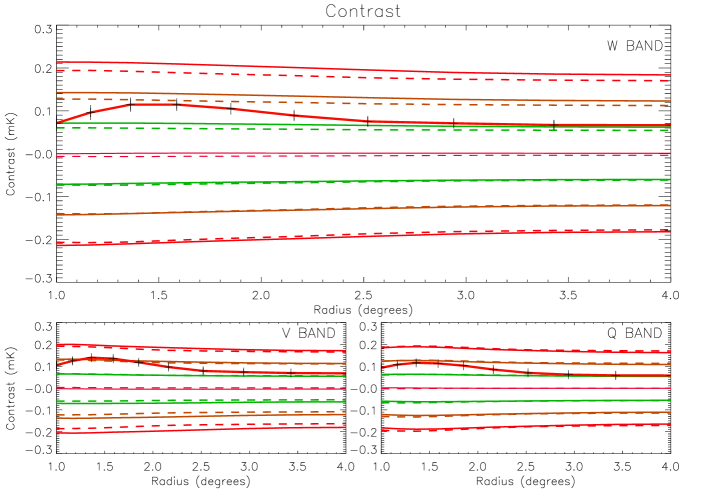
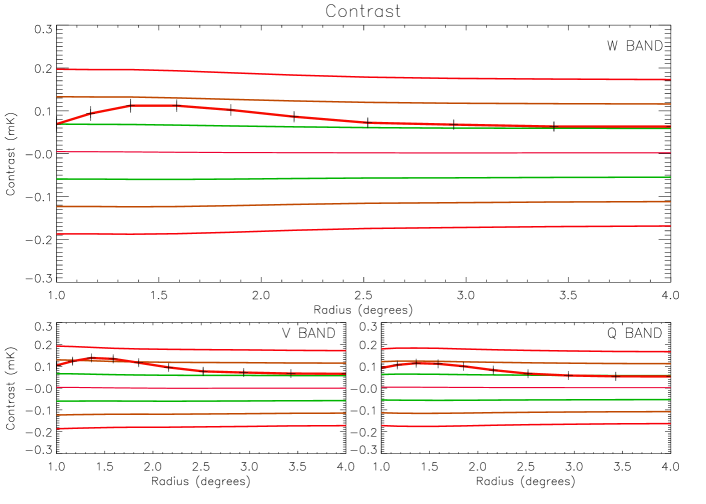
Even if the temperature asymmetry between the M1 and the M2 regions looks significant, we have to check whether it might be due to a random fluctuation of the CMB signal. It is indeed well known that the CMB sky map has a “patchy” structure characterized by the presence of many hot and cold spots with temperature excesses up to several tents of K/pixel on angular degree scales. We therefore considered (Fig. 2 and also the online material) 500 control fields and 500 simulated sky maps (from the best-fitted cosmological parameters as provided in the WMAP web site) 444CMB maps were simulated by assuming , where is a realization of the Gaussian CMB field, is the pixel noise and is the proper beam of the experiment. We made 500 realizations of the CMB sky using synfast routine of HEALPix with the best-fit power spectrum as given by the WMAP Collaboration. The maps are then convolved with WMAP beams for W, V, and Q bands, respectively. Noise realizations (simulated with mK, mK, and mK for W, V, and Q-bands, respectively) are added to the beam convolved maps in the end. - and evaluated the temperature contrast with the same geometry as was used towards M31. We also give (red curve) the M31 temperature contrast profile in the M31 disk. Due to our chosen geometry, each curve is given up to . As one can see, the contrast temperature profile for the M31 disk is always a nicely smooth curve that is close to the curve in the intermediate region of about . Both the control field and the CMB simulation analyses show that there is a probability of less than about that the temperature asymmetry revealed comes from a random fluctuation of the CMB signal. Actually, if one takes the direction of rotation of the M31 disk into account, such a probability reduces (by using the theorem of the composite probability) by a factor of two. Finally, we mention that we have found that the temperature excess contrast of the two M31 disk regions obtained by dividing the M1+M2 region with respect to the north-west/south-east symmetry axis (the M31 disk axis) turns out to be mK, which seems to further confirm that the temperature contrast between the M1 and M2 regions is not due to a random fluctuation in the CMB signal.
4 Results for the M31 halo
The next step was to enlarge our analysis to the region around the M31 disk by considering concentric circular regions of increasing galactocentric radii (see also Fig. 1, right panel). We estimated the difference of the temperature excess in the region N1+S1 in the three WMAP bands with respect to that in the region N2+S2. A temperature contrast between the region N1+S1 with respect to N2+S2 shows up (see Table 1), and the N1+S1 region turns out to always be hotter than the N2+S2 region. The detected effect resembles the one towards the M31 disk, although with less temperature asymmetry. In all three bands, the maximum temperature contrast reaches a maximum at a galactocentric distance of about and then decreases slightly. It is apparent from the size of the considered regions that a contamination of the M31 disk in the regions N1, N2, S1, and S2 can be completely excluded, and also the Galactic plane emission cannot account for the observed temperature asymmetry since it eventually would make a larger contribution towards the upper regions of M31 (while the opposite is observed in the data). As for the M31 disk, the temperature asymmetry in the M31 halo is indicative of a Doppler shift modulated effect possibly induced by the rotation of the M31 halo.
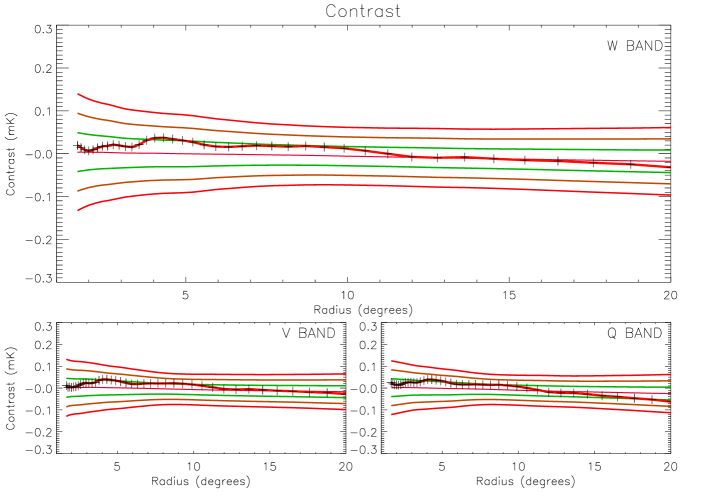
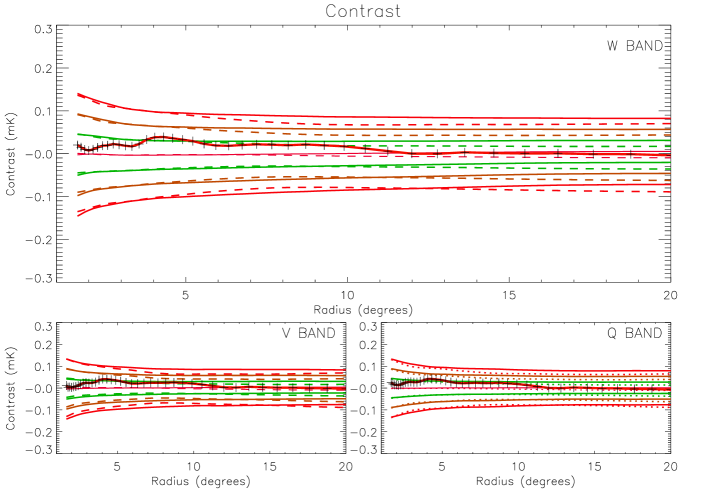
Also in this case we need to check the robustness of our results; that is, we have to estimate the probability that the temperature asymmetry in the M31 halo is due to a random fluctuation of the CMB signal. In Fig. 3 (see also the online material) we have considered 500 control fields and 500 simulated sky maps (from the best-fitted cosmological parameters as provided on the WMAP website). As one can see, in all three bands, the contrast temperature profile of the M31 halo is close to the curve up to about and goes slightly beyond it at about kpc where the halo effect is maximum. This means that there is less than probability that the temperature contrast we see towards the M31 halo is due to a random fluctuation of the CMB signal.
We also point out that we have verified that the temperature asymmetry towards the M31 halo vanishes if the adopted geometry is rigidly rotated of an angle larger than about with respect to the M31 major axis, thus giving a further indication that the halo temperature contrast effect might be genuine and not simply a random fluctuation of the CMB.
We also point out that the use of three WMAP bands is useful for revealing the role of the contribution to the Galactic foregrounds since each emission mechanism contributes differently in each band. That the temperature contrast seems present in all three bands and is more or less the same in each band up to about indicates that the foregrounds are far weaker than the effect. This size corresponds to the typical size inferred for the dark matter halos around massive galaxies and might open the possibility of a new way of studying these systems, galactic disks, and halos, by using the microwave band. In any case, a careful analysis of the Planck data that will be released shortly should allow either proving or disproving our results.
5 Discussion and conclusions
We have shown that a temperature asymmetry in all WMAP bands may exist both in the M31 disk and halo in the direction of the M31 spin. For the M31 disk, the effect is fairly clear, and there is a probability below about that it is a random fluctuation of the CMB signal. If real, the detected temperature excess asymmetry should be due to the foreground emission of the M31 disk modulated by the Doppler shift of the disk spin. That the present study is really timely is strengthened by considering that the M31 galaxy is already detected by the Planck observatory (Ade, 2011) 555However, there is no mention of any temperature asymmetry in the M31 disk in that paper., whereas it did not appear in the WMAP list. These are all reasons to expect that the particular effect we discuss here can be studied more accurately with Planck data.
As for the M31 halo, we have shown that, although less evident than for the M31 disk, there is some evidence of a temperature asymmetry between the N1+S1 and the N2+S2 regions that resembles that of a Doppler shift effect induced by the M31 halo rotation. We have shown in the previous section that there is less than about probability that the detected temperature asymmetry at a galactocentric distance kpc comes from a random fluctuation of the CMB signal. 666We also mention that the number and the temperature profile of radio sources in CMB maps (Gurzadyan et al., 2010) excludes their significant contribution in the effect under study.
If one assumes that this temperature asymmetry in the M31 halo relies in the M31 itself and is related to the M31 halo rotation, one could speculate about the origin of this effect. In general, four possibilities may be considered: (a) free-free emission, (b) synchrotron emission, (c) Sunyaev-Zel’dovich (SZ) effect, and (d) cold gas clouds populating the M31 halo 777We also considered the possible influence of the observed high-velocity clouds, either in the M31 or in our galaxy halos (Westmeier et al., 2008; Hulsbosch & Wakker, 1988; Morras et al., 2000), by removing the pixels in the direction of each cloud from the analysis. The results obtained do not change with respect to those presented here, as expected when also considering the relatively low number of pixels involved. Also the proposed ejecta by the past interaction of M33 and M31 galaxies (Bekki, 2008) cannot play any role in our analysis since it would at most have made hotter some pixels in the S2 region (where the M31-M33 bridge is located), which is instead colder than the S1 one.. To work, the first three effects, assume the presence of a rather hot plasma in the halo of M31. Although this hot plasma has not been detected yet, one can assume that a certain amount of this plasma can populate the M31 halo (spiral galaxies are believed to have much less hot gas than ellipticals) and may rotate with a certain speed. Free-free emission arises from electron-ion scattering while synchrotron emission comes mostly from the acceleration of cosmic-ray electrons in magnetic fields. Both effects give rise to a thermal emission with a rather steep dependence on the frequency (Bennett et al., 2003) that therefore should give a rather different temperature contrast in the three WMAP bands. The absence of this effect indicates that the contribution from possibilities (a) and (b) should be negligible. And for (c), even for typical galaxy clusters with diffuse gas much hotter than that possibly expected in the M31 halo, the rotational scattering effect would produce a temperature asymmetry of at most a few K/pixel, depending on the rotational velocity and the inclination angle of the rotation axis (Cooray & Chen, 2002). Actually, a possible temperature asymmetry in the CMB data towards the M31 halo as a consequence of the existence of a population of cold gas clouds in its halo was predicted in (De Paolis et al., 1995a) - possibility (d). Indeed, if the halo of the M31 galaxy contains cold gas clouds, we expect them to rotate like the M31 disk (even if, perhaps, more slowly), and thus there should be a Doppler shift inducing a temperature anisotropy between one side of the M31 halo and the other with respect to the rotation axis perpendicular to the disk. In the case of optically thin halo clouds, the Doppler induced temperature anisotropy would be , where is the M31 rotation speed, the averaged cloud optical depth over the frequency range () of a certain detection band, and the cloud filling factor, i.e. the ratio of filled (by clouds) to total projected surface in a given field of view. We emphasize that the fact that the temperature contrast in Fig. 3 looks approximately the same in each band makes a point towards either possibility (d) or a random fluctuation of the CMB sky (but with a probability, if estimated purely statistically, of less of for the last possibility).
The wealth of data especially in the last decade shows that there is good evidence for the presence in the halos of spiral galaxies of gas in all gaseous phases: neutral, warm atomic, and hot X-ray emitting gas (Bregman, 2009). Atomic gas (often identified as HVCs) is observed in the radio band (particularly at 21 cm) and through absorption lines towards field stars and quasars. The hot gas may be detected in X-rays, while searches for cold gas clouds in galactic halos are more problematic as are searches for them by the presence of a gamma-ray halo (Dixon et al., 1998; De Paolis et al., 1999), stellar scintillations (Moniez, 2003; Habibi et al., 2010), obscuration events towards the LMC (Drake & Cook, 2003), ortho- line at 372 GHz (Ceccarelli & Dominik, 2006), and extreme scattering events in quasar radio-flux variations (Walker & Wardle, 1998) have given no clear indication of their presence.
In conclusion, we showed that our analysis based on seven-year WMAP data suggests there is a temperature excess asymmetry in the M31 disk is likely due to the M31 foreground emission modulated by the Doppler shift induced by the M31 spin. We find that there is less than probability that the signal up to about 20 kpc comes from a random fluctuation in the CMB signal. For the M31 halo, we also find a temperature excess asymmetry between the N1+S1 and the N2+S2 regions along the expected spin direction, suggestive of a rotation induced Doppler shift. The effect in the M31 halo is far weaker than for the disk, as obviously expected, and more precise data are necessary before drawing any firm conclusion. In all cases, this research may open a new window into the study of galactic disks and especially the rotation of galactic halos by using the Planck satellite or planned balloon-based experiments.
Acknowledgements.
We acknowledge the use of the Legacy Archive for Microwave Background Data Analysis (LAMBDA). Support for LAMBDA is provided by the NASA Office of Space Science. Some of the results in this paper were derived using the HEALPix (Górski et al., 2005) package. PJ acknowledges support from the Swiss National Science Foundation. An anonymous referee is also acknowledged.References
- Ade (2011) Ade, P.A.R. et al. (Planck Collaboration) 2011, arxiv:1101.2045v1
- Bekki (2008) Bekki, K. 2008, MNRAS, 390, L24
- Bennett et al. (2003) Bennett, C. L. et al. 2003, ApJ, 148, 97
- Bregman (2009) Bregman, J. N. 2009, arxiv:0907.3494v1
- Binney (1998) Binney, J. & Merrifield, M. Galactic Astronomy, Princeton Series in Astrophysics (1998)
- Ceccarelli & Dominik (2006) Ceccarelli, C. & Dominik, C. 2006, ApJ, 640, L131
- Chemin et al. (2009) Chemin, L., Carignan, C. & Foster, T. 2009, ApJ, 705, 1395
- Cooray & Chen (2002) Cooray, A. & Chen, X. 2002 ApJ, 573, 43
- Corbelli et al. (2010) Corbelli, E. et al. 2010, A&A, 511, A89
- Courteau et al. (2010) Courteau, S. et al. 2011, ApJ, 739, 20
- De Paolis et al. (1995a) De Paolis, F. et al. 1995a, A&A, 299, 647
- De Paolis et al. (1999) De Paolis, F. et al. 1999, ApJL, 510, L103
- Dixon et al. ( 1998) Dixon, D. D. et al. 1998, New Astronomy, 3, 539
- Drake & Cook (2003) Drake, A. J. & Cook, K. H. 2003, ApJ, 589, 281
- Gold et al. (2011) Gold, B. et al. 2011, ApJS, 192, 15
- Górski et al. (2005) Górski, K. M. et al. 2005, ApJ, 622, 759
- Gurzadyan et al. (2010) Gurzadyan, V.G. et al. 2010, Europhys. Lett., 91, 19001
- Habibi et al. (2010) Habibi, F. et al. 2011, A&A, 525, 108
- Hulsbosch & Wakker (1988) Hulsbosch, A. N. M. & Wakker, B. P. 1998, A&AS, 75, 191
- Jarosik et al. (2011) Jarosik, N. et al. 2011, ApJS, 192, 14
- Kinman et al. (2004) Kinman, T. D. et al. 2004, Memorie della Soc. Astr. Ital., 75, 36
- Moniez (2003) Moniez, M. 2003, A&A, 412, 105
- Morras et al. (2000) Morras, R. et al. 2000, A&AS 142, 25
- Vilardell et al. (2010) Vilardell, F. et al. 2010, A&A, 509, 70
- Westmeier et al. (2008) Westmeier, T., Brüns C. & Kerp, J. 2008, MNRAS, 390, 1691
- Walker & Wardle (1998) Walker, M. & Wardle, M. 1998, ApJL, 498, L125