INAF-Istituto di Astrofisica Spaziale e Fisica cosmica di Bologna, via Gobetti 101, I-40129, Bologna, Italy
Department of Astronomy and Astrophysics, the Pennsylvania State University, 525 Davey Lab, University Park, PA 166802, USA
Department of Physics and Astronomy, College of Charleston, Charleston, SC 29424, USA
Center for Gravitational Wave Physics, the Pennsylvania State University, University Park, PA 166802, USA
School of Physics and Astronomy, University of Southampton, Highfield, Southampton, SO17 1BJ, UK
Department of Physics and Astronomy, University of Nevada Las Vegas, 4505 Maryland Pkwy Las Vegas, NV 891541-4002, USA
X-ray Astrophysics Laboratory, NASA/Goddard Space Flight Center, Greenbelt, MD 20771, USA
Department of Astronomy and CRESST, University of Maryland, College Park, MD 20742, USA
INAF-Osservatorio Astronomico di Bologna, via Ranzani 1, I-40127, Bologna, Italy
Variable X-ray absorption in the mini-BAL QSO PG 1126-041††thanks: Based on observations obtained with XMM-Newton, an ESA science mission with instruments and contributions directly funded by ESA Member States and NASA.
Abstract
Context. X-ray studies of active galactic nuclei (AGN) with powerful nuclear winds are important for constraining the physics of the inner accretion/ejection flow around supermassive black holes (SMBHs) and for understanding the impact of such winds on the AGN environment.
Aims. Our main scientific goal is to constrain the properties of the circum-nuclear matter close to the SMBH in the mini-broad absorption line quasar (mini-BAL QSO) PG 1126-041 using a multi-epoch observational campaign with XMM-Newton.
Methods. We performed temporally resolved X-ray spectroscopy and simultaneous UV and X-ray photometry on the most complete set of observations and on the deepest X-ray exposure of a mini-BAL QSO ever.
Results. We found complex X-ray spectral variability on time scales of both months and hours, which is best reproduced by means of variable massive ionized absorbers along the line of sight. As a consequence, the observed optical-to-X-ray spectral index is found to be variable with time. In the highest signal-to-noise observation we detected highly ionized X-ray absorbing material outflowing much faster ( km s-1) than the UV absorbing one ( km s-1). This highly ionized absorber is found to be variable on very short (a few kiloseconds) time scales.
Conclusions. Our findings are qualitatively consistent with line-driven accretion disk winds scenarios. Our observations have opened the time-resolved X-ray spectral analysis field for mini-BAL QSOs. Only with future deep studies will we be able to map the dynamics of the inner flow and understand the physics of AGN winds and their impact on the environment.
Key Words.:
Accretion, accretion disks - Methods: data analysis - Techniques: spectroscopic, photometric - Galaxies: quasars: individual: PG 1126-041 - X-rays: individuals: PG 1126-0411 Introduction
The structure of the inner regions (sub-parsec scale) of active galactic nuclei (AGN), as probed by UV and X-ray observations, seems to be very complex, and certainly it is still not understood well. The optical/UV continuum emission is most probably due to the thermal emission from an optically thick, geometrically thin accretion disk (Shakura & Sunyaev 1973). The disk surrounds the central supermassive black hole (SMBH), spanning radii from a few up to several hundreds of gravitational radii (), i.e. possibly from the innermost stable circular orbit around the SMBH up to the disk self-fragmentation radius (e.g., Pringle 1981). The origin of the X-ray continuum emission is less clearly understood and is thought to be the result of the Comptonization of accretion disk UV seed photons into a “cloud” of very hot electrons, the so-called X-ray corona (Haardt & Maraschi 1991; Haardt et al. 1994). What is clear both from variability and microlensing studies is that the X-ray emission region is much smaller than the UV one, and it spans only a few up to tens of gravitational radii (e.g., Morgan et al. 2008; Chartas et al. 2009b; Dai et al. 2010). An extensive X-ray monitoring of the inner regions of the nearby Seyfert 1.8 NGC 1365 has made it possible to constrain the size of the X-ray emitting region to again be a few , using a totally independent technique (Risaliti et al. 2009b). The UV and X-ray continuum photons are observed to be reprocessed (absorbed, re-emitted, scattered, reflected) by gas and dust in the inner regions of AGN, so that we almost never observe just the primary continuum emission of these objects (see e.g. the comprehensive analysis of Risaliti et al. 2005b, a, 2007, 2009a, again on NGC 1365). Conversely, observing the reprocessing features in the UV and X-ray bands can put strong contraints on the geometry, the physical characteristics, and the dynamics of the gas hosted in the inner regions of AGN. In the past few decades, spectroscopy in the UV and X-ray band have revealed the presence of substantial column densities of ionized gas flowing out from the inner regions of AGN.
In the UV band we observe blueshifted spectral absorption lines due to resonant transitions of ionized metals such as Mg II, Al III, Si IV, C IV, N V, O VI. Depending on the width of the absorption troughs, quasars hosting such features are classified as broad absorption line quasars (BAL QSOs, FWHM km s-1, e.g. Turnshek et al. 1980; Weymann et al. 1991; Reichard et al. 2003), mini-broad absorption line quasars (mini-BAL QSOs, km s FWHM km s-1), and narrow absorption line quasars (NAL QSOs, FWHM km s-1; see Ganguly et al. 2001; Hamann & Sabra 2004). BALs features are observed in of optically selected QSOs (e.g., Hewett & Foltz 2003; Reichard et al. 2003; Knigge et al. 2008; Allen et al. 2011). Mini-BALs and NALs are together observed in of optically selected QSOs (Ganguly & Brotherton 2008). Despite the very different absorption trough widths observed, BAL, mini-BAL, and NAL QSOs share the same velocity ranges, reaching UV terminal velocities from a few 102 km s-1 up to several 104 km s-1 (e.g., Rodriguez Hidalgo et al. 2007; Misawa et al. 2007a; Gibson et al. 2009b). Furthermore, is known to correlate with the continuum luminosity (Laor & Brandt 2002; Ganguly & Brotherton 2008), meaning that the highest terminal velocities are observed in the objects with the highest UV continuum luminosity, suggesting an important role of the AGN UV radiation pressure in the acceleration of such winds.
In the X-ray band absorption due to ionized species, such as N VI-VII, O VII-VIII, Mg XI-XII, Al XII-XIII, Si XIII-XVI, as well as L-shell transitions of Fe XVII-XXIV, are observed to be blueshifted by a few hundred to a few thousand km s-1 in of type 1 AGN (the “warm absorber”, e.g. Reynolds 1997; Piconcelli et al. 2005; McKernan et al. 2007). Moreover, in recent years, thanks to the high collecting area of X-ray satellites such as XMM-Newton, Chandra, and Suzaku, blueshifted absorption lines due to highly ionized gas (i.e. Fe XXV, Fe XXVI) outflowing at much higher velocity (0.05-0.2) have been observed in a number of AGN, at both low and high redshift (see e.g. Pounds et al. 2003; Cappi 2006; Tombesi et al. 2010a, b, and references therein). In particular, X-ray BALs in He-like iron, blueshifted up to , have been observed in gravitationally lensed BAL and mini-BAL QSOs (Chartas et al. 2002, 2003, 2009c).
Theoretically, powerful winds can be launched from AGN accretion disk either by thermal, magnetic, or radiative pressure. In either case, a wind will be launched only if the pressure overcomes the SMBH gravity pull. As a rule of thumb, the closer to the SMBH the launching point is, the higher the wind terminal velocity. (see e.g. Königl 2006; Everett 2007; Proga 2007, for a review). Observations of the wind outflow velocity are then crucial in order to constrain the launching radius, and hence the physical driving mechanism. The thermal mechanism can account for low-velocity outflows arising at large radii (e.g. the X-ray warm absorber, Chelouche & Netzer 2005). Instead, in order to explain the extreme velocities observed in the other absorbers, either magnetic or radiation pressure must be invoked. For instance, line driven accretion disk wind models show that at high accretion rates, the UV radiation pressure from the disk can be high enough to launch powerful winds from distances of a few tens of . In the inner part of this flow, high column densities of X-ray absorbing gas shield the wind from the strong X-ray continuum source, preventing it from becoming overionized (Murray et al. 1995; Proga et al. 2000; Proga & Kallman 2004). Thus, the geometry and the dynamics of such winds depend critically on the UV/X-ray flux ratio and on the AGN accretion rate. On the other hand, for the launch and acceleration of magnetically driven disk winds, there is no need for X-ray shielding, and the accretion rate is not a critical parameter; however, the ionization state of the gas, which is a critical parameter, will still depend on them (e.g., Konigl & Kartje 1994; Everett 2005).
BAL and mini-BAL QSOs are actually known to be “X-ray weak” with respect to the average QSOs. A comparison of the X-ray fluxes of BAL and non-BAL QSOs with the same UV flux indicates that BAL QSOs typically have X-ray fluxes that are to times lower than those of non-BAL QSOs (Green et al. 1995; Laor et al. 1997). A number of studies (e.g. Brandt et al. 2000; Green et al. 2001; Gallagher et al. 2006) strongly support absorption as the reason for the X-ray weakness. Recently a number of “X-ray bright” BAL and mini-BAL QSOs have been discovered, with the latter class X-ray brighter and less X-ray absorbed than the former (Giustini et al. 2008; Gibson et al. 2009a). The NAL QSOs have been shown to be generally unabsorbed in X-rays, and “X-ray brighter” than both mini-BAL and BAL QSOs (Chartas et al. 2009a).
The physical link between the UV and X-ray outflowing absorbers and the dynamical behavior of the wind are far from being understood. Reported estimates of the distances of the absorbers from the central SMBH range from the inner regions of the accretion disk (e.g., Chartas et al. 2009c) to the parsec-scale torus (e.g., Blustin et al. 2005) to the kiloparsec scales (e.g., Dunn et al. 2010). Currently the uncertainties of the launching radii are relatively large, which translates to a high uncertainty on the mass outflow rate and on the kinetic energy injection associated with such winds. It could also be that the launching radii depend on the mass of the SMBH. Constraining the physical mechanism responsible for launching and accelerating AGN winds, i.e. understanding the link between the accretion and ejection processes in AGN, can help not only in understanding the evolution of these sources, but also in quantifying their impact on the surrounding environment, i.e. the amount of feedback (see e.g. Di Matteo et al. 2005; Scannapieco et al. 2005; Elvis 2006).
In this article we present the results of an XMM-Newton observational campaign on the mini-BAL QSO PG 1126-041, which provides both the largest dataset (four pointings) and the deepest X-ray exposure (130 ks) on a mini-BAL QSO to date. The source is extremey interesting for showing all three absorbers discussed above: mini-BALs in the UV, an X-ray warm absorber, and a highly ionized, high-velocity X-ray outflow. Constraining the X-ray/UV properties of this source can give precious insight into the physics of AGN winds.
The structure of the article is as follows. Section 2 summarizes the source properties known from the literature. Section 3 reports on the new XMM-Newton observations and data reduction. EPIC pn timing analysis results are first presented in Section 4. EPIC pn and MOS spectral analysis is then presented in Sections 5 (average spectra of each epoch) and 6 (time-resolved 2009 Long Look pn spectra). Section 7 contains the results of simultaneous optical/X-ray photometric analysis. Results are discussed in Section 8 and conclusions presented in Section 9.
A cosmology with km s Mpc-1, and (Komatsu et al. 2011) is used throughout the paper.
2 PG 1126-041
PG 1126-041 (a.k.a. Mrk 1298) is a nearby (), radio-quiet AGN with a luminosity in between those that are typical of Seyferts and QSOs (, , Schmidt & Green 1983; Sanders et al. 1989; Surace et al. 2001). Its optical strong Fe II and weak [O III] line emission (Boroson & Green 1992) are characteristics of narrow line Seyfert 1 galaxies (NLS1), although the FWHM of its H line of 2150 km s-1 is slightly more than the 2000 km s-1 value used in defining NLS1s (Shuder & Osterbrock 1981). Its black hole mass is estimated to be using the continuum luminosity density and the FWHM(H) measured from a single-epoch optical spectrum and the empirical relations reported by Vestergaard & Peterson (2006). However, the stellar velocity dispersion in the host galaxy of PG 1126-041 measured from the stellar CO absorption line width in the VLT H-band spectra gives a slightly higher black hole mass of (Dasyra et al. 2007).
PG 1126-041 is also classified as “soft X-ray weak”111Soft X-ray weak sources are those being characterized by an observed optical-to-X-ray spectral index , see Section 7. by Brandt et al. (2000), who measured an based on ROSAT X-ray observations and on the optical flux density as given by Neugebauer et al. (1987). Tananbaum et al. (1986) measured an referring to an earlier Einstein X-ray observation and the rest frame flux density as given by Schmidt & Green (1983). Neither of these measurements were based on simultaneous X-ray and optical/UV observations. Wang et al. (1999) report on the IUE and ROSAT observations of PG 1126-041. The 1992 IUE observation shows a high-velocity UV absorbing outflow as mini-BALs in the C IV, N V, and Si IV ions blueshifted up to km s-1. The simultaneous ROSAT pointing revealed a 0.2-2 keV spectrum best-fitted by a steep powerlaw emission with , absorbed by a column density cm-2 of ionized gas, erg cm s-1. A subsequent IUE spectrum taken in 1995 showed a continuum that was brighter by a factor of two and weaker absorption lines. Komossa & Meerschweinchen (2000) confirm the detection of ionized absorption in the 1992 ROSAT spectrum and also suggest X-ray temporal variability on timescales as short as 800 s. The main properties of PG 1126-041 are summarized in Table 1.
| RA | 11h 29m 16.6s | (a) |
| DEC | -04h 24m 08s | (a) |
| 0.062 | (a) | |
| 284 Mpc | ||
| cm-2 | (b) | |
| 0.055 mag | (c) | |
| (d-e) | ||
| mB | 14.92 mag | (a) |
| (f) | ||
| erg s-1 | (h) | |
| 5000 km s-1 | (g) | |
| 16500 km s-1 | (h) |
3 Observations and initial data reduction
| OBSID | Date | Duration | Exposure | Mode | Filter | Count-rate | Epoch | |
|---|---|---|---|---|---|---|---|---|
| M1 / M2 / pn | MOS / pn | pn | ||||||
| [ks] | [ks] | [0.1 ct s-1] | [erg cm-2 s-1] | |||||
| (1) | (2) | (3) | (4) | (5) | (6) | (7) | (8) | (9) |
| 0202060201 | 12/31/2004 | 33.8 | 32.9 / 32.9 / 28.3 | LW | t | 0.61 / 2.01 | -11.88 | Dec. 2004 |
| 0556230701 | 06/15/2008 | 31.4 | 3.7 / 3.5 / 3.2 | FF | m | 0.91 / 3.01 | -11.70 | Jun. 2008 |
| 0556231201 | 12/13/2008 | 11.9 | 4.9 / 4.7 / 3.7 | FF | m | 1.68 / 5.93 | -11.52 | Dec. 2008 |
| 0606150101 | 06/21/2009 | 134.3 | 85.4 / 89.2 / 91.2 | FF | m | 0.57 / 1.96 | -11.93 | 2009 Long Look |
XMM-Newton observed PG 1126-041 four times, once in 2004 December, twice in 2008 June and December, and once more in 2009 June. In Table 2 we list the main parameters of each dataset. We reduced all the datasets using the XMM-Newton SAS v.10.0.0 and calibration files generated in August 2010. For each dataset we extracted the light curve from the whole field of view of events with energies greater than 10 keV for each European Photon Imaging Camera (EPIC) MOS cameras, and with energies 10 keV 12 keV for the EPIC-pn instrument. We then filtered out the time periods in which there was significant background flaring. Source counts from the cleaned event files were extracted from circular regions centered on the PG 1126-041 position, with 30–45” radii, depending on the signal-to-noise ratio (S/N) as determined with the eregionanalyse task. Background counts were extracted from circular regions of the same area as the source ones. We retained up to double events (flagged as ) for the pn dataset and quadruple events (flagged as ) for the MOS datasets. For each dataset we generated the ancillary response file and the redistribution matrix file at the source position using the tasks arfgen and rmfgen. Source light curves were created in different energy bands and corrected with the epiclccorr task for both the local background and the mirrors/detector inefficiencies. Due to the low X-ray fluxes involved, pile-up effects are negligible in our spectral analysis. For the same reason we cannot make use of the reflection grating spectrometer (RGS) aboard XMM-Newton. Optical monitor (OM) data were all taken in Image mode and were processed using the standard procedure as suggested by the XMM-Newton SOC.
4 Timing analysis
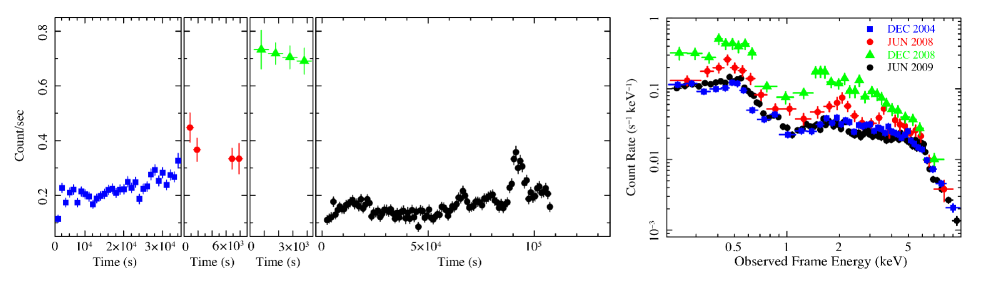
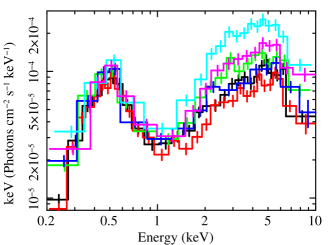
The lefthand panel of Fig. 1 shows the background-subtracted 0.2-10 keV pn light curves of PG 1126-041 for each epoch of observation, binned to 1 ks. Compared to the light travel time , the time bin corresponds to for the two different estimates for the black hole mass of PG 1126-041. The variations on month timescales are dramatic: the source flux increases by a factor of from December 2004 to December 2008, then comes back to a low count-rate regime in June 2009. For comparison, the average 0.2-10 keV pn spectra of each epoch of observation are shown in the righthand panel of Fig. 1. Most of the spectral variability on month time scales occurs at energies keV. The spectral shape is peculiar and obviously deviates from a simple power-law. A prominent broad absorption feature is evident in all the spectra around 0.6-1.5 keV.
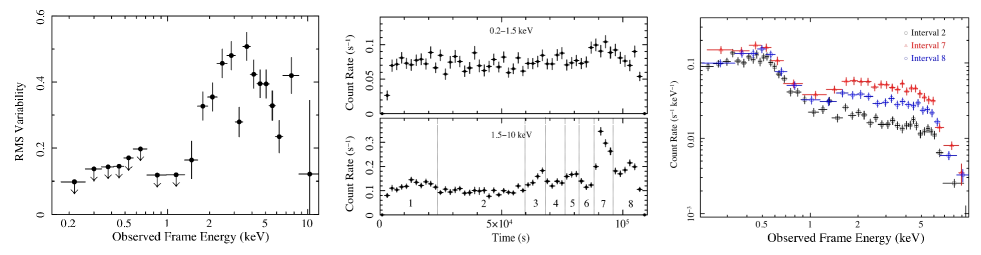
The high S/N ratio and the long contiguous good exposure time allowed us to perform a more detailed timing analysis on the 2009 Long Look pn exposure. Figure 2 summarizes the results. The lefthand panel shows the root mean square variability (RMS; Vaughan et al. 2003; Ponti et al. 2004) computed on the 0.2-10 keV band: on very short time scales (ks), the source flux varies up to 50% at energies keV, while it is constant at lower energies. The middle panel shows the background-subtracted lightcurves extracted in the 0.2-1.5 and 1.5-10 keV bands; following the 1.5-10 keV band flux fluctuations, we split the exposure in eight time intervals on which we perform temporally resolved spectral analysis. Three representative spectra extracted during the 2nd, the 7th, and the 8th time intervals are shown in the righthand panel, and most of the spectral variability on ks time scales occurs at keV keV.
From the timing analysis, it follows that the X-ray spectra of PG 1126-041 can be divided into two spectral components: one dominates at keV and contributes 100% to the ks time scale variability, while the other one dominates at lower energies and is significantly variable only on longer (month) time scales. With these considerations in mind, we proceed with the analysis of both the average (Sect. 5) and the time-resolved (Sect. 6) spectra.
5 Spectral analysis: the average spectra
In our spectral analysis we used the Xspec v.12.6.0 software. All the spectra were grouped to a minimum number of 20 counts per energy bin in order to apply the statistics in the search for the best-fit model (Avni 1976). Errors are quoted at 1 confidence, unless otherwise stated . All the models include Galactic absorption by a column density cm-2 (Kalberla et al. 2005). We focused our analysis on the 0.2-10 keV band of the pn data and on the 0.3-8 keV band of the MOS data. We simultaneously fit the average spectra of the four epochs, Dec. 2004, Jun. 2008, Dec. 2008, and 2009 Long Look, to investigate the causes of the observed variability on month-long time scales. For each epoch, the model parameters were kept fixed between the MOS and the pn datasets, except for the primary power-law normalizations that were left free to vary within 10% to account for the instrumental cross-calibration uncertainties. For the sake of clarity, in most of the following plot we only show the pn data.
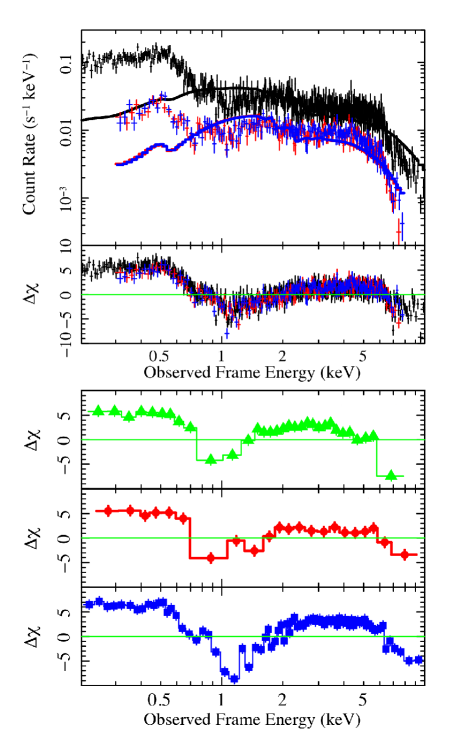
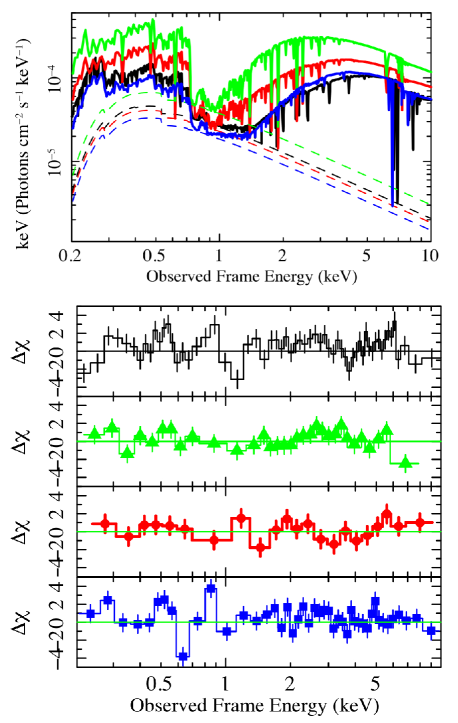
The spectra were initially fit to a simple power-law model, with fixed slope and free amplitude between different epochs. Results are shown in Fig. 3. The fit is very poor, with a chi square per degrees of freedom , and a very flat photon index . The spectral residuals of all the four epochs have a similar shape, and indeed allowing for the spectral slope of the power-law to vary between epochs does not improve the fit statistics. Three main deviations from the simple power-law model are consistently observed in spectra from all three instruments and in all four epochs of observation: (a) both negative and positive residuals in the soft band, keV, (b) a deficit of counts at the highest energies probed by the EPIC camera, keV, and (c) a cutoff at keV.
We then tested several models of increasing complexity, to reproduce the complex spectral shape of PG 1126-041. A neutral absorber fully covering the emission source is not required by the data. On the other hand, allowing for the absorber to only partially cover the source (zpcfabs model in Xspec) significantly improves the fit statistics with respect to the power-law model (), but still gives an unacceptable fit (). A better fit for the same number of degrees of freedom () is given by a ionized absorber totally covering the source (modeled with Xstar333 We applied the precompiled grid25, publicly available at ftp://legacy.gsfc.nasa.gov/software/plasma_codes/xstar/xspectables/grid25/, which is computed for an ionizing continuum with , a gas shell with cm-3, a turbulent velocity km s-1, and solar abundances, see Kallman & Bautista (2001) and the Xstar documentation.), but again, the fit is statistically unacceptable ().
The ionized absorber was then allowed to only partially cover the X-ray source (model A), by adding a secondary soft power-law with the same slope as the primary one. The ratio between the normalizations of the two power-laws gives the fraction of the direct (unabsorbed by intrinsic absorption) flux ; the absorber covering factor is then . We obtain an improvement in the fit statistics of , and the resulting fit is marginally acceptable, with a . The model A parameters are reported in Table 3 along with their 1 statistical errors. We note how the direct flux fraction in every epoch is around 2-3%, as is observed for the scattered component in absorbed AGN, and scattered emission accompanied by recombination emission lines would be naturally associated to the presence of ionized gas along the line of sight. Unfortunately, with the S/N of our observations we cannot distinguish among the partial covering and scattering scenarios in reproducing the soft band residuals, and the secondary soft power-law physical interpretation is not unambiguous. To the first order, model A is able to reproduce the complex spectral shape of PG 1126-041, in particular by recovering the cutoff at keV and most of the soft band spectral residuals. While the Jun. 2008 and Dec. 2008 spectra are generally reproduced well, the low flux states of the 2009 Long Look and Dec. 2004 still show strong residuals at keV and keV.
| Jun. 2009 | Dec. 2008 | Jun. 2008 | Dec. 2004 | |
| Model A: ionized partial covering | ||||
| Xspec: zpo2 + XSTAR*zpo1 | ||||
| 2.15 | ||||
| 1.05 | 1.89 | 1.40 | 1.00 | |
| 14.36 | 4.91 | 7.97 | 9.78 | |
| 1.66 | 1.44 | 1.58 | 1.57 | |
| 0.97 | 0.98 | 0.98 | 0.97 | |
| 1893/1579 | ||||
| Model B: ionized partial covering + highly ionized absorber | ||||
| Xspec: zpo2 + XSTAR1*XSTAR2*zpo1 | ||||
| 2.14 | ||||
| 1.12 | 1.82 | 1.41 | 1.01 | |
| 14.82 | 3.17 | 6.93 | 9.75 | |
| 1.66 | 1.29 | 1.54 | 1.57 | |
| 0.97 | 0.98 | 0.98 | 0.97 | |
| 75.18 | 62.54 | |||
| 3.43 | 3.75 | |||
| 0.054 | 0.0F | 0.0F | 0.0F | |
| 1771/1570 | ||||
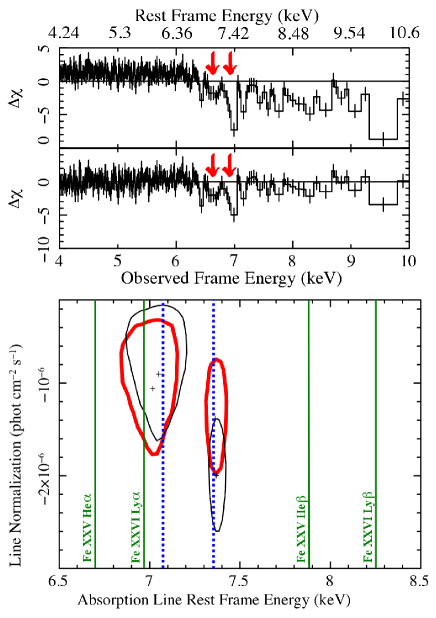
In particular, the top panel of Fig. 4 shows a magnified view of the 4-10 keV residuals of the 2009 Long Look pn data, relative to the simple power-law emission (top panel) and to model A (lower panel). We make an initial, phenomenological model for these residuals by adding Gaussian profiles with negative normalization to model A of the 2009 Long Look dataset. Even though the model adopted is only a rough approximation of a more complex physical context, the basic properties such as the FWHM and the EW of the absorption features are still physically meaningful. Including two narrow (unresolved, eV) Gaussian absorption lines improves the fit statistics by with respect to model A. The energies and equivalent widths of the two absorption lines are and keV, and eV, in the source rest frame. Allowing the widths of the absorption lines to be free parameters does not improve the fit (). In the bottom panel of Fig. 4 we show the 99% confidence contours for the absorption lines centroid energy and (negative) normalization, along with the energies of the strongest transitions of Fe XXV and Fe XXVI. There is a remarkable correspondence between the detected centroid energies and the Fe XXV He and Fe XXVI Ly transitions, both blueshifted by , so we identify the two absorption lines with these two transitions.
The moderately ionized absorber (m.i.) responsible for the opacity in the soft band has an ionization state too low to account for the strong absorption in the iron K band. So we added another layer of highly ionized (h.i.) gas modeled again with XSTAR. We used the same input parameters as the grid 25, but we find a turbulence velocity km s-1 to better reproduce the residuals. Only in the case of the 2009 Long Look data we allowed the velocity shift of the highly ionized absorber to be a free parameter; given the much lower S/N of the three other epochs, we fixed the velocity shift of this component to zero. The addition of the highly ionized absorber significantly improves the fit with respect to the moderately ionized partially covering absorber model (), and gives a good overall representation of the data (). Spectral parameters along with their errors are reported in Table 3, model B. The corresponding theoretical model is plotted in top panel of Fig. 5, while the spectral residuals to the model are plotted in the bottom panel of Fig. 5 for each epoch.
Significant residuals at keV relative to model B are present only in the 2009 Long Look and Dec. 2004 spectra. The residuals could be either due to an improper modelization of the absorbers or to an unmodeled component that emerges in the soft band when the source is in a low flux state. In any case, we know from the timing analysis performed in Sect. 4 that in this energy range the source shows no spectral variability on short time scales. We find an improvement in statistics of and for the addition of two narrow Gaussian emission lines with centroid energies and normalizations fixed between the epochs. The best-fit rest frame energies are keV and keV, while the equivalent widths eV and eV, depending on the epoch of observation. The fit statistics after including the two soft emission lines is . The observed energies might correspond to O VII K and Fe L emission features, but the exact identification is prohibitive with the pn spectral resolution. Physically, possible contributors to the soft emission can be a scattered component accompanied by recombination lines from a photoionized gas, thermal emission from an underlying starburst component, or a mixture of the two (e.g. IRAS 13197-1627, Miniutti et al. 2007). Unfortunately, PG 1126-041 is not detected by the RGS, and the pn spectral resolution does not allow the different scenarios to be distinguished, thus we do not try to model the soft residuals any further.
As for the high-energy residuals, an excess of counts at observed energies keV is present in the 2009 Long Look data, suggesting the presence of complexities in the Fe K band. We note that at these energies PG 1126-041 is highly variable on kilosecond time scales (Sect. 4). The addition of an Fe I K emission line, which is forced to be narrow and has a centroid energy of 6.4 keV in the source rest frame improves the fit statistics by , corresponding to a significant detection (F-test probability %). The best-fit model statistics are , with a reduced chi square . There are still shallow residuals in the Fe K band, which could be modeled with a broad Gaussian emission line, a relativistic Fe K line, or a partial covering absorber, in all cases suggesting the possible presence of further complexities in the iron K band (see M. Giustini Ph.D. thesis for details). However, given the low statistical significance of the residuals, their appearance only in the 2009 Long Look observation, and the high variability of the source at those energies on a short time scale during the same observation, we do not try to model these residuals and turn our attention on the time-resolved spectral analysis of the 2009 Long Look data.
6 Time-resolved spectral analysis
| Interval | Exposure | Count-rate | ||
|---|---|---|---|---|
| 1 | 21.1 | 0.180 | 0.87 | 1.00 |
| 2 | 30.0 | 0.156 | 0.71 | 0.83 |
| 3 | 5.4 | 0.212 | 1.17 | 1.32 |
| 4 | 7.5 | 0.195 | 0.98 | 1.12 |
| 5 | 4.6 | 0.215 | 1.17 | 1.32 |
| 6 | 5.4 | 0.194 | 0.98 | 1.12 |
| 7 | 7.7 | 0.338 | 2.11 | 2.31 |
| 8 | 9.2 | 0.245 | 1.38 | 1.54 |
We performed time-resolved spectral analysis on the EPIC pn data extracted in the eight time intervals of the 2009 Long Look observation marked in the middle panel of Fig. 2. Exposure times and background-corrected count rates are reported in Table 4 for each interval. Given that the count rates are the same in several intervals, we merged the third and the fifth intervals together and the fourth and the sixth one together. The unfolded 0.2-10 keV pn spectrum is plotted in Fig. 6 for each of the six resulting intervals.
At energies keV there are variations of about 50% on a few kiloseconds timescales (e.g., from the second to the third time interval, and from the seventh to the eighth time interval), and variations as high as 100% with respect to the average are observed during the seventh interval. All the spectra were simultaneously fitted to the best-fit model B described in the previous section, with all the parameters tied between the time intervals except for the power-law normalizations. The fit to the data is acceptable, , however the model fails to properly reproduce the Fe K band absorption residuals. Allowing for the highly ionized absorber column density and ionization parameter to vary within each temporal slice improves the fit by . Because of the much lower S/N in individual temporal slices, it is not possible to assess whether the absorber varied in column density, ionization state, or a combination of them. Fluxes computed using this best-fit model are reported in Table 4.
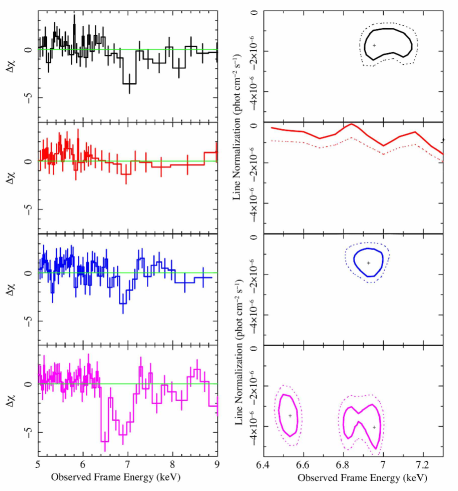
We then removed the highly ionized absorber from the model and visually inspected the residuals in each temporal slice. Given the similar shape of the residuals, we merged the third, fourth, fifth, and sixth time intervals together, and the seventh and eighth time intervals together. The 5-9 keV spectral residuals are shown in the left column of Fig. 7 for each of the four resulting intervals; time is flowing from top to bottom. There is clear variability of the highly ionized absorber on very short time scales: in particular, there are no signs of high-energy absorption during the second interval, while the effect of iron absorption during the last time interval is dramatic. The right column of Fig. 7 shows the corresponding 68% and 90% confidence contours for the energy and (negative) normalization of a narrow Gaussian absorption line used to model the residuals. One can see how the complex absorption features at keV in the observer frame do disappear within the few ks that elapsed between the first and the second time intervals, and then re-develop during the third to sixth temporal slices. The nearly keV absorption trough becomes the deepest and the largest during the seventh-eighth interval, and its shape becomes quite complex, as confirmed by the confidence contours. The intense absorption structure at keV does develop in a few ks and is also visible in the merged 2009 Long Look spectra (top panel of Fig. 4).
Summarizing, the continuum power-law amplitude oscillations dominate the observed spectral variability on ks time scales. The highly ionized absorber is also observed to be variable, while all the other components (i.e. the photon index, the partial covering moderately ionized absorber, and the narrow Gaussian emission lines) are found to be constant during the observation.
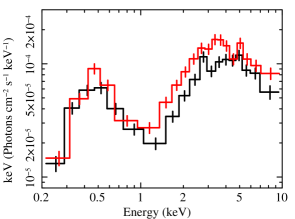
As for the other epochs, the Jun. and Dec. 2008 observations were too short to search for short-term variability. Strong spectral variability was found instead during the 2004 observation: Fig. 8 shows the unfolded pn spectra extracted during the first 10 ks and during the last 10 ks of the Dec. 2004 observation. The variability pattern is the same as of the 2009 Long Look observation i.e. the source is variable on ks time scales only at energies keV, and its spectral variabilty is dominated by continuum amplitude variations.
7 Optical/X-ray photometry
Thanks to the presence of the OM aboard XMM-Newton, simultaneous optical/X-ray photometry was performed for each epoch of observation. The OM data were all taken in image mode, and were reduced and calibrated using standard pipeline procedures through the omichain SAS task. Background-corrected count rates were converted in magnitudes for each exposure (exposure times are ranging between 1 and 4 ks). We were interested in measuring to compute the optical-to-X-ray spectral index , as defined by Tananbaum et al. (1979). We used the weighted mean of the magnitudes measured in the filters with effective wavelength straddling in the observed frame ( in the rest frame). The relevant filters are the UVW1 and UVM2 ( and , respectively). We then corrected this magnitude for Galactic extinction A, estimated using the extinction law of Cardelli et al. (1989). Flux densities for each epoch were then computed using Vega as a calibrator. Optical photometry results are reported in Table 5.
| Epoch | V | U | UVW1 | UVM2 | UVW2 | M(2500) |
|---|---|---|---|---|---|---|
| [5430] | [3440] | [2910] | [2310] | [2120] | [2500] | |
| Dec. 2004 | 14.71 | 14.09 | 13.87 | 14.13 | 14.01 | 13.60 |
| Jun. 2008 | (…) | (…) | 13.71 | 13.92 | (…) | 13.42 |
| Dec. 2008 | (…) | (…) | 13.82 | 13.86 | (…) | 13.46 |
| 2009 Long Look | (…) | (…) | 13.564 | 13.656 | 13.72 | 13.22 |
As for the 2 keV flux density measurements, we used our best-fit model to measure the Galactic absorption corrected rest frame for each observation. Flux densities were then converted to luminosity densities, and the optical-to-X-ray spectral index was computed. It is well known that the spectral index in AGN strongly depends on the intrinsic UV continuum luminosity (e.g., Vignali et al. 2003; Strateva et al. 2005; Steffen et al. 2006; Young et al. 2010). We compared the observed with the value expected on the basis of the UV luminosity of PG 1126-041, using Eq. 2 of Steffen et al. (2006), which gives us the parameter . We note that in the UV luminosity range of PG 1126-041 there is a 3 dispersion in the expected of about 0.1, so that only values of are statistically significant (Steffen et al. 2006). We also computed the luminosity densities corrected for intrinsic X-ray absorption, and the corresponding and . In Table 6 we report the Optical/X-ray photometry results.
There are variations in the observed luminosity density of PG 1126-041 both at UV and at X-ray wavelength. While the observed 2500 flux density steadily increases from 2004 to 2009, and is varying by about 30%, the observed 2 keV flux density increases from 2004 to 2008, and then decreases again in 2009, with variations as high as a factor of between the Dec. 2008 and the 2009 Long Look observations. As a result, the observed is variable between the different epochs, spanning from values typical of radio quiet type 1 AGN (i.e., in the Dec. 2008 observation) to values typical of Soft X-ray Weak AGN (i.e., in the 2009 Long Look observation). However, compared to the expected , the source is found to be “ X-ray weak” in all the epochs, with . Once the effect of intrinsic X-ray absorption is taken into account, the maximum observed variations in the 2 keV flux density between the different epochs decrease to about a factor of two. Consequently, also the decreases to . It is worth noting that there could be intrinsic UV absorption at the redshift of the source, e.g. by dust in the AGN host galaxy; the amount of intrinsic UV absorption is unknown so we do not try to model it, but we keep in mind that this effect might make the actual (intrinsic) flatter than .
| Epoch | |||||||||
|---|---|---|---|---|---|---|---|---|---|
| (1) | (2) | (3) | (4) | (5) | (6) | (7) | (8) | (9) | (10) |
| Dec. 2004 | -25.46 | -30.46 | 29.49 | 24.49 | -1.92 | -0.52 | 25.28 | -1.68 | -0.28 |
| Jun. 2008 | -25.39 | -30.17 | 29.56 | 24.77 | -1.84 | -0.43 | 25.31 | -1.63 | -0.22 |
| Dec. 2008 | -25.40 | -29.80 | 29.55 | 25.15 | -1.69 | -0.28 | 25.57 | -1.53 | -0.12 |
| 2009 Long Look | -25.30 | -30.46 | 29.64 | 24.49 | -1.98 | -0.56 | 25.26 | -1.62 | -0.20 |
8 Discussion
PG 1126-041 is observed to be highly variable in X-rays on time scales of both months and kiloseconds. The variability on time scales of months (observed to be as high as 4 in flux) is dominated by a spectral component emerging at 6 keV (Fig. 1). On the other hand, the RMS variability analysis performed on the 2009 Long Look pn observation (92 ks of contiguous good exposure time) revealed the presence of a spectral component emerging only at keV, which dominates the variability on time scales of kiloseconds (up to 50% variations in flux, Fig. 2).
A wealth of information has been obtained both on the intrinsic X-ray continuum emission of PG 1126-041 and on the reprocessing media that happen to be in the inner regions of this AGN. We discuss our results starting from the inner regions around the SMBH (i.e., the shortest time scales) and moving farther out (i.e., the longest time scales). We adopt the SMBH mass estimate of as given by Dasyra et al. (2007). The estimated by Vestergaard & Peterson (2006) through scaling relations is a factor of 2.4 lower. Adopting the bolometric luminosity (Sanders et al. 1989) and assuming an accretion efficiency gives an accretion rate needed to power PG 1126-041 of yr and an Eddington ratio . The gravitational radius is cm and the corresponding light travel time is s.
Two absorbers are detected in the X-ray spectra of PG 1126-041, a moderately ionized ( erg cm s-1) and a highly ionized ( erg cm s-1) one. Strong variations in both the intrinsic continuum and of the highly ionized outflowing absorber are responsible of the observed kilosecond time scale variability. The power-law photon index is found not to vary on kilosecond time scales, while the intensity of the intrinsic power-law spectrum ifollows the pattern of the 1.5-10 keV count rate over the whole observation (see the middle bottom panel of Fig. 2 and Table 4), and doubles in a time interval lasting about 8 ks (the seventh interval). The variability time scale of the intrinsic continuum can set a constraint on the geometrical size of the X-ray emission region through the causality argument, cm . The highly ionized absorber is observed to be outflowing at km s-1 during the average 2009 Long Look observation. In the time-resolved spectral analysis of the same exposure, the outflowing absorber is found to be variable over very short time scales (Fig. 7). With the much lower S/N of each temporal slice, it was not possible to assess whether the absober varied in ionization state, column density, or blueshift. However, the very short time scale variability suggests that the absorber is very compact and very close to the X-ray source and that we are possibly observing rapid mass ejections from the inner regions of the accretion disk, e.g., the base of an accretion disk wind. We note in particular how the absorption features do develop in a very short time scale, from the sixth to the seventh interval, together with the strong continuum flare.
By making some assumptions, we can try to estimate the mass outflow rate associated to the highly ionized absorber. In general, the mass outflow rate can be written as
where is a geometrical factor that accounts for how the flow diverges, and and are the density and velocity of the flow. By assuming a spherically symmetric, isotropic, steady flow with a constant velocity, one can write
| (1) |
where is the hydrogen atom mass, the absorber distance from the central SMBH, the absorber number density, is the solid angle occupied by the flow as seen by the central point source, and the volume filling factor.
If we use appropriate values for PG 1126-041, we can rearrange the expression and write
where cm-3, . In the expression above, the geometrical covering factor and volume filling factor are unknown, and depend on the wind geometry and duty cycle. The density and the radial distance of the flow are also unknown.
Assuming that the outflowing absorber is a thin spherical shell of gas in photoionization equilibrium, one can use the definition of the ionization parameter to replace the unknown density and distance with the ratio . However, in addition to the strong assumptions made regarding the spherical geometry of the outflow, there are uncertainties in the ionizing continuum luminosity, and especially in the actual value of the ionization parameter that may affect our mass outflow rate estimates.
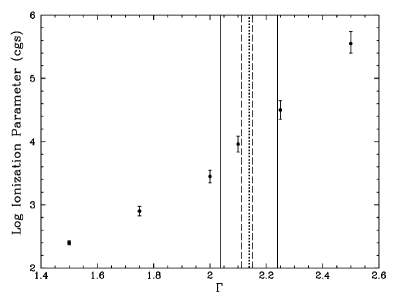
In our spectral analysis results we quoted only the statistical errors on : the systematic errors related to the input parameters used in the photoionization code (Xstar in our case) can be much larger, especially for highly ionized absorbers where only a few spectral transitions are available (e.g., Fe XXV, Fe XXVI). The major dependence of the best-fit value is related to the slope adopted for the ionizing power-law continuum. This is because , where is the ionizing photons number density, the photoionized gas number density. By fixing the ionizing luminosity, a steeper results in a smaller number of high-energy photons able to strip electrons from highly ionized Fe than for a flatter . This leads to higher best-fit values measured for when using a steeper ionizing continuum. To show this dependence, we generated several Xstar absorber models using the same input for all the physical parameters, but different slopes . We then fitted the 2009 Long Look average spectra to each of these models, recording the best-fit value measured for the highly ionized absorber responsible for the absorption features visible in Fig. 4. Results are plotted in Fig. 9: the systematic error on is very large, and even restricting the slope of the ionizing continuum to values typical of type 1 AGN, , gives a systematic uncertainty on of a factor of about 30. Using the measured slope for PG 1126-041 along with its systematic error gives an uncertainty on our measured of a factor of .
Just as for a comparison with other literature results, we can roughly estimate the kinetic luminosity associated to the PG 1126-041 outflow as follows. We take the best estimate for from Fig. 9, considering the best-fit measured photon index as the slope of the ionizing continuum. For the ionizing luminosity, we take the measured unabsorbed 2-10 keV luminosity listed in Table 1. Substituting the ratio of these two quantities to the product in Eq. 1, and using the best-fit outflow velocity, one can write
i.e., less than one hundreth of the bolometric luminosity of PG 1126-041.
The uncertainties on the physical quantities related to the outflow are huge, and the assumptions made to derive the expression for the mass outflow rate and kinetic luminosity are likely to be incorrect. The presence of the accretion disk breaks the spherical symmetry by itself; furthermore, the highly ionized absorber is observed to be variable on very short time scales: the geometrical and dynamical effects are most probably very important in accretion disk wind scenarios. For these reasons, it is very difficult to give a meaningful (i.e. with less than two order of magnitudes uncertainties) estimate of the mass outflow rate and of its kinetic efficiency. Although one can not exactly assess the impact of the fast outflow of PG 1126- 041 on its environment, we stress that its detection is statistically solid and model-independent.
Turning our attention to the larger scales, we note that at keV the power-law variability is smeared out by the presence of a soft constant component, and at keV the highly ionized absorber opacity drops (see top panel of Fig. 5), so explaining the constant soft flux measured during the whole 2009 Long Look observation. As for the soft component, we modeled it as the direct continuum emission that escapes unabsorbed by a partially covering ionized gas. However, the low fraction of unabsorbed flux, , could also physically correspond to a scattered component, that would be naturally associated to the presence of ionized gas along the line of sight. With the moderate pn spectral resolution it is not possible to distinguish among the different scenarios, and unfortunately PG 1126-041 is not detected by the RGS. However, we stress that the adopted modeling for the soft band constant component influences neither the absorbers nor the continuum physical parameters.
The PG 1126-041 X-ray variability on long time scales is dramatic, and is especially pronounced at energies keV. The is observed to be variable up to 4.5 higher in the six months elapsed between the Dec. 2008 and the 2009 Long Look observations (Fig. 1). The moderately ionized absorber is detected in every XMM-Newton observation of PG 1126-041. Its column density varies significantly between the minimum cm-2 measured in the Dec. 2008 observation and the maximum cm-2 measured in the 2009 Long Look observations. In fact, the moderately ionized absorber column density variations dominate the spectral variability observed on month time scales, together with amplitude variations of the intrinsic continuum up to a factor of two (Table 3). The ionization state of the moderately ionized absorber is typical of the X-ray warm absorbers, however the measured column density are much higher than what is usually observed in warm absorbers (see e.g. McKernan et al. 2007).
A possible physical scenario is that of a UV line-driven accretion disk wind like the one developed by Proga & Kallman (2004) and modeled by Sim et al. (2010). These authors computed the simulated X-ray spectra for a nonspherical, hydrodynamical accretion disk wind in an AGN with , accreting with , i.e., with conditions that are not too different to those observed in PG 1126-041. The simulated spectra change significantly for different inclination angles and different snapshots of the flow, confirming both the nonspherical character and the highly dynamical behavior of the X-ray spectrum associated with such winds. The spectral signature of such flows includes both absorption and emission features. For example, the iron K band is shaped both by absorption by a highly ionized (Fe XXV, Fe XXVI) outflowing phase of the wind, and by emission and scattering off the highly ionized base of the flow, which produces a Compton bump that mimics a red-skewed iron K line. In the soft band ( keV), there are contributions by a blend of emission lines from elements such as C, O, Fe, and bremsstrahlung emission by the wind.
From a dynamical point of view, the same model also predicts a flow component that qualitatively shows the same behavior of the highly ionized absorber. At intermediate inclination angles above the disk plane and above the “skin” of the fast wind, where the gas is most exposed to the X-ray ionizing source, recurrent instabilities with blobs (or “puffs”) of high density can develop. Some of these puffs quickly become overionized and fail to become part of the wind, while others can be able to be efficiently accelerated to velocities even higher than those of the fast wind and well above the local escape velocity. This flow component would be observationally detectable in the X-ray spectra via large column density variations and sporadic high-velocity ejections, on short timescales, similar to what was observed during the 2009 Long Look observation of PG 1126-041. This may suggest that radiation-driven accretion disk wind models can account in a self-consistent way for most of the observed X-ray spectral features in the mini-BAL QSO PG 1126-041. Models for the X-ray spectra of accretion disk winds that can be fitted to real data are still under developement, therefore we must confine ourselves to qualitative considerations. However, we note that in this scenario the radial flow assumption is invalid, and the mass outflow rate associated with the highly ionized phase is overall very different than in the spherical case.
The moderately ionized absorber, on the other hand, is not variable on short time scales but is strongly variable over time scales of months. Its observed variability is consistent with the scenario suggested to explain the variability in the UV absorption lines of the mini-BAL QSO HS 1603+3820 over rest frame time scales of weeks and months (Misawa et al. 2007b, 2010). In this scenario the variability of the UV absorption lines is the result of fluctuations in the continuum, which is caused by a screen of clumpy, highly-ionized gas between the UV absorber and the continuum source. This clumpy screen has similar properties as the moderately ionized absorber we have found in PG 1126-041.
The observed optical-to-X-ray spectral index is found to be highly variable, following the moderately ionized absorber variability. Although never gets , when compared with the expected based on the UV continuum luminosity, it is found that PG 1126-041 is observed to be “ soft X-ray weak”, depending on the epoch of observation. After correcting for the intrinsic X-ray absorption, the source is still slightly X-ray weak, . The observed variability driven by X-ray absorption variability is similar to what Ballo et al. (2008) observed in the mini-BAL QSO PG 1535+547. The 2-10 keV unabsorbed luminosity is still very low, erg s-1, and compared with gives a very high bolometric correction, , that is however still compatible with the relation as in Lusso et al. (2010).
9 Conclusions
Our XMM-Newton observational campaign on the mini-BAL QSO PG 1126-041 allowed us to characterize the complex high-energy spectral behavior of the source with unprecedented sensitivity. We analyzed data for four different pointed observations that in all span 4.5 yr.
The most evident and model-independent result is the detection of high column densities of ionized gas along the line of sight, which contribute to the observed spectral variability of the highly ionized and moderately ionized phase on kilosecond and month time scales, respectively. In particular, the highly ionized absorber is found to be variable on very short (a few ks) time scales, suggesting an origin very close to the SMBH. Also the intrinsic X-ray continuum emission is observed to be variable in intensity, on both short and long time scales.
Overall our findings are qualitatively consistent with radiation-driven, accretion disk wind model predictions, where one expects a high column density of X-ray absorbing gas shielding the portion of the wind that is accelerated by UV photons. The hot X-ray component of the wind is also expected to be highly variable with time in such a model. The mini-BAL appearance of the wind of PG 1126-041 is qualitatively consistent with an orientation effect, in which our line of sight and the plane of the accretion disk make a larger angle than when viewing classical BAL QSOs. We are looking at a narrower range of UV velocities through the wind (hence the small width of the UV absorption features) and at the transition zone between the fast UV wind and the hot X-ray component of the flow, where we expect strong X-ray spectral variability.
The present X-ray observational campaign of the mini-BAL QSO PG 1126-041 has demonstrated that long and short term variability studies are quite powerful tools for identifying the physical mechanisms at work and for mapping the dynamics of the inner accretion/ejection flow in AGN.
Acknowledgments
MG, MC, MD, and CV acknowledge financial support from the ASI/INAF contracts I/088/06/0 and I/009/10/0. GC and MG acknowledge support provided by NASA grant NNXlOAEllG. DP and MG acknowledge support provided by the Chandra award TM0-11010X issued by the Chandra X-ray Observatory Center, which is operated by the Smithsonian Astrophysical Observatory for and on behalf of NASA under contract NAS 8-39073. ME acknowledges support from the National Science Fundation under grant AST-0807993. GP acknowledges support via an EU Marie Curie Intra-European Fellowship under contract no. FP7-PEOPLE-2009-IEF-254279. We thank the referee for the thoughtful comments that helped improve the article presentation. This research has made use of the NASA/IPAC Extragalactic Database (NED) which is operated by the Jet Propulsion Laboratory, California Institute of Technology, under contract with the National Aeronautics and Space Administration.
References
- Allen et al. (2011) Allen, J. T., Hewett, P. C., Maddox, N., Richards, G. T., & Belokurov, V. 2011, MNRAS, 410, 860
- Avni (1976) Avni, Y. 1976, ApJ, 210, 642
- Ballo et al. (2008) Ballo, L., Giustini, M., Schartel, N., et al. 2008, A&A, 483, 137
- Blustin et al. (2005) Blustin, A. J., Page, M. J., Fuerst, S. V., Branduardi-Raymont, G., & Ashton, C. E. 2005, A&A, 431, 111
- Boroson & Green (1992) Boroson, T. A. & Green, R. F. 1992, ApJS, 80, 109
- Brandt et al. (2000) Brandt, W. N., Laor, A., & Wills, B. J. 2000, ApJ, 528, 637
- Cappi (2006) Cappi, M. 2006, Astronomische Nachrichten, 327, 1012
- Cardelli et al. (1989) Cardelli, J. A., Clayton, G. C., & Mathis, J. S. 1989, ApJ, 345, 245
- Chartas et al. (2003) Chartas, G., Brandt, W. N., & Gallagher, S. C. 2003, ApJ, 595, 85
- Chartas et al. (2002) Chartas, G., Brandt, W. N., Gallagher, S. C., & Garmire, G. P. 2002, ApJ, 579, 169
- Chartas et al. (2009a) Chartas, G., Charlton, J., Eracleous, M., et al. 2009a, New Astronomy Review, 53, 128
- Chartas et al. (2009b) Chartas, G., Kochanek, C. S., Dai, X., Poindexter, S., & Garmire, G. 2009b, ApJ, 693, 174
- Chartas et al. (2009c) Chartas, G., Saez, C., Brandt, W. N., Giustini, M., & Garmire, G. P. 2009c, ApJ, 706, 644
- Chelouche & Netzer (2005) Chelouche, D. & Netzer, H. 2005, ApJ, 625, 95
- Dai et al. (2010) Dai, X., Kochanek, C. S., Chartas, G., et al. 2010, ApJ, 709, 278
- Dasyra et al. (2007) Dasyra, K. M., Tacconi, L. J., Davies, R. I., et al. 2007, ApJ, 657, 102
- Di Matteo et al. (2005) Di Matteo, T., Springel, V., & Hernquist, L. 2005, Nature, 433, 604
- Dunn et al. (2010) Dunn, J. P., Bautista, M., Arav, N., et al. 2010, ApJ, 709, 611
- Elvis (2006) Elvis, M. 2006, Memorie della Societa Astronomica Italiana, 77, 573
- Everett (2005) Everett, J. E. 2005, ApJ, 631, 689
- Everett (2007) Everett, J. E. 2007, Ap&SS, 311, 269
- Gallagher et al. (2006) Gallagher, S. C., Brandt, W. N., Chartas, G., et al. 2006, ApJ, 644, 709
- Ganguly et al. (2001) Ganguly, R., Bond, N. A., Charlton, J. C., et al. 2001, ApJ, 549, 133
- Ganguly & Brotherton (2008) Ganguly, R. & Brotherton, M. S. 2008, ApJ, 672, 102
- Gibson et al. (2009a) Gibson, R. R., Brandt, W. N., Gallagher, S. C., & Schneider, D. P. 2009a, ApJ, 696, 924
- Gibson et al. (2009b) Gibson, R. R., Jiang, L., Brandt, W. N., et al. 2009b, ApJ, 692, 758
- Giustini et al. (2008) Giustini, M., Cappi, M., & Vignali, C. 2008, A&A, 491, 425
- Green et al. (2001) Green, P. J., Aldcroft, T. L., Mathur, S., Wilkes, B. J., & Elvis, M. 2001, ApJ, 558, 109
- Green et al. (1995) Green, P. J., Schartel, N., Anderson, S. F., et al. 1995, ApJ, 450, 51
- Haardt & Maraschi (1991) Haardt, F. & Maraschi, L. 1991, ApJ, 380, L51
- Haardt et al. (1994) Haardt, F., Maraschi, L., & Ghisellini, G. 1994, ApJ, 432, L95
- Hamann & Sabra (2004) Hamann, F. & Sabra, B. 2004, in Astronomical Society of the Pacific Conference Series, Vol. 311, AGN Physics with the Sloan Digital Sky Survey, ed. G. T. Richards & P. B. Hall, 203
- Hewett & Foltz (2003) Hewett, P. C. & Foltz, C. B. 2003, AJ, 125, 1784
- Kalberla et al. (2005) Kalberla, P. M. W., Burton, W. B., Hartmann, D., et al. 2005, A&A, 440, 775
- Kallman & Bautista (2001) Kallman, T. & Bautista, M. 2001, ApJS, 133, 221
- Knigge et al. (2008) Knigge, C., Scaringi, S., Goad, M. R., & Cottis, C. E. 2008, MNRAS, 386, 1426
- Komatsu et al. (2011) Komatsu, E., Smith, K. M., Dunkley, J., et al. 2011, ApJS, 192, 18
- Komossa & Meerschweinchen (2000) Komossa, S. & Meerschweinchen, J. 2000, A&A, 354, 411
- Königl (2006) Königl, A. 2006, Mem. Soc. Astron. Italiana, 77, 598
- Konigl & Kartje (1994) Konigl, A. & Kartje, J. F. 1994, ApJ, 434, 446
- Laor & Brandt (2002) Laor, A. & Brandt, W. N. 2002, ApJ, 569, 641
- Laor et al. (1997) Laor, A., Fiore, F., Elvis, M., Wilkes, B. J., & McDowell, J. C. 1997, ApJ, 477, 93
- Lusso et al. (2010) Lusso, E., Comastri, A., Vignali, C., et al. 2010, A&A, 512, A34+
- McKernan et al. (2007) McKernan, B., Yaqoob, T., & Reynolds, C. S. 2007, MNRAS, 379, 1359
- Miniutti et al. (2007) Miniutti, G., Ponti, G., Dadina, M., Cappi, M., & Malaguti, G. 2007, MNRAS, 375, 227
- Misawa et al. (2007a) Misawa, T., Charlton, J. C., Eracleous, M., et al. 2007a, ApJS, 171, 1
- Misawa et al. (2007b) Misawa, T., Eracleous, M., Charlton, J. C., & Kashikawa, N. 2007b, ApJ, 660, 152
- Misawa et al. (2010) Misawa, T., Kawabata, K. S., Eracleous, M., Charlton, J. C., & Kashikawa, N. 2010, ApJ, 719, 1890
- Morgan et al. (2008) Morgan, C. W., Kochanek, C. S., Dai, X., Morgan, N. D., & Falco, E. E. 2008, ApJ, 689, 755
- Murray et al. (1995) Murray, N., Chiang, J., Grossman, S. A., & Voit, G. M. 1995, ApJ, 451, 498
- Neugebauer et al. (1987) Neugebauer, G., Green, R. F., Matthews, K., et al. 1987, ApJS, 63, 615
- Piconcelli et al. (2005) Piconcelli, E., Jimenez-Bailón, E., Guainazzi, M., et al. 2005, A&A, 432, 15
- Ponti et al. (2004) Ponti, G., Cappi, M., Dadina, M., & Malaguti, G. 2004, A&A, 417, 451
- Pounds et al. (2003) Pounds, K. A., Reeves, J. N., King, A. R., et al. 2003, MNRAS, 345, 705
- Pringle (1981) Pringle, J. E. 1981, ARA&A, 19, 137
- Proga (2007) Proga, D. 2007, in Astronomical Society of the Pacific Conference Series, Vol. 373, The Central Engine of Active Galactic Nuclei, ed. L. C. Ho & J.-W. Wang, 267–+
- Proga & Kallman (2004) Proga, D. & Kallman, T. R. 2004, ApJ, 616, 688
- Proga et al. (2000) Proga, D., Stone, J. M., & Kallman, T. R. 2000, ApJ, 543, 686
- Reichard et al. (2003) Reichard, T. A., Richards, G. T., Hall, P. B., et al. 2003, AJ, 126, 2594
- Reynolds (1997) Reynolds, C. S. 1997, MNRAS, 286, 513
- Risaliti et al. (2005a) Risaliti, G., Bianchi, S., Matt, G., et al. 2005a, ApJ, 630, L129
- Risaliti et al. (2005b) Risaliti, G., Elvis, M., Fabbiano, G., Baldi, A., & Zezas, A. 2005b, ApJ, 623, L93
- Risaliti et al. (2007) Risaliti, G., Elvis, M., Fabbiano, G., et al. 2007, ApJ, 659, L111
- Risaliti et al. (2009a) Risaliti, G., Miniutti, G., Elvis, M., et al. 2009a, ApJ, 696, 160
- Risaliti et al. (2009b) Risaliti, G., Salvati, M., Elvis, M., et al. 2009b, MNRAS, 393, L1
- Rodriguez Hidalgo et al. (2007) Rodriguez Hidalgo, P., Hamann, F., Nestor, D., & Shields, J. 2007, in Astronomical Society of the Pacific Conference Series, Vol. 373, The Central Engine of Active Galactic Nuclei, ed. L. C. Ho & J.-W. Wang, 287–+
- Sanders et al. (1989) Sanders, D. B., Phinney, E. S., Neugebauer, G., Soifer, B. T., & Matthews, K. 1989, ApJ, 347, 29
- Scannapieco et al. (2005) Scannapieco, E., Silk, J., & Bouwens, R. 2005, ApJ, 635, L13
- Schlegel et al. (1998) Schlegel, D. J., Finkbeiner, D. P., & Davis, M. 1998, ApJ, 500, 525
- Schmidt & Green (1983) Schmidt, M. & Green, R. F. 1983, ApJ, 269, 352
- Shakura & Sunyaev (1973) Shakura, N. I. & Sunyaev, R. A. 1973, A&A, 24, 337
- Shuder & Osterbrock (1981) Shuder, J. M. & Osterbrock, D. E. 1981, ApJ, 250, 55
- Sim et al. (2010) Sim, S. A., Proga, D., Miller, L., Long, K. S., & Turner, T. J. 2010, MNRAS, 408, 1396
- Steffen et al. (2006) Steffen, A. T., Strateva, I., Brandt, W. N., et al. 2006, AJ, 131, 2826
- Strateva et al. (2005) Strateva, I. V., Brandt, W. N., Schneider, D. P., Vanden Berk, D. G., & Vignali, C. 2005, AJ, 130, 387
- Surace et al. (2001) Surace, J. A., Sanders, D. B., & Evans, A. S. 2001, AJ, 122, 2791
- Tananbaum et al. (1979) Tananbaum, H., Avni, Y., Branduardi, G., et al. 1979, ApJ, 234, L9
- Tananbaum et al. (1986) Tananbaum, H., Avni, Y., Green, R. F., Schmidt, M., & Zamorani, G. 1986, ApJ, 305, 57
- Tombesi et al. (2010a) Tombesi, F., Cappi, M., Reeves, J. N., et al. 2010a, A&A, 521, A57+
- Tombesi et al. (2010b) Tombesi, F., Sambruna, R. M., Reeves, J. N., et al. 2010b, ApJ, 719, 700
- Turnshek et al. (1980) Turnshek, D. A., Weymann, R. J., Liebert, J. W., Williams, R. E., & Strittmatter, P. A. 1980, ApJ, 238, 488
- Vaughan et al. (2003) Vaughan, S., Edelson, R., Warwick, R. S., & Uttley, P. 2003, MNRAS, 345, 1271
- Vestergaard & Peterson (2006) Vestergaard, M. & Peterson, B. M. 2006, ApJ, 641, 689
- Vignali et al. (2003) Vignali, C., Brandt, W. N., & Schneider, D. P. 2003, AJ, 125, 433
- Wang et al. (1999) Wang, T. G., Brinkmann, W., Wamsteker, W., Yuan, W., & Wang, J. X. 1999, MNRAS, 307, 821
- Weymann et al. (1991) Weymann, R. J., Morris, S. L., Foltz, C. B., & Hewett, P. C. 1991, ApJ, 373, 23
- Young et al. (2010) Young, M., Elvis, M., & Risaliti, G. 2010, ApJ, 708, 1388