Galaxy populations in the Antlia cluster - III. Properties of faint early-type galaxies ††thanks: Based on observations carried out at the Cerro Tololo Inter–American Observatory (Chile), at Las Campanas Observatory (Chile), and at the European Southern Observatory, Paranal (Chile). Also based on observations obtained at the Gemini Observatory, which is operated by the Association of Universities for Research in Astronomy, Inc., under a cooperative agreement with the NSF on behalf of the Gemini partnership: the National Science Foundation (United States), the Science and Technology Facilities Council (United Kingdom), the National Research Council (Canada), CONICYT (Chile), the Australian Research Council (Australia), Ministerio da Ciencia e Tecnologia (Brazil) and Ministerio de Ciencia, Tecnología e Innovación Productiva (Argentina).
Abstract
We present a new analysis of the early-type galaxy population in the central region of the Antlia cluster, focusing on the faint systems like dwarf ellipticals (dE) and dwarf spheroidals (dSph). The colour–magnitude relation (CMR) and the relation between luminosity and mean effective surface brightness for galaxies in the central region of Antlia have been previously studied in Paper I of the present series. Now we confirm 22 early-type galaxies as Antlia members, using GEMINI–GMOS and MAGELLAN–MIKE spectra. Among them, 15 are dEs from the FS90 Antlia Group catalogue, 2 belong to the rare type of compact ellipticals (cE), and 5 are new faint dwarfs that had never been catalogued before. In addition, we present 16 newly identified low surface brightness galaxy candidates, almost half of them displaying morphologies consistent with being Antlia’s counterparts of Local Group dSphs, that extend the faint luminosity limit of our study down to mag. With these new data, we built an improved CMR in the Washington photometric system, i.e. integrated magnitudes versus colours, which extends mag faintwards the limit of spectroscopically confirmed Antlia members. When only confirmed early-type members are considered, this relation extends over 10 mag in luminosity with no apparent change in slope or increase in colour dispersion towards its faint end. The intrinsic colour scatter of the relation is compared with those reported for other clusters of galaxies; we argue that it is likely that the large scatter of the CMR, usually reported at faint magnitudes, is mostly due to photometric errors along with an improper membership/morphological classification. The distinct behaviour of the luminosity versus mean effective surface brightness relation at the bright and faint ends is analyzed, while it is confirmed that dE galaxies on the same relation present a very similar effective radius, regardless of their colour. The projected spatial distribution of the member sample confirms the existence of two groups in Antlia, each one dominated by a giant elliptical galaxy and with one cE located close to each giant. Size and position, with respect to massive galaxies, of the dSph candidates are estimated and compared to Local Group couterparts.
keywords:
galaxies: clusters: general – galaxies: clusters: individual: Antlia – galaxies: elliptical and lenticular – galaxies: dwarf – galaxies: photometry – galaxies: spectroscopy1 Introduction
The fact that early-type galaxies in clusters and groups define sequences in the colour-magnitude and surface brightness-luminosity diagrams has been known for a long time (Baum 1959; Sandage 1972; Visvanathan & Sandage 1977, e.g.; Sandage & Visvanathan 1978; Kormendy 1977a, b; Caldwell & Bothun 1987; Ferguson & Binggeli 1994). These relations are expected to provide clues about the evolutionary status of the galaxies that follow them and they seem to be universal. Such universality led several authors to suggest their use as reliable distance indicators (e.g. Sandage 1972; Binggeli & Jerjen 1998; Cellone 1999) and to set membership criteria (e.g. Chiboucas & Mateo 2006).
The faint end of these photometric relations is populated by very faint dwarf elliptical (dE) and dwarf spheroidal (dSph) galaxies. Despite morphological criteria have been proven useful for identifying dwarf galaxies in nearby clusters and groups (e.g. Binggeli, Sandage & Tammann 1985; Ferguson 1989; Ferguson & Sandage 1990, hereafter FS90), background galaxies may mimic dwarf morphologies if they are not observed with sufficient spatial resolution (see, for example, object 27 in Conselice, Gallagher & Wyse 2003 and Penny & Conselice 2008). This fact may introduce a significant contamination into the observed relations and may cause disagreements in their interpretation. Examples of discrepancies that deserve some analysis are those related with the linearity and the scatter of the colour–magnitude relation (CMR).
Most CMRs show no perceptible change of slope from luminous galaxies to the dwarf regime (Secker, Harris & Plummer 1997; Terlevich et al. 1999; López-Cruz, Barkhouse & Yee 2004; Andreon et al. 2006; Smith Castelli et al. 2008a, hereafter Paper I; Price et al. 2009) except, perhaps, at the very bright end (see fig. 8b in Misgeld, Mieske & Hilker 2008 and fig. 3 in Misgeld, Hilker & Mieske 2009). However, non-linear trends for the CMR of the Virgo cluster have been found (Ferrarese et al. 2006; Janz & Lisker 2009). In addition, there is a considerable increase in the scatter of all CMRs towards their faint end in comparison to that displayed by the brightest galaxies. It is still under discussion whether such increase has a physical origin pointing to differences in ages, metal abundances or formation scenarios among dwarf galaxies (e.g. Conselice, Gallagher & Wyse 2002; Conselice, Gallagher & Wyse 2003; Penny & Conselice 2008; Jaffé et al. 2011), or whether it can be accounted for by photometric errors (e.g. Secker et al. 1997; Misgeld et al. 2008, 2009; Janz & Lisker 2009) and/or background galaxies contamination (e.g. López-Cruz et al. 2004).
Now, we have spectroscopically confirmed new dwarf Antlia members and we have identified previously non catalogued dwarf candidates. We revisit the relations analyzed in Paper I, i.e. the colour–magnitude and the luminosity–mean effective surface brightness relations, regarding particularly the behaviour of their faint ends. In order to analyze the structure of the Antlia cluster, we study the projected spatial distribution of the whole galaxy sample.
In addition, we have confirmed the existence of two compact elliptical (cE) galaxies in Antlia (Smith Castelli et al. 2008b, hereafter Paper II; Smith Castelli et al. 2009). These are rare low-mass systems; about only a dozen have been identified within a distance of Mpc (Chilingarian & Bergond 2010 and references therein; Huxor et al. 2011) and a similar amount at larger distances (Chilingarian et al. 2009). We include these two peculiar confirmed members in our analysis thus contributing to the discussion of the alleged dichotomy between bright and faint elliptical galaxies (e.g. Graham & Guzmán 2003; Kormendy et al. 2009; Graham 2011), as cEs are thought to be either the extension to low luminosities of the family of giant ellipticals (Kormendy et al. 2009 and references therein) or not (Graham 2002).
Finally, physical characteristics of the dSph candidates are compared to galaxies of the same type in other groups and clusters. The dSphs are particularly interesting as they are supposed to be the faintest systems containing dark matter and can be used to constrain cold dark matter (CDM) models of galaxy formation (e.g. Peñarrubia, Navarro & McConnachie 2008, Peñarrubia et al. 2009). Due to their low surface brightness, they have mostly been studied in detail within the Local Group, like the ones surrounding the Milky Way or Andromeda galaxies (e.g. Belokurov et al. 2008; Kalirai et al. 2010).
This paper is based on photometric data obtained from CTIO-MOSAIC and VLT-FORS1 images of the central region of Antlia, and radial velocities measured from GEMINI-GMOS and MAGELLAN-MIKE spectra. Antlia is the third nearest well populated galaxy cluster after Virgo and Fornax. Before our studies on Antlia (Dirsch, Richtler & Bassino 2003; Bassino, Richtler & Dirsch 2008; Paper I; Paper II), the photographic work of FS90 was the last major effort devoted to study the faint galaxy content in this cluster. They identified, by visual inspection on photographic plates, 375 galaxies in their Antlia Group Catalogue down to mag. Among them, 252 are classified as dwarf galaxies or probable dwarf objects, 71 of which are found in our frames. Only 15 of these 71 galaxies had measured radial velocities at that moment. Our spectra have allowed us to add 23 new radial velocities to this sample (16 early-type and 3 late-type members plus 4 background galaxies), and to detect 5 previously unclassified new Antlia members. In addition, we have visually identified 16 unclassified galaxies displaying dE and dSph morphologies, extending the luminosity range of probable Antlia members down to mag.
Throughout this paper we will adopt as the Antlia distance modulus (Dirsch et al. 2003). It corresponds to a distance of 35.2 Mpc at which 1 arcsec subtends 170 pc. The paper is organized as follows. Section 2 describes our observational data and Section 3 presents our galaxy sample. In Section 4 we revisit the photometric relations of early-type Antlia galaxies including the new confirmed members and new dwarf galaxy candidates, and analyze the projected spatial distribution of the whole sample. Section 5 presents a discussion of the results and Section 6 our conclusions.
2 Observational Data
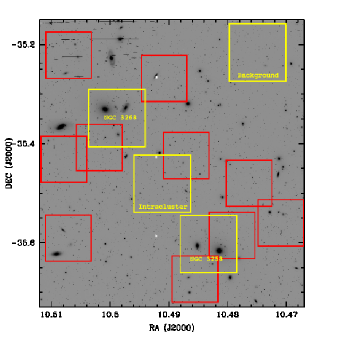
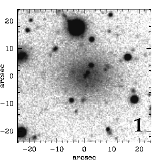
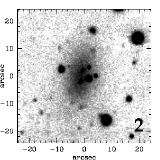
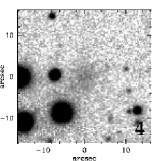
We have performed a visual search for new dwarf galaxy candidates on a Kron-Cousins image obtained with the MOSAIC camera (8 CCDs mosaic imager) mounted at the prime focus of the 4-m Blanco telescope at the Cerro Tololo Inter–American Observatory (CTIO), during 2002 April 4–5. This image, as well as a similar one taken in the band of the Washington photometric system, covers the central region of the Antlia cluster (see Fig. 1). This observational material has already been used in Paper I and in Paper II.
One pixel of the MOSAIC camera subtends 0.27 arcsec on the sky. This results in a field of view of arcmin2 (i.e. about kpc2 at the Antlia distance). The final / images were obtained from the combination of three/seven exposures of 600 sec. The seeing FWHM on these final images is 1 arcsec for the -image and 1.1 arcsec for the -image. magnitudes were transformed into Washington magnitudes through the calibration given by Dirsch et al. (2003).
Part of our galaxy identification was checked with FORS1–VLT images in the and bands. These images correspond to two fields centred on each of the Antlia dominant galaxies, NGC 3258 and NGC 3268, an intracluster field located between both giant galaxies, and a background field further away from them (see Fig. 1). We refer to Bassino et al. (2008) for more details on the observations and reduction. In addition, we examined ten GEMINI–GMOS images obtained in the r_G0326 filter for designing spectroscopic masks (programs ID: GS-2008A-Q-56, PI: T. Richtler; ID: GS-2009A-Q-25, PI: L. Bassino; ID: GS-2010A-Q-21, PI: L. Bassino). Each image covers a field of view of arcmin2 and their scale is 0.146 arcsec pixel-1. The total exposure time of each image is 500 sec and the seeing ranges from 0.6 to 0.7 arcsec.
We have also obtained GEMINI–GMOS multi-object spectra for the ten Antlia fields mentioned above (see Fig. 1), from which we measured radial velocities for several galaxies. The B600_G5303 grating blazed at 5000 Å was used with three different central wavelengths (5000, 5050 and 5100 Å) in order to fill in the CCD gaps. A slit width of 1 arcsec was selected; seeing was 0.5 - 0.6 arcsec in average. This configuration gives a wavelength coverage of 3500 - 7200 Å depending on the positions of the slits, and a resolution (fwhm) of Å. The total exposure times ranged between 2.5 and 3.7 hours. Data reduction was performed in a standard manner using the GEMINI.GMOS package within IRAF111IRAF is distributed by the National Optical Astronomy Observatories, which are operated by the Association of Universities for Research in Astronomy, Inc., under cooperative agreement with the National Science Foundation..
In addition, MAGELLAN-MIKE echelle spectra of the two compact elliptical galaxy candidates presented in Paper II (namely, FS90 110 and FS90 192) were obtained at the CLAY telescope of Las Campanas Observatory in 2009 March 27 and 28 (program LCO-CNTAC09A_042). Slits of arcsec and binning were used. The spectral coverage at the red side of the echelle spectrograph was 4900-10000 Å, with a resolution (fwhm) of Å. For FS90 110, two spectra of 900 sec and one of 2400 sec were obtained, and only one of 2400 sec for FS90 192. The reduction was performed using a combination of the IRAF imred.ccdred.echelle package, and the mtools package written by Jack Baldwin for dealing with the tilted slits in MIKE spectra (available at the LCO website).
Using the GEMINI-GMOS spectra, radial velocities were measured with the IRAF task fxcor by means of cross-correlation against simple stellar population (SSP) templates suitably selected from the MILES database (Sánchez-Blázquez et al. 2006). In Table 2 we list the error weighted average values, and the corresponding errors, obtained for each galaxy with the four templates used ([Z/H]= -0.71, 0.0; Ages 7.4 and 10.0 Gyrs). In the case of galaxies showing bright emission lines, these were used to check and refine the previously measured radial velocities. For the cE galaxy FS90 192 we obtained the radial velocity value by fitting gaussian profiles with the task splot within IRAF, to Hα and the Ca II triplet lines.
3 Characteristics of the Galaxy Sample
3.1 Confirmed Antlia members from the FS90 catalogue
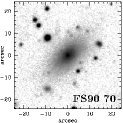
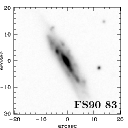
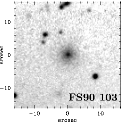
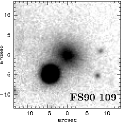
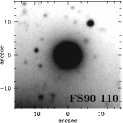
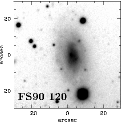
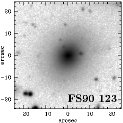
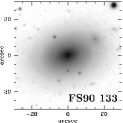
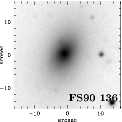
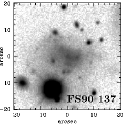
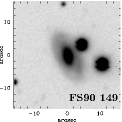
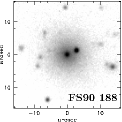
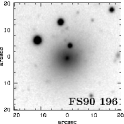
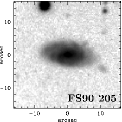
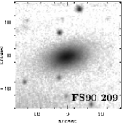
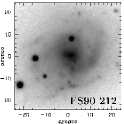
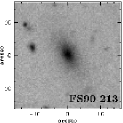
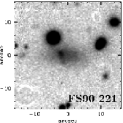
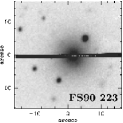
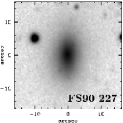
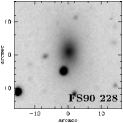
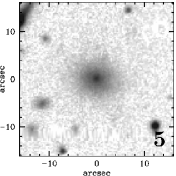
We have obtained new radial velocities for 23 FS90 galaxies. Among them, 20 have become new confirmed members of the Antlia cluster, and 3 are background galaxies. We recall that we consider as Antlia members all galaxies with radial velocities in the range 1200 – 4200 km s-1 (see Section 2 of Paper I for a justification). In Appendix A we present their coordinates, FS90 morphological classification and membership status as well as the measured radial velocities (Table 2). Logarithmically scaled images of these galaxies are shown in Fig. 5.
We recall that FS90 assigned to each galaxy listed in their Antlia catalogue a membership status: 1 for definite members, 2 for likely members and 3 for possible members. This assignment was based on morphological criteria as only 6 per cent of the listed galaxies had radial velocity determinations at the moment of the catalogue publication.
In general, we confirm the morphological/membership classification assigned by FS90. The exceptions are two cE galaxies (FS90 110 and FS90 192) that are new members of Antlia and were originally considered just as “possible” members, two galaxies originally classified as “possible” and “likely” dE members, which turned out to be an Antlia member (FS90 103) and a background systems (FS90 205), and a confirmed member but with a different (irregular) morphology (FS90 221). As expected, in some objects we are able to see features like nuclei, spiral arms or knots of star formation, thanks to the spatial resolution of our CCD images.
All status 1 galaxies of the spectroscopic sample became confirmed members, while only two of the 20 spectroscopically confirmed Antlia members were classified as status 3 galaxies by FS90 (FS90 110 and FS90 192, the new cE Antlia galaxies). Adding up the 23 FS90 galaxies with new radial velocities presented in this paper with the 37 already presented in Paper I, we have the following statistics: cluster membership is confirmed for 100% (31/31) of FS90 status 1 galaxies, 81% (13/16) of status 2 ones, and 54% (7/13) of status 3 objects. This agrees with previous works in the NGC 5044 Group (Cellone & Buzzoni 2005; Mendel et al. 2008), showing that morphologically assigned memberships are still reliable (mainly for diffuse dwarfs) out to distances of Mpc.
With the addition of the new data, we will revisit the photometric relations of early-type galaxies in the central region of Antlia considering spectroscopically confirmed FS90 members and FS90 galaxies with membership status 1 displaying early-type morphologies. This criterion will allow us to extend the CMR relation down to mag, minimizing contamination by background galaxies lacking radial velocities in this subsample.
We have measured with the task ELLIPSE within IRAF some galaxies presented with SExtractor (Bertin & Arnouts 1996) photometry in Paper I (see Table 5) in order to compare the measurements obtained with these two softwares (see Appendix C). As bright galaxies were all measured with ELLIPSE due to saturation in their central regions (see Paper I for details), we will consider these new photometry in our diagrams and in the different fits performed to the photometric relations.
3.2 New dE members
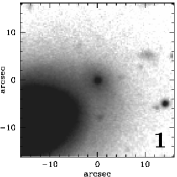
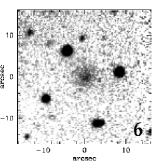
We have obtained radial velocities for five new Antlia members that were not in the FS90 catalogue. Their radial velocities and photometric parameters are given in Table 3. In Fig. 6 we show the logarithmically scaled images of these galaxies.
All of them show what seems to be a nucleus. This is a selection effect, as a bright central nucleus turns out to be necessary for obtaining reliable radial velocities from absorption-line spectra of faint diffuse galaxies. Our spectroscopic data include other low-surface brightness objects without nuclei for which it was not possible to obtain a redshift. Their photometric data were obtained through SExtractor or ELLIPSE, depending if the object was detected by the former software or not.
The new members are not catalogued in NED. Therefore, we will refer to them with the acronym ANTL followed by the J2000 coordinates, that is ANTL Jhhmmssddmmss, according to the IAU recommendations for designating new sources (see http://vizier.u-strasbg.fr/Dic/how.html).
3.3 New dE and dSph candidates without redshifts
We have performed a visual search on the MOSAIC image for new dwarf galaxy candidates based on morphological criteria. We looked for extended objects displaying low-surface brightnesses, that do not show substructure or evidence of star formation in the MOSAIC frame. For those objects falling into the deeper FORS and GMOS frames, we have also checked their morphologies by examining their appearance in these deeper images.
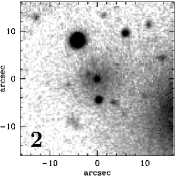
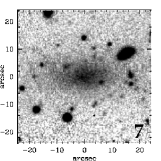
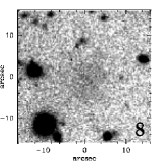
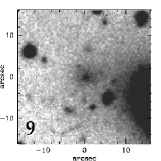
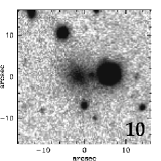
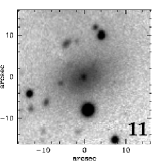
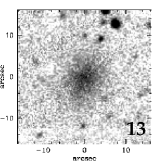
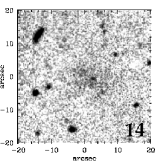
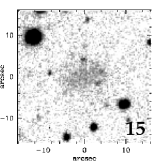
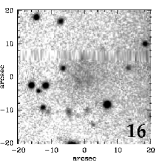
As these galaxies are not included in NED, we will designate them in the same way as new dE Antlia members. We present their images in Fig. 7. We obtained integrated magnitudes and colours for all but one of the 16 new dwarf systems (see Table 4). These measurements were performed in the way described in section 2 of Paper I through SExtractor and ELLIPSE, or with PHOT within IRAF. The seven candidates that have no structural parameters determinations are either too faint and diffuse, or are located near bright galaxies or stars which prevented a more exhaustive photometric analysis.
In particular, we are interested in identifying counterparts of Local Group dSph galaxies as they will represent the very faint end of the dwarf galaxy population in Antlia, certainly missed in the FS90 Antlia catalogue. Dwarf spheroidals are low luminosity () galaxies with smooth appearance, that present no evidence of star formation (Kalirai et al. 2010), have low optical surface brightness ( 22 mag arcsec-1) and no nucleus (Gallagher & Wyse 1994). We have identified 16 galaxies with morphologies consistent with faint early-type galaxies belonging to the cluster. Among them, 7 match the dSphs description; they are the ones designated with order numbers 4, 8, 12, 13, 14, 15 and 16 in Table 4.
4 Results
4.1 Colour-Magnitude Relation
| Sample | Data | |||||
|---|---|---|---|---|---|---|
| observed | intrinsic | |||||
| All definite+confirmed members | 58 | 0.10 | 0.03 | 0.09 | ||
| Dwarf definite+confirmed members | 43 | 0.11 | 0.04 | 0.10 | ||
| E definite+confirmed members | 42 | 0.10 | 0.04 | 0.09 | ||
| All confirmed members | 42 | 0.09 | 0.03 | 0.08 | ||
| Bright confirmed members | 15 | 0.06 | 0.02 | 0.06 | ||
| Dwarf confirmed members | 27 | 0.10 | 0.03 | 0.09 | ||
| Dwarf confirmed members no cEs | 25 | 0.08 | 0.03 | 0.07 | ||
| E confirmed members | 26 | 0.09 | 0.03 | 0.08 | ||
| E confirmed members no cEs | 24 | 0.07 | 0.03 | 0.06 | ||
| S0 confirmed members | 16 | 0.08 | 0.02 | 0.07 |
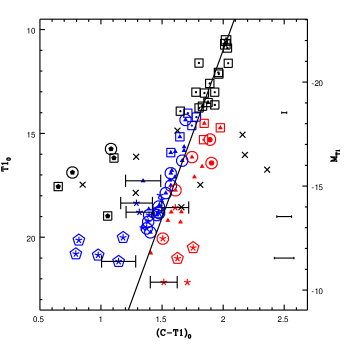
In Fig. 2 we show the CMR defined by FS90 early-type galaxies that are spectroscopically confirmed Antlia members or were considered as definite members (status 1) in the FS90 Antlia catalogue. We have added the new dwarf galaxies presented in the previous section. Several biweight fits to the observed relation have been performed, some of them considering only spectroscopically confirmed members (see Table 1). Following Grebel (2005), we will consider as dwarf galaxies those with mag, which corresponds to mag at the Antlia distance (see table 3a from Fukugita, Shimasaku & Ichikawa 1995). In order to test the results found by Barazza et al. (2009) in Abell 901/902 regarding the existence of a colour–density relation in the projected radial distribution, we divided our dwarf galaxy sample into systems displaying redder and bluer colours than the mean CMR.
From Fig. 2 and Table 1, we can see that spectroscopically confirmed members define a tight relation down to mag with no change of slope or increase in the scatter. The new dwarf galaxy candidates seem to extend the relation down to mag, although introducing a considerable dispersion in the CMR at its very faint end. In particular, dSph candidates tend to increase the scatter towards bluer colours than the mean relation. In comparison with the results presented in Paper I, the CMR gets slightly steeper with the addition of the new confirmed members. When FS90 non confirmed members are included in the fit, both the slope of the CMR and its scatter increase.
The selection of the spectroscopic targets was performed independently of their location in the photometric relations analyzed in this paper. The GEMINI-GMOS fields were chosen to include as many FS90 galaxy candidates as possible. Therefore, it is remarkable that all early-type confirmed members suite so well in the CMR. In addition, we can see that spectroscopically confirmed background galaxies included in the FS90 Antlia catalogue, as well as dI and BCD confirmed members, would introduce a substantial dispersion to the relation if they were wrongly considered as early-type cluster members.
The new confirmed cE galaxies share the same CMR as “normal” early-type dwarf galaxies. However, as can be seen from the data included in Table 1, they increase the dispersion of the relation defined by dwarf confirmed members towards the red side of the colour-magnitude diagram. When these peculiar galaxies are excluded from the fit, faint early-type members define a CMR with a similar scatter to that traced by bright ones. The location of both cEs in the CMR diagram is consistent with a luminosity fading ( mag for FS90 110, and mag for FS90 192) at constant colour.
4.2 Surface brightness-Luminosity Relation
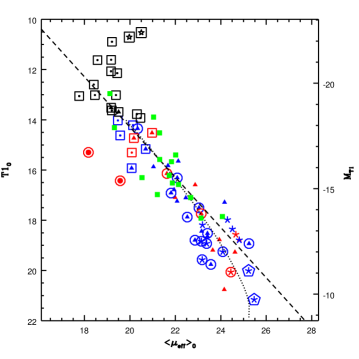
In Fig. 3 we present the revised luminosity– relation of FS90 Antlia definite and confirmed members, and new dwarf candidates and members. We show, as a dashed line, the locus of constant effective radius ( kpc) found for galaxies fainter than mag in Paper I. Recall that lines parallel to this locus towards fainter luminosities correspond to smaller effective radii (see eq. 1 in Paper I).
For our new sample of dwarf early-type members and candidates, we obtain a mean effective radius of (rms 0.31) kpc, considering 57 galaxies with mag and excluding the two cEs which represent extreme cases. However, we see that both FS90 and new confirmed members fainter than mag tend to depart from the linear relation towards smaller effective radii. When only dwarf galaxies in the range are considered, the mean effective radius increases to (rms 0.28) kpc.
One possible explanation for the faint break is that it arises due to the isophotal limit of our photometry, which causes different fractions of galaxy luminosity to be lost outside the limiting isophote for galaxies with different profile shapes. In order to quantify this effect, we considered a set of Sérsic models spanning an appropriate magnitude range, with shape parameters () following the luminosity – shape relation given by Graham & Guzmán (2003, see their fig. 10). We fixed the effective radii of all the models at 1 kpc (5.87 arcsec at the Antlia cluster distance), and we then computed for each model the fraction of light lost outside the limiting radius, and the effective radius “measured” from the truncated profile (see Trujillo, Graham & Caon 2001, for the relevant expressions). We thus obtained for each model the values of isophotal magnitude and mean effective surface brightness that would be measured from a truncated profile.
We show the results in Fig. 3, where the dotted line follows the isophotal magnitude versus mean effective surface brightness relations for Sérsic models truncated at isophotal radii corresponding to 26.0 mag arcsec-2. While profile truncation always leads to a magnitude dimming and a lower measured , low (i.e., fainter) galaxies are more strongly affected than galaxies with . This gives a curved relation in the observed magnitude vs. mean effective surface brightness plane, which should be a straight line for galaxies with the same effective radius. Then, the downturn of the relation for our dwarfs at faint galaxy magnitudes may be attributed to this effect, corresponding to our limiting isophote of about 26.0 mag arcsec-2. The same departure towards fainter magnitudes of the dwarfs at the faint end of this relation, with respect to the general trend, is present in the compilation from different environments by De Rijcke et al. (2009).
Both cE galaxies clearly depart from the locus of constant effective radius but, at first glance, in a different manner. FS90 110 seems to extend the break defined by the brightest galaxies towards fainter magnitudes, but FS90 192 is located with the bulk of early-type dwarf galaxies defining what could be their low limiting . If we calculate for their luminosities the corresponding on the locus of kpc, we obtain that they differ from the measured values in mag arcsec-2 for FS90 110, and mag arcsec-2 for FS90 192. Therefore both cE galaxies depart from the trend defined by early-type dwarf galaxies in a similar manner, defining what could be a photometric criterion to identify candidate cE galaxies. Alternatively, the location of the cEs with respect to the surface brightness-luminosity relation can be judged as consistent with a stripping scenario.
The luminosity–effective radius diagram presented by Barazza et al. (2009) in Abell 901/902 (their fig. 2a), shows that their galaxies scatter about a mean constant effective radius. In Figure 3, the galaxies located below the dashed line have kpc and those found above the line, . We see that early-type dwarfs in the central region of Antlia, either redder or bluer than the colour of the mean CMR, show similar effective radii, in agreement with Barazza et al.’s findings. In particular, red dwarfs (excluding the two cEs, 16 galaxies) display a mean effective radius (rms 0.34) kpc, while blue dwarfs (33 systems), (rms 0.30) kpc.
We have also plotted, with green squares, the data corresponding to the study of the early-type galaxy population in poor groups performed by Annibali et al. (2011). The bright and faint early-type systems in these groups, follow the same luminosity– relation as Antlia galaxies with a similar scatter.
4.3 Projected Spatial Distribution
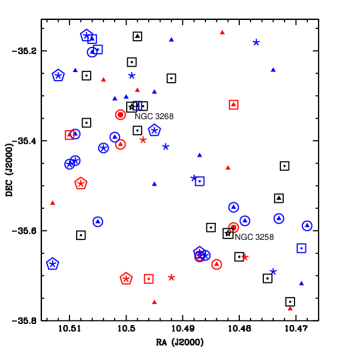
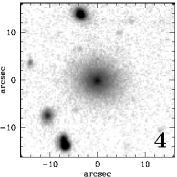
In Fig. 4 we show the location of our galaxy sample in the MOSAIC field. Two concentrations of galaxies are present around NGC 3258 and NGC 3268, respectively, with a poorly populated zone between them. Both concentrations are similar in number of galaxies, contain several bright lenticulars, and in each of them there is a cE galaxy placed in the neighbourhood of the dominant system.
Barazza et al. (2009) have shown that redder dwarf early-type galaxies in Abell 901/902 are located closer to the central cluster galaxies than bluer ones of similar luminosity. In our case the mean distances of the dwarfs to each one of the two dominant galaxies (the closer one) are: 8.0 (rms 4.8) arcmin for the 20 dwarfs redder than the mean CMR at the same luminosity, and 7.7 (rms 4.3) arcmin for 37 dwarfs bluer than the mean CMR. If we consider the luminosity ranges , and , we obtain, respectively, mean distances of 8.2 (rms 6.1) arcmin (7 red dwarfs) and 8.4 (rms 4.8) arcmin (12 blue dwarfs), 8.3 (rms 5.6) arcmin (7 red dwarfs) and 7.6 (rms 4.5) arcmin (20 blue dwarfs), and 7.4 (rms 2.0) arcmin (6 red dwarfs) and 5.9 (rms 1.1) arcmin (5 blue dwarfs). Therefore, we do not find a clear trend in the sense of that reported by Barazza et al. However, this differences are rather marginal, and should be tested with a larger sample including the outer regions of Antlia.
5 Discussion
5.1 Colour-Magnitude Relation
5.1.1 Interpretation
The CMR of early-type galaxies in groups and clusters of galaxies is a well known photometric relation that has been studied for long. In the colour-magnitude diagram, early-type galaxies define a sequence in the sense that bright galaxies are redder than fainter ones. The physical interpretation of this feature has been the subject of numerous observational and theoretical studies. While luminosity or brightness can be easily associated with the (stellar) mass of a galaxy, the well known age-metallicity degeneracy prevents a clear physical identification for integrated colours.
From the study of photometric indices correlated with line strenghts for 31 elliptical galaxies belonging to pairs or small groups, Faber (1973) has found that, for the redder galaxies of the sample, the differences in integrated colours are correlated with variations in abundances. In a more recent work, Terlevich et al. (1999) have studied the , , and spectral absorption line indices of 101 galaxies in the Coma cluster. They found that the CMR in Coma is mainly driven by a luminosity–metallicity effect. This is consistent with the results of Trager et al. (2000) about Fornax and Virgo elliptical galaxies. They are basically old stellar systems and define a mass–metallicity trend, in contrast with field ellipticals, where age and -element fraction may be more strongly correlated with stellar mass than overall metallicity. This finding for field galaxies is confirmed by Howell (2005); however, his sample covers a small luminosity range which strongly limits any analysis of correlations involving absolute magnitudes.
Clemens et al. (2011) show the mid-IR CMR for early-type galaxies in the Virgo cluster with absolute K-band magnitudes between -26 and -19. By comparing their results with those of optical studies, they conclude that the CMR is driven by metallicity effects, as a mass–age relation would produce a slope in the opposite sense to that observed. Observations of clusters at intermediate redshift showed that the slope of the CMR display small variations with redshift (Jaffé et al. 2011, and references therein).
Hence, although other stellar population parameters like age and -element fraction are shown to depend on the luminosity of early-type galaxies, and this behaviour is shown to depend on the environment, a clear mass-metallicity relation holds through different environments, from rich clusters to the Local Group, spanning more than 5 decades in (e.g. Mendel et al. 2009).
Within the discussion of the CMR in Antlia it may be thus interesting to turn, as a comparison, to the NGC 5044 group, a relaxed galaxy aggregate intermediate between small groups and rich clusters (Forbes 2007), where early-type galaxies are also found to follow a well-defined CMR spanning mag in luminosity (Cellone & Buzzoni 2005). A spectroscopic analysis relying on Lick indices (Mendel et al. 2009) shows that, among different stellar population parameters, metallicity displays the strongest correlation with stellar mass. There is, however, a clear decoupling between Fe and the -elements (mostly traced by Mg and Ca) which extends down to the dE mass range (see also Buzzoni et al. 2011). This behaviour confirms and extends previous results which point at different enrichment channels acting along the mass sequence of early-type galaxies in groups and clusters, as a consequence of different star-formation efficiencies taking place at different masses. Age effects, although playing a minor role, are certainly present, as witnessed by a small number of “blue-nucleus” dEs with Balmer emission lines in their spectra (e.g. Cellone & Buzzoni 2001; Lisker et al. 2006).
At the lowest stellar-mass extreme, it is expected that dSph’s, like their Local Group counterparts, have experienced complex star-formation histories (e.g. Tolstoy et al. 2009, and references therein). A low metal content is, however, their general characteristic, and should be the main driver of their optical integrated colours.
Therefore, despite the identification of the physical mechanisms involved in defining the CMR is still an open issue, there is strong evidence that the CMR should be mainly interpreted as a mass–metallicity relation.
5.1.2 Observed characteristics
It is widely accepted that the CMR is linear along its extension, and that it shows no perceptible change of slope from the bright galaxies to the dwarf regime (Secker et al. 1997; Terlevich et al. 2001; López-Cruz et al. 2004; Andreon et al. 2006; Paper I; Misgeld et al. 2008, 2009). In addition there is strong evidence for the universality of this relation in clusters of galaxies.
Bower, Lucey & Ellis (1992) have found that early-type galaxies in Virgo and Coma present identical and colours, following the same linear CMR. Conselice et al. (2002) found, for the Perseus cluster, a fit to the bright end of the CMR in agreement to that derived by Secker et al. (1997) for the Coma cluster. In Paper I we have obtained a linear fit to the CMR of the Antlia cluster with a slope in agreement with those found for dwarf galaxies in Virgo (Lisker, Grebel & Binggeli 2008), Fornax (Hilker, Mieske & Infante 2003; Mieske et al. 2007), Perseus (Conselice et al. 2002) and Coma (López-Cruz et al. 2004). De Rijcke et al. (2009) have shown that early-type galaxies belonging to different clusters and groups do follow the same colour-magnitude relation. Moreover, in Perseus (Penny et al. 2011) and Coma (Terlevich et al. 2001) it has been found that the CMR keeps constant as a function of radius within the cluster. In particular, the CMR of Perseus has slope and zero point consistent with those reported for Fornax (Mieske et al. 2007), Hydra I (Misgeld et al. 2008) and Centaurus (Misgeld et al. 2009). Such linearity and universality led several authors to use the CMR as a reliable distance indicator (Sandage 1972) and to suggest that the origin of this relation in galaxy clusters is independent of the environment (Paper I; Misgeld et al. 2008; De Rijcke et al. 2009).
However, for the Virgo cluster, Janz & Lisker (2009) have obtained an S-shaped CMR that seems to be consistent with the non-linear relation found by Ferrarese et al. (2006) for the same cluster. In addition, it is still under discussion whether there is a genuine (i.e., with a physical origin) increase in the scatter of the CMR towards its faint end or, instead, the larger scatter can be accounted for by photometric or classification errors and/or background galaxies contamination.
In the Perseus cluster, Conselice et al. (2002) have found a significant spread ( 0.5 mag) around the mean CMR, in the colours of galaxies with mag. They argued in favor of a physical origin of this scatter, pointing to differences in metal abundances and formation scenarios among blue and red low mass cluster galaxies. From a more recent spectroscopic study of the faint population of Perseus, Penny & Conselice (2008) have found that most of the red and blue galaxies responsible of the scatter are in the background. However, there is still an increase in the colour dispersion of confirmed members with mag, in comparison with brighter ones. Janz & Lisker (2009) found an increase of the scatter about the CMR at intermediate brightness, while for the brighter and fainter galaxies the scatter is interpreted as due to photometric errors. The authors conclude that the increase at intermediate luminosities confirms the fact that, in Virgo, dwarf and bright early-type galaxies do not share one common linear CMR.
On the contrary, from a thorough morphological identification of the galaxies included in the Coma CMR, Terlevich et al. (2001) have found no detectable increase in the colour dispersion all along the early-type galaxies’ relation. When spiral and irregular galaxies, as well as unclassified objects, are plotted in the same colour–magnitude diagram, they introduce a considerable scatter towards the blue side of the relation at intermediate and low luminosities. Andreon et al. (2006) have obtained a thin ( 0.04 mag) CMR in Abell 1185, with a scatter that does not increase with magnitude. López-Cruz et al. (2004) have found, for 57 X-ray detected Abell clusters in the redshift range , a universal CMR with an average colour dispersion of mag. They noticed that the cluster displaying the largest scatter in its CMR (0.5 mag at mag) presents background contamination from higher redshift clusters. These authors also pointed out that photometric errors could become an important source of dispersion in the relation (see, also, Secker et al. 1997). In the Hydra (Misgeld et al. 2008) and Centaurus (Misgeld et al. 2009) clusters a larger colour scatter has also been found for faint early-type galaxies, in comparison to luminous ones. However, such increase is considered as due to photometric errors and it is shown that dubious members of the cluster and background galaxies can introduce significant dispersion in the relation. Recently, Jaffé et al. (2011) have found that 172 early-type confirmed members of 13 clusters and groups with redshifts , define tight CMRs with a small intrinsic colour scatter ().
5.1.3 The CMR in Antlia
The CMR of spectroscopically confirmed Antlia members displays the most common features found for this relation in other nearby and distant clusters of galaxies. That is, it spans almost 10 magnitudes with no perceptible change of slope or increase in its scatter towards faint luminosities. When unconfirmed members and confirmed background galaxies are introduced in the relation, it displays a larger colour dispersion, not only in its faint end but also at intermediate luminosities. In fig. 2b of Paper I we included in the same colour–magnitude diagram FS90 galaxies with spiral and irregular morphologies, some of them with spectroscopically confirmed membership. These objects introduced considerable dispersion towards the blue side of the relation, in agreement with the results of Terlevich et al. (2001).
The revised slope of the relation for all definite members is steeper than that found in Paper I. However, this value is in agreement with the one found in that paper for the bright end of the relation. Therefore, the bright galaxies seem to define the slope of the relation and when confirmed early-type dwarf members are included in the analysis, the faint galaxies follow a relation with a similar slope and scatter. This steeper value for the slope of the CMR of Antlia is still consistent with those reported for other galaxy clusters.
The computed intrinsic scatter of the relation is when only confirmed members are considered. Following Terlevich et al. (2001, see their eq. 1), we calculate the intrinsic scatter as , where is the mean colour error of the sample. If we translate our intrinsic dispersion to colours through (see eq. 8 in Forte, Faifer & Geisler 2007), we obtain which is similar to the mean value obtained by López-Cruz et al. (2004) for clusters with , and consistent with the value obtained by Penny & Conselice (2008) for the CMR of Perseus at the bright end ().
If we take into account that (Geisler 1996), we can use the relation (see eq. 1 in Harris et al. 2002) and we obtain which is a lower value than that obtained by Andreon et al. (2006) in Abell 1185 (). In the Centaurus cluster, Misgeld et al. (2009) have found intrinsic scatters of 0.06, 0.09 and 0.14 in three different magnitude intervals. Using (see the first equation in Forbes & Forte 2001), these values translate in 0.12, 0.18 and 0.28, much higher than our common value for the whole Antlia CMR. For the Hydra cluster, Misgeld et al. (2008) have found a mean scatter for the relation of which is equivalent to .
5.1.4 cE’s location in the CMR
Regarding the positions in the colour-magnitude diagram of the confirmed Antlia cEs, they can be compared with those displayed by the cE galaxies recently identified in Centaurus (Misgeld et al. 2009) and Coma (Price et al. 2009, see also Chiboucas et al. 2010). Centaurus’ cEs are located within the CMR on its red side, in a similar manner to Antlia’s cEs (see fig. 3 in Misgeld et al. 2009). Despite all confident Coma’s cEs (namely, CcGV9a, CcGV19a and CcGV19b) are found on the red side of Coma’s mean CMR, only one of them shows a similar location to those found in Antlia and Centaurus (that is, within or near the general trend), while the other two display a considerable offset from the mean relation towards redder colours and/or fainter brightnesses (see fig. 2 in Price et al. 2009).
Coma’s cEs have age and abundances estimations. All three galaxies are coeval within the age estimation errors. CcGV9a and CcGV19b present similar colours, and similar [Fe/H] and [Mg/Fe] abundances, while CcGV19a is the reddest cE galaxy in the association, with the highest [Fe/H] and [Mg/Fe] values. Therefore, the different locations of these three cEs in the colour–magnitude diagram can be explained through abundance differences and/or luminosity fading.
In this context it is interesting to point out that Faber (1973) noticed that a small number of peculiar dwarf ellipticals are known that are quite red and have unusually high surface brightness and that these objects clearly do not fit into the sequence of normal ellipticals. Moreover, Faber considered that these systems are in fact remnants of tidal encounters with more massive companion galaxies.
5.1.5 The scatter of the CMR
Given the universality of the CMR in clusters of galaxies, if the increase in the scatter at low luminosities has a physical origin, it should be observed at the same absolute magnitude in all cases. Secker et al. (1997) have obtained a CMR for the Coma cluster with a scatter that increases faintwards from mag, corresponding to mag with a distance modulus . In the Perseus cluster, the scatter increases significantly at mag (see fig. 3 in Penny & Conselice 2008). By means of the transformations given by Fukugita et al. (1995), this is equivalent to mag. In Fornax, Hilker et al. (2003) and Mieske et al. (2007) have found an increase of the CMR scatter at mag or mag. In Hydra, the increase in the scatter is significant from mag (fig. 10 in Misgeld et al. 2008) or mag. In Centaurus, from mag or mag (fig. 3 in Misgeld et al. 2009). In Virgo, the peak of the dispersion is found at mag which is equivalent to mag. In our case, the faintest Antlia confirmed members and candidates introduce a detectable dispersion increase starting from mag.
Therefore, in all these clusters, the increase of the scatter starts at different absolute magnitudes, which tend to be brighter for more distant clusters, if Virgo is excluded from the sample. This trend could be interpreted as a diminishing of the precision of the photometric data and a more uncertain morphological/membership classification as we go to more distant clusters.
From the analysis performed in 5.1.3, it might be inferred that, once photometric errors are discounted, different CMRs obtained using metallicity sensitive colours, like and , display fairly low intrinsic dispersions ( mag).
Several processes have been proposed as responsible for the intrinsic scatter of the relation (e.g., differences in ages, Terlevich et al. 1999, Ferreras & Silk 2003, Romeo et al. 2008; minor mergers, Kaviraj et al. 2009; accretion of small amounts of gas at high redshifts, Pipino & Matteucci 2006). Whatever the process dominating the intrinsic scatter is, from our comparison we could say that it arises with similar strength in different clusters. In this sense, Jaffé et al. (2011) have found a colour scatter with no evolution with redshift or correlation with the velocity dispersions of the clusters included in their analysis.
5.2 Luminosity– Relation
5.2.1 Antlia’s relation
As it was shown in Section 4.2, in a plot of magnitude versus , FS90 early-type dwarf members of Antlia follow the locus of constant effective radius of 1 kpc down to mag. Fainter FS90 members tend to deviate from this locus towards smaller radii. All of the new dwarf galaxy members, which have luminosities fainter than mag, show the same behaviour. The mean effective radius of the confirmed members with mag is (rms 0.26) kpc. Therefore, there seems to be a faint limit in magnitude for the constant effective radius relation followed by dEs.
We have already mentioned that this could be due to the isophotal limit of our photometry. It is possible that we are not reaching the most external regions of the galaxies as they are embedded in the background. Many of these faint objects are located near brighter galaxies as well. In this way, our effective radius could be underestimated for galaxies fainter than mag ( mag, Fukugita et al. 1995), leading to the apparent discontinuity or “break” in this relation.
However, Chiboucas, Karachentsev & Tully (2009) have found that newly discovered dwarf galaxies in the M81 Group ( Mpc), have effective radii in agreement to those found for the new dwarf galaxies in Antlia, i.e. kpc (see their table 3). Local Group dSphs have kpc, as well (Zaritsky, González & Zabludoff 2006, and references therein). Cellone & Buzzoni (2005) as well as De Rijcke et al. (2009) found a similar trend to our faint break, in their respective samples of dwarf galaxies. Therefore, we cannot rule out the possibility that the luminosity vs. relation, corresponding to a mean constant effective radius of kpc, presents two physical breaks: one at magnitudes brighter than mag, and another at its faint end, at magnitudes fainter than mag. We recall that the correlation between luminosity and for magnitudes brighter than mag corresponds to the Kormendy (1977b) scaling relation defined by bright Es and bulges of S galaxies on the vs. diagram. This is a projection of the Fundamental Plane of E galaxies.
As mentioned above in this section, most of the galaxies fainter than the low luminosity break are located near brighter ones. The smaller found in our faint candidates might then be related with tidal effects. The newly confirmed cE galaxies deviate from the locus followed by the rest of early-type dwarfs of similar luminosities towards smaller effective radii, as well. They are companions of the giant ellipticals that dominate the central region of the cluster. In Paper II we showed that one of them, FS90 110, displays a low surface brightness bridge that links it with NGC 3258, confirming the existence of an interaction between both galaxies. Surface brightness profiles displaying a break, as is the case of FS90 110 (see Paper II) would favour this interpretation (Choi et al. 2002; Mieske et al. 2006).
5.2.2 Dichotomy between E and dE galaxies
Graham & Guzmán (2003) have argued that, with the exception of the very bright galaxies (, , i.e. “core” E), the break at the bright end of the luminosity versus relation is not due to different formation mechanisms among dwarf and bright E galaxies. They emphasize that both type of galaxies display continuous trends in the central surface brightness () versus luminosity plot, and in the Sérsic index (Sérsic 1968) versus luminosity diagram. This would show that dEs are the low-luminosity extension of E galaxies. Graham & Guzmán explain the different behaviour of Es and dEs in the luminosity– space, as due to an increasing difference between and values with increasing as we go from dE to E (without core) systems (see their figures 11 and 12).
On the contrary, Kormendy et al. (2009) sustain the existence of a dichotomy between dE (spheroidal galaxies in their paper) and E galaxies pointing to distinct origins. The fact that E and dE follow similar correlations would indicate that the parameters involved in such relations are not sensitive to the physics that makes them different. Therefore, these authors consider that to distinguish galaxy types it is necessary to use all parameter correlations and find out which ones are sensitive to formation mechanisms. From an extensive analysis, Kormendy et al. conclude that E galaxies form via mergers being cE galaxies their low luminosity counterparts, while dE are late-type galaxies transformed by environmental effects and by energy feedback from supernovae.
In this context it is interesting to point out the top panel of figure 1 in the work by Chilingarian et al. (2009). There the authors show the location in the –luminosity diagram of all cEs detected by them with the Virtual Observatory (21 objects), along other confirmed cEs and early-type systems. It can be seen that M 32 seems to extend the locus defined by bright early-type galaxies towards brighter values of (or smaller ). But the rest of the cEs included in the plot seem to define a parallel sequence to that of dEs and dS0s, towards brighter . Simulating the interaction of a disk galaxy with a galaxy cluster potential, Chilingarian et al. (2009) also found that tidal stripping can reduce the stellar mass of the galaxy and speculate that low-luminosity objects could be the progenitors of cEs. Considering that most (if not all) cEs are companions of brighter galaxies, it might be interpreted that the offset of different cE galaxies from the dE/dS0 sequence depends on the degree of interaction experienced by the system and/or on the morphology of the progenitor. In this sense, cE galaxies would not be thought as the natural extension of the family of giant ellipticals towards low luminosities, as the origins of both populations would be quite different. It is worth noting that our two cE galaxies also seem to lie along a sequence parallel to that of dEs rather than to follow the trend of bright ellipticals.
It is clear that the interpretation of the behaviour of bright and dwarf early-type galaxies in the luminosity– diagram is an open question. Our present results for the Antlia cluster do not show any discontinuity between bright and dwarf ones in this diagram, but it should be taken into account that bright early-type galaxies in Antlia are mainly lenticulars, not ellipticals. In addition, we should enlarge the photometric sample at the low-luminosity end before arriving at sensible conclusions.
At the moment, it is not possible to discern if keeps almost constant from the faint break towards fainter magnitudes, or if the effective surface brightness increases with decreasing luminosity, showing a similar trend to that displayed by E galaxies. However, it is remarkable the good match showed by the galaxies belonging to poor groups to the locus of constant effective radius defined by Antlia’s systems. This fact is pointing to a relation that arises with similar characteristics in very different environments.
5.3 Projected Galaxy Distribution
X-ray observations of the Antlia cluster (Pedersen, Yoshii & Sommer-Larsen 1997; Nakazawa et al. 2000), have shown that the X-ray diffuse emission is elongated in the direction defined by a line joining both dominant galaxies. Studies of the globular cluster systems of NGC 3258 and NGC 3268 (Dirsch et al. 2003; Bassino et al. 2008) have revealed that these systems display an elongated distribution in the same direction. These results may be the consequence of tidal forces between both galaxies, which may be ultimately pointing to an ongoing merger in the central region of Antlia. Thus, the two structures found in this region (Fig. 4) might be two groups in interaction: one with NGC 3258 as dominant galaxy, and other with NGC 3268 as the central galaxy, both of them containing a cE galaxy. More radial velocities from galaxies in the outer regions of Antlia are needed to confirm this hypothesis.
We have shown in Section 4.3 that there is no conclusive evidence of the existence of a colour–density relation in Antlia in the sense reported by Barazza et al. (2009) for Abell 901/902. These authors propose that the existence of this relation in the projected radial distribution is an indication that the formation of dEs is closely related to the processes that affect the cluster itself, like ram-pressure stripping and harassment. The ram-pressure stripping would remove more efficiently (and faster) the interstellar medium of galaxies located closer to cluster centres. That may affect star formation in a way that these galaxies would have, on the average, an older stellar population and thus be redder than galaxies located further away from the cluster centres.
The harassment scenario predicts a colour gradient in terms of effective radius (Mastropietro et al. 2005), in the sense that bluer (outskirts) galaxies display larger than the redder (central) ones. In agreement with Barazza et al. results, we do not find a relation between colour and effective radius. In this context, as the early-type dwarf galaxy populations of Antlia and Abell 901/902 do not show such a gradient, the harassment process seems not to be a dominant one in these associations. Bosselli et al. (2008) have also found that the lack of correlations with clustercentric distances in the scaling relations favours a ram-pressure stripping scenario for the evolution of the galaxies.
5.4 dSph candidates in Antlia
Our selection of the low luminosity dSph candidates in Antlia was mainly based on their limiting magnitude ( mag, Kalirai et al. 2010) and morphology (diffuse appearance and no nucleus). Local Group counterparts of these objects are also devoid of gas and dominated by old and intermediate-age stars. Their extended sizes, low luminosity and measured velocity dispersions, as well as their large mass-to-light ratios, point to dSph being objects with large amounts of dark matter (e.g. Mateo 1998).
Our new dSph candidates have integrated magnitudes in the range mag, which corresponds to . In agreement with the tidal origin proposed for dSph galaxies (e.g. Peñarrubia et al. 2009) they appear to cluster tightly around massive galaxies. In the Local Group, most dSphs are located within a radius of 300 kpc from the Milky Way and M 31 (Gallagher & Wyse 1994; Grebel 2005). Though our dSph candidates sample in Antlia is in fact small, their positions displayed in Fig. 4 and identified by open pentagons, place them close to the two giant dominant galaxies or to bright lenticulars, all of them confirmed cluster members. Their average projected distance to the closest bright galaxy (with mag) is arcmin, which at the Antlia distance correponds to about 65 kpc.
Regarding their sizes, the study of dSphs in M 31 by McConnachie & Irwin (2006b) has shown that their tidal radii ( kpc) are about twice as extended as their counterparts in the Milky Way. The classical dSphs (i.e., not including the newly discovered ultra faint dwarfs) surrounding the Milky Way have tidal radii in the range kpc to 3 kpc (Irwin & Hatzidimitriou 1995). Even their spatial distribution is different, being the Milky Way satellites more clustered around their host than those of M 31 (McConnachie & Irwin 2006a).
Globally, we can consider that tidal radii of Local Group dSphs range from 0.5 to 7 kpc, which correspond to 3 - 45 arcsec at the Antlia distance. From Table 4, we can see that the Antlia dSph candidates display total radii in the range 5 - 11 arcsec, that is within the expected values if we compare to the Local Group ones, though in the range of the smaller sizes. This can be understood like a selection effect, as it would be even more difficult to detect larger, but more diffuse, galaxies at the Antlia distance.
6 Summary and Conclusions
In this paper we have deepened our study of the galaxy populations in the
central region of the Antlia cluster, paying particular attention to the
faint systems composed by dwarf ellipticals and dwarf spheroidals. We have
obtained radial velocities for a total of 28 faint galaxies ( mag) located in this region through GEMINI-GMOS and MAGELLAN–MIKE
spectra. With these new information, we have improved the colour-magnitude
and surface brightness vs. luminosity relations originally studied in Paper I,
and we have analyzed the projected spatial distribution of the whole galaxy sample,
presenting Washington photometry for 5 new confirmed members from the FS90
catalogue as well as for 16 new low surface brightness candidates that have
never been catalogued before. Total and/or effective radii have been
measured for the 5 new members and the 16 new candidates except one. In
addition, images in the band are shown for all the galaxies with new
radial velocities and the 16 new candidates. Our main conclusions are as
follows:
- Early-type galaxies in the Antlia cluster follow a
tight colour-magnitude relation that extends, with no perceptible
change of slope, from the giant ellipticals down to the dSphs
spanning almost 12 magnitudes in luminosity. When only confirmed
early-type members are considered, we find no significant increase
in the scatter towards the faint end of the relation. When the
intrinsic scatter of the CMR of Antlia is compared with those
of other groups and clusters’ CMRs, it is found that Antlia’s CMR is
one of the tightest relations reported up to now. We suggest that
this finding is related with the use of a metallicity sensitive
colour index like .
- The five previously unknown early-type Antlia members and the 16
new candidates follow the same photometric relations as the FS90 early-type
members and candidates, although introducing some dispersion. In particular,
the new dwarf candidates increase the scatter of the CMR towards its faint
end. These new dwarf members and candidates also depart, towards smaller
effective radii, from the surface brightness vs. luminosity relation traced
by FS90 dE galaxies with that follow the locus of constant
effective radius of kpc. This latter effect could be due to the
isophotal limit of our photometry. However, similar sizes ( kpc) have been reported for faint members of the Local Group, M 81 and
NGC 5044 groups. Therefore, there seems to exist a physical brightness
limit for the relation corresponding to constant effective radius, a
relation that seems to arise in different environments as it has been found
in clusters like Virgo and Coma (see fig. 5 in Paper I) as well as in poor
groups.
- With regard to the possible existence of a discontinuity between
bright and faint ellipticals in the surface brightness vs. luminosity
relation (e.g. Graham & Guzmán 2003; Kormendy et al. 2009), our results for the Antlia
cluster do not show any gap in this diagram. It should be taken into account
that the bright early-type galaxies in Antlia are mostly lenticular galaxies
and few ellipticals.
- The dE galaxies with present an almost constant
effective radius around kpc,
irrespective if their colours are bluer or redder than that of the mean CMR for
the same luminosity. The almost constant effective radii of dEs are in
agreement with what has been found for other clusters and groups
(Paper I and references therein). For galaxies fainter than mag
the mean value decreases to kpc, which
is consistent with what is found for the faintest galaxies in the Local Group,
M81 and NGC 5044 groups.
- We have not found a colour–density or a colour–size relation among
our Antlia dwarf galaxy sample. This behaviour might favour a ram-pressure
stripping scenario for the evolution of dwarf galaxies in this cluster. However,
we should confirm these trends by enlarging our dwarf galaxy sample considering
dwarf galaxies present in the outer regions of the cluster.
- We have confirmed the existence of two cE galaxies in Antlia.
Each of them is the neighbour of one of the two giant ellipticals that
dominate the central region of Antlia. For their luminosities, they are
both the reddest and most compact objects of the early-type Antlia galaxies.
If we accept that their colours are mainly driven by metallicity, as
likely happens with galaxies on the CMR, both of them would be the
richest galaxies for their luminosities in our sample.
The cEs found in the Centaurus and Coma clusters are also located on the
red side of their corresponding mean CMRs.
However, the cE galaxies found in Coma present [Fe/H] abundances comparable
to those of some dEs. Therefore, at the moment it is difficult to establish if
cEs should be treated as a separate class of objects, or should be considered
as part of the general early-type dwarf galaxy family experiencing, perhaps,
particular dynamical processes.
- We have found a small sample of 7 unstudied dSph candidates,
whose membership cannot be confirmed with our spectra due to their low
surface brightness. They cover a range in integrated magnitudes
and total radii between 5 and 11 arcsec,
which at the Antlia distance correspond to approximately 850 pc – 2 kpc.
They are found close to bright galaxies ( mag), being their
average projected distance from them of kpc.
- The projected spatial distribution of the whole sample points to a complex structure for Antlia. At least two groups are present in the central region, with some evidence of an ongoing merger. We will extend our study adding new fields adjoining the central one, and increasing the spectroscopic data set, in order to add kinematic information to the spatial distribution.
Acknowledgements
We are grateful to the anonymous referee for his/her comments and corrections which helped to improve the content of this paper. A.S.C. and G.R. warmly thank to Nidia Morrell for her help with the reduction of echelle spectra. A.S.C. and F.F. acknowdlege finantial support from Agencia de Promoción Científica y Tecnológica of Argentina (BID AR PICT 2010-0410 and BID AR PICT 2007-885). T.R. acknowledges financial support from the Chilean Center for Astrophysics, FONDAP Nr. 15010003, from FONDECYT project Nr. 1100620, and from the BASAL Centro de Astrofísica y Tecnologías Afines (CATA) PFB-06/2007. G.R. was supported by ALMA/Conicyt (grant 31070021) and ESO/comite mixto. This work was also funded with grants from Consejo Nacional de Investigaciones Científicas y Técnicas de la República Argentina, Agencia Nacional de Promoción Científica y Tecnológica and Universidad Nacional de La Plata (Argentina). Part of the data used in this paper were obtained under GEMINI programs GS-2008A-Q-56, GS-2009A-Q-25 and GS-2010A-Q-21.
References
- Andreon et al. (2006) Andreon S., Cuillandre J.-C., Puddu E., Mellier Y., 2006, MNRAS, 372, 60
- Annibali et al. (2011) Annibali F., Grützbauch R., Rampazzo R., Bressan A., Zeilinger W. W., 2011, A&A, 528A, 19
- Barazza et al. (2009) Barazza F. D. et al., 2009, A&A, 508, 665
- Bassino et al. (2008) Bassino L. P., Richtler T., Dirsch B., 2008, MNRAS, 386, 1145
- Baum (1959) Baum W., 1959, PASP, 71, 106
- Belokurov et al. (2008) Belokurov V. et al., 2008, ApJ, 686L, 83B
- Bertin & Arnouts (1996) Bertin E., Arnouts S., 1996, A&AS, 117, 393
- Binggeli & Jerjen (1998) Binggeli B., Jerjen H., 1998, A&A, 333, 17
- Binggeli et al. (1985) Binggeli B., Sandage A., Tammann G. A., 1985, AJ, 90, 1681
- Bosselli et al. (2008) Boselli A., Boissier S., Cortese L., Gavazzi G., 2008, A&A, 489, 1015
- Bower et al. (1992) Bower R. G., Lucey J. R., Ellis R. S., 1992, MNRAS, 254, 601
- Buzzoni et al. (2011) Buzzoni A., Cellone S., Saracco P., Zucca E., 2011, MNRAS, submitted
- Caldwell & Bothun (1987) Caldwell N., Bothun G. D., 1987, AJ, 94, 1126
- Cellone (1999) Cellone S. A., 1999, A&A, 345, 403
- Cellone & Buzzoni (2001) Cellone S. A., Buzzoni A., 2001, A&A, 369, 742
- Cellone & Buzzoni (2005) Cellone S. A., Buzzoni A., 2005, MNRAS, 356, 41
- Chiboucas & Mateo (2006) Chiboucas K., Mateo. M., 2006, AJ, 132, 347
- Chiboucas et al. (2009) Chiboucas K., Karachentsev I. D., Tully R. B., 2009, AJ, 137, 3009
- Chiboucas et al. (2010) Chiboucas K., Tully R. B., Marzke R. O., Trentham N., Ferguson H. C., Hammer D., Carter D., Khosroshahi H., 2010, ApJ, 723, 251
- Chilingarian et al. (2009) Chilingarian I., Cayatte V., Revaz Y., Dodonov S., Durand D., Durret F., Micol A., Slezak E., 2009, Sci, 326, 1379
- Chilingarian & Bergond (2010) Chilingarian I. V., Bergond G., 2010, MNRAS, 405, L11
- Choi et al. (2002) Choi P. I., Guhathakurta P., Johnston K. V., 2002, AJ, 124, 310
- Clemens et al. (2011) Clemens M., Panuzzo P., Rampazzo R., Vega O., Bressan A., 2011, MNRAS, 412, 2063
- Conselice et al. (2002) Conselice C. J., Gallagher J. S., Wyse R. F. G., 2002, AJ, 123, 2246
- Conselice et al. (2003) Conselice C. J., Gallagher J. S., Wyse R. F. G., 2003, AJ, 125, 66
- De Rijcke et al. (2009) De Rijcke S., Penny S. J., Conselice C. J., Valcke S., Held E. V., 2009, MNRAS, 393, 798
- Dirsch et al. (2003) Dirsch B., Richtler T., Bassino L. P., 2003, A&A, 408, 929
- Faber (1973) Faber S. M., 1973, ApJ, 179, 731
- Ferguson (1989) Ferguson H. C., 1989, Ap&SS, 157, 227
- Ferguson & Binggeli (1994) Ferguson H. C., Binggeli B., 1994, A&ARv, 6, 67
- Ferguson & Sandage (1990) Ferguson H. C., Sandage A., 1990, AJ, 100, 1 (FS90)
- Ferrarese et al. (2006) Ferrarese L., et al., 2006, ApJS, 164, 334
- Ferreras & Silk (2003) Ferreras I., Silk J., 2003, MNRAS, 344, 455
- Forbes (2007) Forbes D., 2007, in Groups of Galaxies in the Nearby Universe, Eso Astrophysics Symposia, eds. I. Saviane, V. D. Ivanov, J. Borissova, Springer-Verlag, 97
- Forbes & Forte (2001) Forbes D., Forte J. C., 2001, MNRAS, 322, 257
- Forte et al. (2007) Forte J. C., Faifer F. R., Geisler D., 2007, MNRAS, 382, 1947
- Fukugita et al. (1995) Fukugita M., Shimasaku K., Ichikawa T., 1995, PASP, 107, 945
- Gallagher & Wyse (1994) Gallagher J. S., Wyse R. F. G., 1994, PASP, 106, 1225
- Geisler (1996) Geisler D., 1996, AJ, 111, 480
- Graham (2002) Graham A. W., 2002, ApJ, 568, L13
- Graham (2011) Graham A. W., 2011, EAS, 48, 231
- Graham & Guzmán (2003) Graham A. W., Guzmán R., 2003, AJ, 125, 2936
- Grebel (2005) Grebel E.K., 2005, in Near-Field Cosmology with Dwarf Elliptical Galaxies, Proceedings IAU Colloquium 198, eds. H. Jerjen & B. Binggeli (Cambridge: Cambridge Univ. Press), 1
- Harris et al. (2002) Harris W. E., Harris G. L. H., Holland S. T., McLaughlin D. E., 2002, AJ, 124, 1435
- Howell (2005) Howell J., 2005, AJ, 130, 2065
- Hilker et al. (2003) Hilker M., Mieske S., Infante L., 2003, A&A, 397, L9
- Huxor et al. (2011) Huxor A. P., Phillipps S., Price J., Harniman R., 2011, MNRAS, 414, 3557
- Irwin & Hatzidimitriou (1995) Irwin M., Hatzidimitriou D., 1995, MNRAS, 277, 1354
- Jaffé et al. (2011) Jaffé Y. L., Aragón-Salamanca A., De Lucia G., Jablonka P., Rudnick G., Saglia R., Zaritsky D., 2011, MNRAS, 410, 280
- Janz & Lisker (2009) Janz J., Lisker T., 2009, ApJ, 696, L102
- Kalirai et al. (2010) Kalirai J. S. et al., 2010, ApJ, 711, 671
- Kaviraj et al. (2009) Kaviraj S., Peirani S., Khochfar S., Silk J., Kay S., 2009, MNRAS, 394, 1713
- Köppen et al. (2007) Köppen J., Weidner C., Kroupa P., 2007, MNRAS, 375, 673
- Kormendy (1977a) Kormendy J., 1977a, ApJ, 217, 406
- Kormendy (1977b) Kormendy J., 1977b, ApJ, 218, 333
- Kormendy et al. (2009) Kormendy J., Fisher D. B., Cornell M. E., Bender R., 2009, ApJS, 182, 216
- Kuntschner (2000) Kuntschner H., 2000, MNRAS, 315, 184
- Lisker et al. (2006) Lisker T., Glatt K., Westera P., Grebel E., 2006, AJ, 132, 2432
- Lisker et al. (2008) Lisker T., Grebel E. K., Binggeli B., 2008, AJ, 135, 380
- López-Cruz et al. (2004) López-Cruz O., Barkhouse W. A., Yee H. K. C., 2004, ApJ, 614, 679
- Mateo (1998) Mateo M. L., 1998, ARA&A, 36, 435
- Mastropietro et al. (2005) Mastropietro C., Moore B., Mayer L., Debattista V. P., Piffaretti R., Stadel J., 2005, MNRAS, 364, 607
- McConnachie & Irwin (2006a) McConnachie A. W., Irwin M. J., 2006a, MNRAS, 365, 902
- McConnachie & Irwin (2006b) McConnachie A. W., Irwin M. J., 2006b, MNRAS, 365, 1263
- Mendel et al. (2008) Mendel J. T., Proctor R. N., Forbes D. A., Brough S., 2008, MNRAS, 389, 749
- Mendel et al. (2009) Mendel J. T., Proctor R. N., Rasmussen J., Brough S., Forbes D., 2009, MNRAS, 396, 2103
- Mieske et al. (2006) Mieske S. et al., 2006, ApJ, 653, 193
- Mieske et al. (2007) Mieske S., Hilker M., Infante L., Mendes de Oliveira C., 2007, A&A, 463, 503
- Misgeld et al. (2008) Misgeld I., Mieske S., Hilker M., 2008, A&A, 486, 697
- Misgeld et al. (2009) Misgeld I., Hilker M., Mieske S., 2009, A&A, 496, 683
- Nakazawa et al. (2000) Nakazawa K., Makishima K., Fukazawa Y., Tamura T., 2000, PASJ, 52, 623
- Pedersen et al. (1997) Pedersen K., Yoshii Y., Sommer-Larsen J., 1997, ApJ, 485, L17
- Penny & Conselice (2008) Penny S. J., Conselice C., 2008, MNRAS, 383, 247
- Penny et al. (2011) Penny S. J., Conselice C., De Rijcke S., Held E., Gallagher III J. S., O’Connell R. W., 2011, MNRAS, 410, 1076
- Peñarrubia et al. (2008) Peñarrubia J., Navarro J. F., McConnachie A. W., 2008, ApJ, 673, 226
- Peñarrubia et al. (2009) Peñarrubia J., Navarro J. F., McConnachie A. W., Martin N., 2009, ApJ, 698, 222
- Pipino & Matteucci (2006) Pipino A., Matteucci F., 2006, MNRAS, 365, 1114
- Price et al. (2009) Price J. et al., 2009, MNRAS, 397, 1816
- Rakos et al. (2001) Rakos K., Schombert J., Maitzen H. M., Prugovecki S., Odell A., 2001, AJ, 121, 1974
- Romeo et al. (2008) Romeo A. D., Napolitano N. R., Covone G., Sommer-Larsen J., Antonuccio-Delogu V., Capaccioli M., 2008, MNRAS, 389, 13
- Sánchez-Blázquez et al. (2006) Sánchez-Blázquez P. et al., 2006, MNRAS, 371, 703
- Sandage (1972) Sandage A., 1972, ApJ, 176, 21
- Sandage & Visvanathan (1978) Sandage A., Visvanathan N., 1978, ApJ, 223, 707
- Secker et al. (1997) Secker J., Harris W. E., Plummer J. D., 1997, PASP, 109, 1377
- Sérsic (1968) Sérsic J. L., 1968, Atlas de Galaxias Australes (Córdoba: Obs. Astron., Univ. Nac. Córdoba)
- Smith Castelli et al. (2008a) Smith Castelli A. V., Bassino L. P., Richtler T., Cellone S. A., Aruta C., Infante L., 2008a, MNRAS, 386, 2311 (Paper I)
- Smith Castelli et al. (2008b) Smith Castelli A. V., Faifer F., Richtler T., Bassino L. P., 2008b, MNRAS, 391, 685 (Paper II)
- Smith Castelli et al. (2009) Smith Castelli A. V., Faifer F. R., Bassino L. P., Romero G. A., Cellone S. A., Richtler T., 2009, BAAA, 52, 229
- Terlevich et al. (1999) Terlevich A. I., Kuntschner H., Bower R. G., Caldwell, N., Sharples R. M., 1999, MNRAS, 310, 445
- Terlevich et al. (2001) Terlevich A. I., Caldwell, Bower R. G., 2001, MNRAS, 326, 1547
- Trager et al. (2000) Trager S., Faber S., Worthey G., Jesús González J., 2000, AJ, 120, 165
- Trujillo et al. (2001) Trujillo I., Graham A. W., Caon N., 2001, MNRAS, 326, 869
- Tolstoy et al. (2009) Tolstoy E., Hill V., Tosi M., 2009, ARA&A, 47, 371
- Vazdekis et al. (2001) Vazdekis A., Kuntschner H., Davies R. L., Arimoto N., Nakamura O., Peletier R., 2001, ApJ, 551, L127
- Visvanathan & Sandage (1977) Visvanathan N., Sandage A., 1977, ApJ, 216, 214
- Zaritsky et al. (2006) Zaritsky D., Gonzalez A. H., Zabludoff A. I., 2006, ApJ, 642, L37
Appendix A FS90 galaxies with new radial velocities
In this appendix we present the new measured radial velocities
of 23 FS90 galaxies (Table 2), as well as
their logarithmic scale images (Fig. 5).


| FS90 | FS90 | FS90 | vr | |||||
|---|---|---|---|---|---|---|---|---|
| ID | (J2000) | (J2000) | mor. | status | km s-1 | |||
| 1 | FS90 70 | 10:28:06.9 | -35:35:20 | dE | 1 | 2864 | 70 | |
| 2 | FS90 83 | 10:28:23.0 | -35:30:57 | S or Sm | 3 | 19685 | 33 | |
| 3 | FS90 85 | 10:28:24.0 | -35:34:22 | dE | 1 | 2000 | 200 | |
| 4 | FS90 103 | 10:28:45.1 | -35:34:40 | dE | 3 | 2054 | 29 | |
| 5 | FS90 109 | 10:28:53.0 | -35:32:52 | dE | 2 | 1618 | 24 | |
| 6 | FS90 110 | 10:28:53.0 | -35:35:34 | E(M32?) | 3 | 2911 | 7 | |
| 7 | FS90 120 | 10:29:02.1 | -35:34:04 | ImV | 1 | 2634 | 13 | |
| 8 | FS90 123 | 10:29:03.1 | -35:40:30 | dE,N | 2 | 1865 | 25 | |
| 9 | FS90 133 | 10:29:12.0 | -35:39:28 | d:E,N | 1 | 2205 | 24 | |
| 10 | FS90 136 | 10:29:15.3 | -35:25:58 | dE,N | 1 | 2989 | 10 | |
| 11 | FS90 137 | 10:29:15.1 | -35:41:34 | ImV | 2 | 3987 | 36 | |
| 12 | FS90 149 | 10:29:27.3 | -35:27:10 | S0 or dS0 | 3 | 46175 | 13 | |
| 13 | FS90 188 | 10:30:02.4 | -35:24:28 | dE | 1 | 2673 | 17 | |
| 14 | FS90 192 | 10:30:04.5 | -35:20:31 | E(M32?) | 3 | 2526 | 4 | |
| 15 | FS90 196 | 10:30:06.4 | -35:23:31 | dE | 1 | 3593 | 9 | |
| 16 | FS90 205 | 10:30:18.4 | -35:24:43 | dE | 2 | 45909 | 18 | |
| 17 | FS90 209 | 10:30:19.4 | -35:34:48 | dE | 2 | 3065 | 13 | |
| 18 | FS90 212 | 10:30:21.3 | -35:35:31 | SmIII | 1 | 2364 | 27 | |
| 19 | FS90 213 | 10:30:21.6 | -35:12:14 | dE | 2 | 2185 | 21 | |
| 20 | FS90 221 | 10:30:25.4 | -35:23:38 | dE | 2 | 3556 | 130 | |
| 21 | FS90 223 | 10:30:25.6 | -35:13:19 | dE | 1 | 2661 | 9 | |
| 22 | FS90 227 | 10:30:31.4 | -35:23:06 | dE? | 2 | 2921 | 60 | |
| 23 | FS90 228 | 10:30:31.6 | -35:14:38 | dE,N | 1 | 2417 | 13 | |
Appendix B New dwarf galaxy members and candidates
We present the coordinates, radial velocities and photometric parameters for five new dwarf galaxy members identified from spectroscopic data obtained with GEMINI-GMOS (see Table 3). In Fig. 6 we show their logarithmic scale images. All of them display a bright central region that could be associated to a nucleus.
We also show the photometric parameters (when available) for 16 new dwarf
galaxy candidates (see Table 4) and their images in
Fig. 7.

| ID | vr | Remarks | ||||||||||
|---|---|---|---|---|---|---|---|---|---|---|---|---|
| (J2000) | (J2000) | (mag) | (mag) | (mag arcsec-2) | (arcsec) | (mag arcsec-2) | (arcsec) | km s-1 | ||||
| 1 | ANTL J102910-353920.1 | 10:29:10.3 | -35:39:20.1 | 0.083 | 19.76 (0.02) | 1.54 (0.03) | 26.4 | 4.8 | 23.4 | 2.1 | 1940155 | ELL |
| 2 | ANTL J102914-353923.6 | 10:29:14.4 | -35:39:23.6 | 0.083 | 20.25 (0.06) | 1.67 (0.08) | 26.3 | 5.6 | 24.6 | 3.0 | 4067115 | ELL |
| 3 | ANTL J103013-352458.3 | 10:30:13.8 | -35:24:58.3 | 0.104 | 19.49 (0.04) | 1.59 (0.06) | 25.8 | 7.6 | 25.7 | 3.7 | 2613200 | SE,NS |
| 4 | ANTL J103033-352638.6 | 10:30:33.3 | -35:26:38.6 | 0.104 | 19.07 (0.02) | 1.68 (0.04) | 26.6 | 6.6 | 23.4 | 2.9 | 2311130 | ELL |
| 5 | ANTL J103037-352708.8 | 10:30:37.5 | -35:27:08.8 | 0.103 | 19.16 (0.03) | 1.60 (0.04) | 25.8 | 6.8 | 25.7 | 3.1 | 2400100 | SE |
Notes.- corresponds to the threshold above which SEXTRACTOR detects and measures the object (MU_THRESHOLD), or to the surface brightness of the outermost isophote for ELLIPSE. is the radius that contains 90 per cent of the light for SEXTRACTOR, or the equivalent radius () of the most external isophote for ELLIPSE. In both cases, is obtained from , the radius that contains one-half of the light (see eq. 1 in Paper I) and is the output parameter FLUX_RADIUS for SEXTRACTOR. Remarks refer to: SE= magnitudes and colours measured with SEXTRACTOR; ELL= magnitudes and colours obtained from ELLIPSE; NS= nearby a bright star.


| ID | Remarks | ||||||||||||||
|---|---|---|---|---|---|---|---|---|---|---|---|---|---|---|---|
| (J2000) | (J2000) | (mag) | (mag) | (mag arcsec-2) | (arcsec) | (mag arcsec-2) | (arcsec) | ||||||||
| 1 | ANTL J102828-354128 | 10:28:28.2 | -35:41:28.5 | 0.074 | 18.15 (0.05) | 1.63 (0.07) | 25.7 | 14 | . | 8 | 24.4 | 7 | . | 3 | SE |
| 2 | ANTL J102839-351053 | 10:28:39.0 | -35:10:53.5 | 0.096 | 18.57 (0.10) | 1.48 (0.13) | 25.8 | 17 | . | 6 | 24.7 | 6 | . | 8 | SE |
| 3 | ANTL J102843-353933 | 10:28:43.8 | -35:39:33.1 | 0.077 | 18.74 (0.07) | 1.76 (0.11) | 25.8 | 14 | . | 2 | 24.8 | 6 | . | 6 | SE |
| 4 | ANTL J102914-353855 | 10:29:14.7 | -35:38:55.2 | 0.084 | 21.35 (0.11) | 1.31 (0.14) | 25.6 | 5 | . | 1 | 25.7 | 2 | . | 9 | SE,FG |
| 5 | ANTL J102918-352900 | 10:29:18.8 | -35:29:00.2 | 0.090 | 19.74 (0.01) | 1.52 (0.02) | - | 9 | . | 4 | - | - | NS,PHOT | ||
| 6 | ANTL J102932-354216 | 10:29:32.2 | -35:42:16.4 | 0.084 | 22.35 (0.08) | 1.68 (0.11) | 26.5 | 2 | . | 6 | 25.4 | 1 | . | 6 | ELL,PB |
| 7 | ANTL J102936-352445 | 10:29:36.2 | -35:24:45.7 | 0.094 | 19.00 (0.08) | 1.50 (0.11) | 25.8 | 13 | . | 0 | 25.0 | 6 | . | 4 | SE,BL |
| 8 | ANTL J102943-352238 | 10:29:43.3 | -35:22:38.8 | 0.098 | 21.08 (0.04) | 1.17 (0.06) | - | 9 | . | 4 | - | - | FG,NG | ||
| 9 | ANTL J102948-352354 | 10:29:48.6 | -35:23:54.0 | 0.098 | 22.39 (0.02) | 1.90 (0.04) | 26.1 | 2 | . | 1 | 24.5 | 1 | . | 1 | ELL,NG |
| 10 | ANTL J102954-352744 | 10:29:54.2 | -35:27:44.6 | 0.094 | - | - | - | - | - | - | FG,NS | ||||
| 11 | ANTL J102955-351517 | 10:29:55.9 | -35:15:17.6 | 0.103 | 18.42 (0.03) | 1.70 (0.05) | 26.0 | 9 | . | 7 | 25.3 | 4 | . | 0 | ELL,NG |
| 12 | ANTL J102959-354227 | 10:29:59.8 | -35:42:27.1 | 0.089 | 20.70 (0.03) | 1.93 (0.06) | - | 10 | . | 5 | - | - | FG,PHOT | ||
| 13 | ANTL J103027-350957 | 10:30:27.5 | -35:09:57.4 | 0.101 | 20.24 (0.04) | 1.38 (0.05) | 25.9 | 5 | . | 0 | 25.4 | 4 | . | 4 | ELL |
| 14 | ANTL J103027-352941 | 10:30:27.5 | -35:29:41.8 | 0.098 | 21.24 (0.05) | 1.82 (0.09) | - | 10 | . | 5 | - | - | FG,PHOT | ||
| 15 | ANTL J103042-351519 | 10:30:42.1 | -35:15:19.5 | 0.099 | 21.02 (0.04) | 0.99 (0.06) | - | 10 | . | 8 | - | - | FG,PHOT | ||
| 16 | ANTL J103047-354025 | 10:30:47.1 | -35:40:25.1 | 0.102 | 20.37 (0.03) | 1.02 (0.04) | - | 10 | . | 8 | - | - | FG,BL,PHOT | ||
Notes .- corresponds to the threshold above which SEXTRACTOR detects and measures the object (MU_THRESHOLD), or to the surface brightness of the outermost isophote for ELLIPSE. is the radius that contains 90 per cent of the light for SEXTRACTOR, the equivalent radius () of the most external isophote for ELLIPSE, or the radius of the aperture considered with PHOT. is obtained in both cases from , the radius that contains one-half of the light (see eq. 1 in Paper I). This radius is the output parameter FLUX_RADIUS for SEXTRACTOR. Remarks refer to: SE= magnitudes and colours measured with SEXTRACTOR; ELL= magnitudes and colours obtained with ELLIPSE; PHOT= magnitudes and colours measured with PHOT; BL= bleeding; NS= nearby a bright star; NG= nearby a bright galaxy; FG= very faint and diffuse galaxy; PB= possible background.
Appendix C ELLIPSE versus SExtractor
| FS90 | FS90 | FS90 | ||||||||||
|---|---|---|---|---|---|---|---|---|---|---|---|---|
| ID | mor. | status | mag | mag | mag arcsec-2 | arcsec | mag arcsec-2 | arcsec | ||||
| 70 | dE | 1 | 17.68 (0.02) | 1.73 (0.08) | 26.4 | 12 | . | 9 | 23.2 | 5 | . | 1 |
| 72 | S0 | 1 | 14.38 (0.01) | 1.93 (0.02) | 26.4 | 29 | . | 7 | 20.3 | 6 | . | 1 |
| 73 | dE | 1 | 16.95 (0.01) | 1.72 (0.04) | 27.0 | 15 | . | 1 | 22.1 | 4 | . | 3 |
| 85 | dE | 1 | 18.70 (0.01) | 1.63 (0.04) | 25.3 | 6 | . | 6 | 23.6 | 3 | . | 8 |
| 87 | dE,N | 1 | 15.85 (0.01) | 1.86 (0.04) | 26.8 | 23 | . | 4 | 22.3 | 7 | . | 9 |
| 114 | dE | 1 | 20.96 (0.02) | 1.58 (0.05) | 26.4 | 3 | . | 6 | 24.3 | 1 | . | 9 |
| 118 | dE | 1 | 19.01 (0.03) | 1.77 (0.14) | 26.5 | 11 | . | 3 | 25.0 | 6 | . | 4 |
| 123 | dE,N | 2 | 16.32 (0.01) | 1.90 (0.03) | 26.4 | 17 | . | 2 | 21.8 | 5 | . | 0 |
| 133 | d:E,N | 1 | 14.54 (0.01) | 1.86 (0.02) | 26.8 | 29 | . | 2 | 20.5 | 6 | . | 3 |
| 136 | dE,N | 1 | 16.03 (0.01) | 1.86 (0.04) | 26.6 | 21 | . | 3 | 21.9 | 5 | . | 9 |
| 159 | d:E,N? | 1 | 16.10 (0.01) | 1.81 (0.03) | 26.7 | 16 | . | 2 | 21.3 | 4 | . | 3 |
| 160 | dE | 1 | 19.46 (0.02) | 1.82 (0.07) | 27.7 | 9 | . | 4 | 24.8 | 4 | . | 7 |
| 162 | dE,N | 1 | 17.31 (0.02) | 1.78 (0.04) | 25.8 | 11 | . | 6 | 22.7 | 4 | . | 7 |
| 176 | dE,N | 1 | 17.33 (0.01) | 1.97 (0.03) | 25.7 | 10 | . | 1 | 22.2 | 3 | . | 8 |
| 177 | d:E,N | 1 | 15.39 (0.01) | 1.84 (0.03) | 26.0 | 20 | . | 0 | 20.9 | 5 | . | 1 |
| 186 | dE | 1 | 18.67 (0.02) | 1.68 (0.05) | 26.0 | 7 | . | 7 | 23.4 | 3 | . | 5 |
| 188 | dE | 1 | 17.96 (0.02) | 1.81 (0.08) | 26.4 | 11 | . | 1 | 23.4 | 4 | . | 8 |
| 192 | E(M32?) | 3 | 16.66 (0.01) | 2.11 (0.03) | 27.6 | 11 | . | 4 | 19.9 | 1 | . | 7 |
| 201 | dE | 1 | 19.43 (0.02) | 1.75 (0.06) | 26.3 | 6 | . | 5 | 23.9 | 3 | . | 1 |
| 216 | E | 2 | 16.15 (0.01) | 1.77 (0.02) | 27.2 | 13 | . | 8 | 20.3 | 2 | . | 7 |
| 228 | dE,N | 1 | 17.47 (0.01) | 1.76 (0.06) | 27.0 | 13 | . | 1 | 22.3 | 3 | . | 7 |
| 231 | d:E,N | 1 | 14.97 (0.01) | 2.19 (0.02) | 26.7 | 21 | . | 7 | 20.4 | 4 | . | 9 |
| 241 | dE,N | 1 | 16.81 (0.02) | 2.02 (0.08) | 26.7 | 18 | . | 8 | 23.1 | 7 | . | 2 |
Notes .- corresponds to the surface brightness of the outermost isophote measured with ELLIPSE. is the equivalent radius () of the most external isophote. is obtained from , the radius that contains one-half of the light, following eq. 1 in Paper I.
In Paper I we have obtained the CMR from colours and magnitudes measured with SExtractor and with ELLIPSE. Therefore, it is interesting to quantify if there are significant differences between these two ways of obtaining photometry. To this aim, in Figures 8 we show plots comparing magnitudes, colours, and effective radii obtained with SExtractor and ELLIPSE.
In the left panel of Figure 8, we see that for luminosities in the range , magnitudes obtained from SExtractor and ELLIPSE agree well, the mean offset being . However, there are significant differences for mag, that can be as large as 1.14 mag. The mean offset for faint galaxies is mag. In the case of magnitudes (no plot is shown), considerable offsets arise for mag. For magnitudes brighter than this limit we obtained and for fainter ones, mag.
In the central panel of Figure 8, we show the differences in colours as as a function of the ELLIPSE luminosity of the galaxy. For mag, offsets as large as mag might arise for some objects: 6 galaxies out of 30 (20 per cent) present mag.
When effective radii are compared (righ panel of Figure 8), those obtained by SExtractor tend to be larger than those found by ELLIPSE. In the plot, we considered . In particular, for mag, the mean offset is arcsec and for mag, arcsec.
Despite these differences, we see from both panels of Figure 9 that our conclusions about the colour-magnitude and luminosity– relations almost do not change by considering photometry obtained by one way or another. The slope and zero point of both CMRs are similar, and the locus of constant effective radius arise naturally in both samples. SExtractor photometry seems to introduce some additional scatter at the faint end of the relation, while ELLIPSE slightly increases the dispersion at intermediate brightness. The luminosity– relation presents lower scatter when the SExtractor photometry is considered. However, the break at the faint end of the relation is found in both samples. In the case of FS90 192, one of the cE galaxies, it can be seen that its location away from the locus of constant effective radius towards higher values of , is similar in both cases.
From our findings we conclude that SExtractor and ELLIPSE are suitable to study mean photometric relations with a comparable level of confidence. However, for individual studies of low brightness galaxies, some care must be taken when considering colours and structural parameters.


