Observation of selected IBLs and LBLs with VERITAS
Abstract
The improved sensitivity of current-generation atmospheric-Cherenkov telescope (ACT) arrays enables us to probe for the first time low-frequency-peaked and intermediate-frequency-peaked BL Lac (LBL and IBL, respectively) objects as very high energy (VHE) -ray emitters. VERITAS is currently one of the most sensitive VHE gamma-ray observatories in the world and is particularly suited to study these objects. In this paper we will present recent results from VERITAS observations of a selected set of LBLs and IBLs.
1 Introduction
Blazars are a class of radio-loud active galactic nuclei (AGN) that have relativistic jets oriented towards the Earth. Observationally blazars show broadband non-thermal emission over a wide range of frequencies, from IR (flat-spectrum radio quasars (FSRQs) and LBL) to optical/UV (IBL) and X-rays. VHE ( 100 GeV) gamma rays have been detected from a large number of blazars by ground-based atmospheric-Cherenkov telescopes (ACTs). However most of the confirmed TeV blazars are high-frequency BL Lac objects (HBLs), as opposed to quasars and LBL/IBLs that consitute the majority of the population in the MeV-GeV band. It is only recently that improved senstitivities of current generation ACTs have allowed us for the first time to probe LBL and IBLs as VHE emitters. Here we report on the observations of selected LBLs and IBLs, namely W Comae, 3C 66A, PKS 1424+24, 1ES1440+122 and 1ES1215+303 by VERITAS [1]. and discuss the implication of these observations in the context of multiwavelength campaigns.
2 VERITAS Array and Data Analysis
VERITAS is an array of four imaging Cherenkov telescopes located at the Fred Lawrence Whipple Observatory in southern Arizona at a height of 1268 a.s.l. It combines a large effective area ( 105 m2 ) over a wide energy range (100 GeV to 30 TeV) with good energy resolution (15-25%) and high angular resolution (R68% 0.1∘). The field of view of VERITAS is 3.5∘. The high sensitivity of VERITAS allows the detection of sources with a flux of 1% of the Crab Nebula flux in about 25 hours. For more details on the VERITAS instrument and analysis, please refer to [2, 3, 4].
3 Observations of IBLs
3.1 W Comae
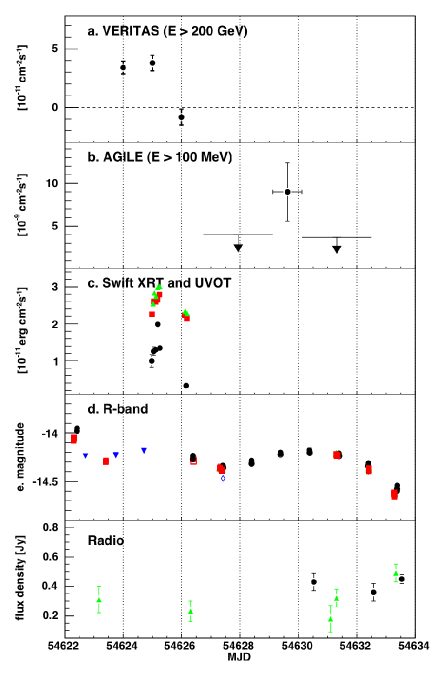
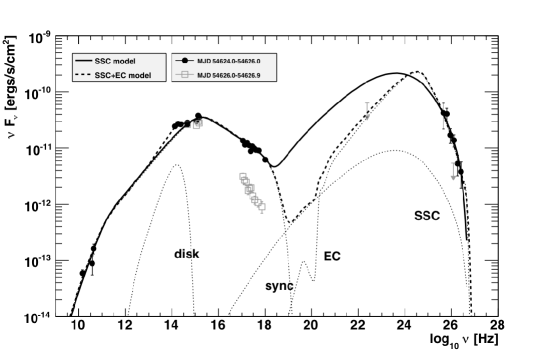
W Comae (ON 231, z =0.102) was the first IBL to be detected at VHE [5]. It was discovered as a VHE source by VERITAS during observations carried out over a 4-month period (Jan 2008 to Apr 2008). During this time, a strong gamma-ray outburst was measured over a period of 4 days, when the source went into a flaring state in the middle of March reaching 9% of Crab Nebula flux. The photon index during the flare was measured to be = 3.81 0.35stat 0.34sys. In June 2008, the source again went to a high state and was approximately three times brighter than during 2008 March observations, triggering a multiwavelength campaign which included AGILE, Swift and XMM-Newton. VERITAS observed W Comae for 230 minutes in between June 7 and 9. The average flux on June 7-8 was 2.5-3 times higher than that observed during March 2008. The differential photon flux can be fitted with a power law with an index = 3.68 0.22stat 0.3sys. Figure 1 shows the multiwavelength light curve of W Comae (MJD 54622 to 54634) [7]. The initial detection of the flare by VERITAS was followed by observations in high-energy gamma rays (AGILE, Eγ 100 MeV), X-rays (Swift and XMM-Newton), UV and ground based optical and radio monitoring instruments through the GASP-WEBT consortium. The measurements revealed strong variability in both gamma rays and X-rays on timescales of days. The broadband spectral energy distribution (SED) during the flare (MJD 54624 to 54626) has been modeled using a leptonic one-zone jet model [6]. The SED (see Figure 2) can be modeled by a simple leptonic synchrotron self-Compton model (SSC), however the wide separation of the peaks in the SED requires a rather low ratio of magnetic field to electron energy density. On the other hand, if one invokes external-Compton emission, magnetic field parameters close to equipartition can be obtained.
3.2 PKS 1424+240
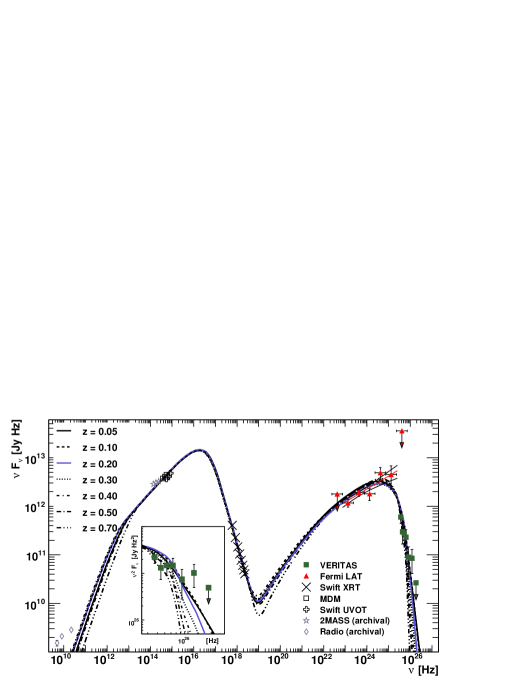
PKS 1424+240 was detected as a radio source and was classified as a blazar from optical polarisation studies [8]. Non-thermal X-rays were later reported from this source [9]. The redshift of PKS 1424+240 is unknown. A lower limit on the redshift of z 0.06 was measured by [10] and limit of z 0.67 was obtained by [11], both assuming a minimum luminosity of the host galaxy. PKS 1424+240 was observed by VERITAS for about 37.3 hours between 2009 February 19 and June 21, 65% of the data having been taken with 3 telescopes. The analysis of the data resulted in the discovery of PKS 1424+240. The statistical significance of the observed excess of gamma-ray events is 8.5 standard deviations [12]. The photon spectrum above 140 GeV measured by VERITAS is well described by a power law with an index of 3.8 0.5stat 0.3sys and a flux normalisation at 200 GeV of (5.1 0.9stat 0.5sys) 10-11 cm-2s-1TeV-1. No varability is observed in the VHE flux over the period of observations. Flux variability is also not observed in the contemporaneous high energy observations with Fermi Large Area Telescope (LAT). Contemporaneous X-ray and optical data were also obtained from Swift XRT and MDM observatory. The broadband SED can be well described by a one-zone SSC model [6] if one assumes a redshift of 0.1. Figure 3 shows the SED of PKS 1424+240. The inset of Figure 3 illustrates that above z 0.2, the model VHE gamma ray spectrum becomes too steep compared to observed VERITAS spectrum and the model also requires unreasonably large Doppler factors. An attempt to improve the fit in the gamma-ray band by including an EC component results in a steeper VHE gamma-ray spectrum. An upper limit on the redshift of the source can be obtained using the photon index as measured with Fermi in combination with recent extragalactic background light absorption models [13, 14] and the VHE spectrum measured by VERITAS. Using this method the upper limit on the redshift of the source has been estimated to be 0.66.
3.3 3C 66A
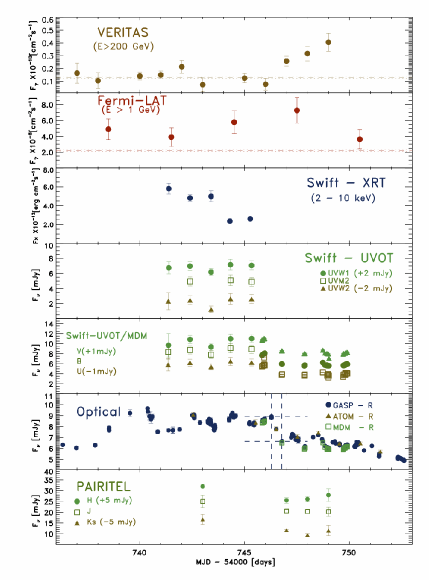
3C 66A was first identified as a quasi-stellar object (QSO) using optical observations [15]. It was subsequently classified as a BL Lac object based on its significant optical and X-ray variability [16]. VERITAS observed 3C 66A for 14 hours from September 2007 through January 2008 (hereafter, the 2007-2008 season). Later, from September through November 2008 (hereafter, the 2008-2009 season), a further 46 hours of data were taken. After removing data with poor weather conditions or hardware-related problems, 4.7 hours live time in 2007-2008 and 28.1 hours in 2008-2009 were used for final analysis. Analysis of the data resulted in an excess of 1791 events from the direction of 3C 66A. The excess corresponds to a statistical significance of 21.1 [17]. Here we report on the detection of a strong flare in October 2008 with night-by-night VHE flux variability [18]. Contemporaneous variability was also detected from optical to infra-red wavelengths and also in the Fermi-LAT energy band. Follow-up observations were carried out in radio (Medicina, Metsähovi, Noto and UMRAO observatories), optical (GASP-WEBT, MDM, ATOM), infra-red (PAIRITEL) and X-ray (Swift XRT, Chandra) wavelengths in order to measure the flux and spectral variability of the source and obtain a quasi simultaneous SED. The average flux in VHE gamma rays above 200 GeV for the period in October 2008 (MJD 54734-54749) is found to be (1.4 0.2) 10-11 cm-2s-1 whereas the flux during the flare period (MJD 54747-54749) was found to be (2.5 0.4) 10-11 cm-2s-1. Figure 4 shows the multiwavelength light curve of 3C 66A centred around the flare (October 1 to October 10). The light curves obtained show strong variability at every observed wavelength and in particular the flux increase seen by VERITAS and Fermi-LAT coincides with an optical outburst. The overall SED (see Figure 5) can be reasonably modeled using a pure SSC model, or an SSC+EC model [6] with an external near infra-red radiation field as an additional source for Compton scattering. However the pure SSC model requires a large emission region which is inconsistent with the intra-night variability in optical wavelengths, and very low magnetic fields. Again, a smaller emission region would require unreasonably large Doppler factors, difficult to reconcile within the model. In contrast, the SSC+EC model can account for variability timescales of a few hours and predict a more reasonable magnetic field even though it is below equipartition.
3.4 1ES1440+122
1ES1440+122 was initially identified as an AGN in the Einstein Slew Survey [19]. It is surrounded by 20 galaxies, which suggests that it may belong to a cluster of galaxies [20]. 1ES1440+122 is classified as an intermediate-frequency-peaked BL Lac object by [21] and its redshift, z = 0.162, is based on the identification of at least three spectral lines [22]. 1ES1440+122 belongs to the the first Fermi-LAT MeV-GeV catalog [23], having an average photon index of 1.770.25. It is one of the hardest spectrum sources (top 10%) in the catalog. The blazar was observed with the VERITAS array for 50 hours between June 2008 and July 2010. Analysis of these data has resulted in the detection of the object with a statistical significance of 5.5. The observed flux is less than 1% of the flux from the Crab Nebula above 200 GeV and the observed VHE light curve does not show any evidence for variability [24].
3.5 1ES 1215+303
1ES 1215+303, also commonly referred to as ON 325, was first detected in the B2 408 MHz survey conducted with the Bologna Northern Cross telescope. It was detected at X-ray energies by the Einstein observatory. 1ES 1215+303 has been classified as a bright IBL based on a synchrotron peak located at 1015.6 Hz [21]. The redshift of the object is listed as z = 0.130 in NED but is uncertain, according to White et al. it is 0.237 [25]. 1ES 1215+303 was first detected in the VHE band during a brief flare over a period of 4-nights by MAGIC [27] in early January 2011. The VHE flux claimed during this flare was 2.0% of the Crab Nebula flux above 250 GeV. The field of view of 1215+303 also contains 2 other VHE sources, the well-known BL Lac object 1ES 1218+304 and another IBL W Comae [26]. VERITAS has been regularly observing 1ES 1218+304 since all 4 telescopes became operational. Thus the data set spans from 2008 to 2011. However, since the east wobble position is 1.3∘ away, it was not used for the analysis of data of 1ES 1215+303. On the other hand, the west wobble position is very close to the source, so this required a special analysis, namely the ring background model [4]. Approximately 55 hrs of data have been logged and a standard analysis yields an excess of about 235 events and a significance of 6.1. The flux corresponds to 1% of the Crab Nebula flux.
3.6 BL Lacertae
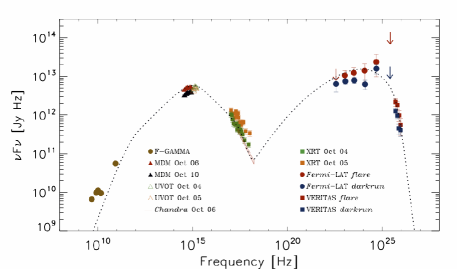
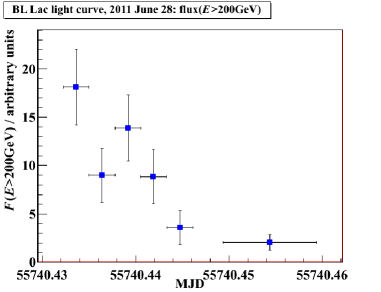
BL Lacertae(1ES 2200+420,z=0.069) is the archetype BL Lac object, and belongs to the sub-class of low-frequency-peaked BL Lac (LBL) objects. It was discovered at VHE by MAGIC during a flare in 2005 with a flux of 3% of the Crab Nebula flux above 200 GeV. No variability was recorded in the data-set. No significant excess was found in the MAGIC follow-up observations in 2006. The source has been monitored by VERITAS in 2010 and an upper limit of 3% of Crab Nebula flux has been derived from these observations. In May 2011, several observatories reported an increase in activity of the source. Following this, VERITAS monitoring observations commenced on 26th May and continued on several nights through June. On June 28, a flare was observed with VERITAS during a 40-minute observation under moonlight conditions [28]. Twilight stopped any further observations on that night. The integral flux reached as high as 50% of Crab Nebula flux above 300 GeV (20 significance) during the first 20-minute run and decreased to 10% of Crab Nebula flux (5 significance) in the next 20 minutes. Figure 6 shows the light curve of the source on the night of the flare (see details in caption). The VHE spectrum is soft with an index of about =-3.40.4. No clear signal was observed during 7 hours of 2011 VERITAS monitoring observations preceeding the night of the VHE flare.
Acknowledgements This research is supported by grants from the US Department of Energy, the US National Science Foundation, and the Smithsonian Institution, by NSERC in Canada, by Science Foundation Ireland, and by STFC in the UK. We acknowledge the excellent work of the technical support staff at the FLWO and the collaborating institutions in the construction and operation of the instrument.
References
- [1] Holder, J. et al (VERITAS Collaboration), these proceedings
- [2] Holder, J. et al (VERITAS Collaboration), Astroparticle Phys, 2006, 25:391
- [3] Weekes, T.C. et. al., Astroparticle Phys, 2002, 17:221
- [4] Acciari, V.A. et al (VERITAS Collaboration), ApJ, 2008, 679:1427
- [5] Acciari, V.A. et al (VERITAS Collaboration), ApJ, 2008, 684:L73
- [6] Böttcher, M. & Chiang, J. ApJ, 2002, 581:127
- [7] Acciari, V.A. et al (VERITAS Collaboration), ApJ, 2009, 707:612
- [8] Impey, C.D. & Tapia, S. ApJ, 1988, 333:666
- [9] Fleming, T.A. AJ, 1993, 106, 1729
- [10] Scarpa, R. & Falomo, R. A&A, 1995, 303:656
- [11] Sbarufatti, B. et al, ApJ, 2005, 635:173
- [12] Acciari, V.A. et al (VERITAS Collaboration), ApJ, 2010, 708:L100
- [13] Franceschini, A. et al, A&A, 2008, 487:837
- [14] Finke, J.D. et al, 2009, arXiv:0905.1115
- [15] Wills, B.J. & Wills, D. ApJ, 1974, 190:L97
- [16] Maccagni, D. et al, A&A, 1987, 178:21
- [17] Acciari, V.A. et al (VERITAS Collaboration), ApJ, 2009, 693:L104
- [18] Abdo, A.A. et al, ApJ, 2011, 726:43
- [19] Elvis, M et al, ApJS, 1992, 80:257
- [20] Heidt, J. et al, A&A, 1999, 341:683
- [21] Nieppola, E. et al, A&A, 2006, 445:451
- [22] Sbarufatti, B. et al, A&A, 2006, 457:35
- [23] Abdo, A.A. et al, ApJS, 2010, 188:405
- [24] Ong, R. (VERITAS Collaboration), ATEL#2786
- [25] White, R.L. et al, ApJS, 2000, 126:133
- [26] Benbow, W., these proceedings
- [27] Mariotti, M. (MAGIC Collaboration), ATEL#3100
- [28] Ong, R. (VERITAS Collaboration), ATEL#3459