The Wave Properties of Coronal Bright Fronts Observed Using SDO/AIA
Abstract
Coronal bright fronts (CBFs) are large scale wavefronts that propagate though the solar corona at hundreds of kilometers per second. While their kinematics have been studied in detail, many questions remain regarding the temporal evolution of their amplitude and pulse width. Here, contemporaneous high cadence, multi-thermal observations of the solar corona from the Solar Dynamic Observatory (SDO) and Solar TErrestrial RElations Observatory (STEREO) spacecraft are used to determine the kinematics and expansion rate of a CBF wavefront observed on 2010 August 14. The CBF was found to have a lower initial velocity with weaker deceleration in STEREO observations compared to SDO (340 km s-1 and m s-2 as opposed to 410 km s-1 and m s-2). The CBF kinematics from SDO were found to be highly passband-dependent, with an initial velocity ranging from km s-1 to km s-1 and acceleration ranging from m s-2 to m s-2 in the 335 Å and 304 Å passbands respectively. These kinematics were used to estimate a quiet coronal magnetic field strength range of 1–2 G. Significant pulse broadening was also observed, with expansion rates of 130 km s-1 (STEREO) and 220 km s-1 (SDO). By treating the CBF as a linear superposition of sinusoidal waves within a Gaussian envelope, the resulting dispersion rate of the pulse was found to be 8–13 Mm2 s-1. These results are indicative of a fast-mode magnetoacoustic wave pulse propagating through an inhomogeneous medium.
1 Introduction
Coronal bright fronts (CBFs; commonly called “EIT Waves”) in Extreme UltraViolet (EUV) observations of the low solar corona were first noted by Moses et al. (1997) and characterised by Thompson et al. (1998). They have since been studied extensively using EUV observations from the SOHO (Thompson et al., 1999), TRACE (Wills-Davey & Thompson, 1999), STEREO (Long et al., 2008) and most recently SDO (Liu et al., 2010) spacecraft. CBFs are usually observed as diffuse bright fronts propagating isotropically when unimpeded at typical velocities of 200–400 km s-1 across the solar disk (Thompson & Myers, 2009). They are best observed using the 195 Å passband, at a temperature of 1–2 MK and height of 70–90 Mm above the photosphere (Patsourakos et al., 2009; Kienreich et al., 2009). However, they have also been observed in other passbands, including 171 Å (Wills-Davey & Thompson, 1999), 284 Å (Zhukov & Auchère, 2004), 304 Å (Long et al., 2008) and the 94, 131, 211, and 335 Å passbands monitored by the Atmospheric Imaging Assembly (AIA) onboard SDO (Liu et al., 2010).
Despite more than 15 years of study using observations from ground-based (Gilbert et al., 2004; Chen, 2009) and space-based (Attrill et al., 2009; Chen et al., 2010) instruments, CBFs remain an enigma with many competing theories attempting to explain this phenomenon. They have been alternatively interpreted as magnetohydrodynamic waves (Wang, 2000; Warmuth et al., 2004b; Wang et al., 2009; Schmidt & Ofman, 2010), solitons (Wills-Davey et al., 2007) and in terms of magnetic field restructuring during the eruption of an associated CME (Chen et al., 2002; Attrill et al., 2007; Delannée et al., 2008). For a detailed description of CBFs, see the recent reviews by Gallagher & Long (2010) and Wills-Davey & Attrill (2010).
Traditional analysis of CBFs has produced kinematics that are inconsistent with MHD wave theory, implying a pseudo-wave interpretation. However, recent observations of decelerating CBFs combined with the effects of low observing cadence (Long et al., 2008; Ma et al., 2009) suggest that this may not be the case. There have also been indications of CBF dispersion with propagation (Warmuth et al., 2004b; Long et al., 2011), although this has been difficult to quantify. While these properties are inconsistent with ideal MHD wave theory, they have been shown in simulations by Murawski et al. (2001) and Nakariakov et al. (2005) to be a natural result of propagation through an inhomogeneous medium.
SDO/AIA observes the Sun continuously at a cadence of 12 s in seven EUV passbands, an improvement on both SOHO/EIT (900 s in one of four passbands) and STEREO/EUVI (75–600 s in four passbands). While this will enable a deeper understanding of the solar corona across a wide range of temperatures, the resulting data volume (1.5 TB per day) has necessitated the development of both automated and semi-automated CBF detection and tracking algorithms (Podladchikova & Berghmans, 2005; Wills-Davey, 2006; Long et al., 2011). Here, the semi-automated CBF algorithm outlined by Long et al. (2011) is applied to SDO and STEREO observations of the 2010 August 14 CBF and used to determine its physical characteristics.
2 Observations and Data Analysis
The 2010 August 14 CBF event111Solar Object Locator: SOL2010-08-14T09:38:00L353C79 erupted from NOAA active region (AR) 11093, with an associated coronal mass ejection (CME) and GOES C4.4 flare which started at 09:38 UT. The AR location (N11W65) meant that the on-disk CBF evolution was visible from STEREO-A and SDO but not STEREO-B. When the eruption occurred, STEREO/EUVI-A had an observing cadence of 300 s and 600 s in the 195 Å and 304 Å passbands respectively, with the 171 Å and 284 Å passbands both taking synoptic data (i.e., one image every two hours). SDO/AIA was taking observations with 12 s cadence in all seven EUV passbands (94, 131, 171, 193, 211, 304, and 335 Å) over the same time period. The event is shown in the accompanying movies, with windowed running difference (RD) movies used for the 193 (; movie_1.mov) and 304 Å (; movie_2.mov) passbands from SDO due to the very small relative intensity change between consecutive images. A normal RD movie was used to show the STEREO 195 Å passbands (; movie_3.mov).
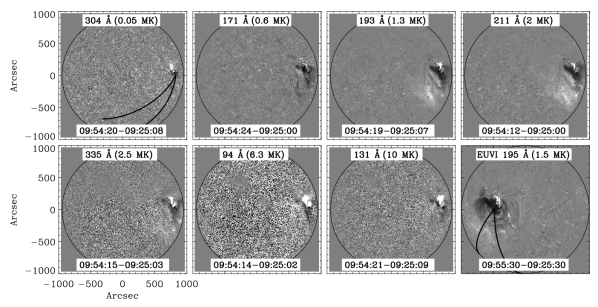
The semi-automated detection algorithm used to identify and track the CBF in both EUVI and AIA data works in several steps (see Long et al., 2011, for more details). The CBF source location was first defined using the mean centre of ellipses fitted to the first three observations of the CBF in both 193 Å (AIA) and 195 Å (EUVI) data, giving a source unique to both spacecraft (although both sources are comparable when transformed between spacecraft). Percentage base difference (PBD) images (Wills-Davey & Thompson, 1999) were used for this analysis, with each image de-rotated to the same time (09:20:30 UT) to compensate for solar rotation and a pre-event time 09:25:00 UT used to define the base image in each passband (see Figure 1). An arc sector was then positioned to allow comparison of both AIA and EUVI observations.
The PBD intensity of a given image was averaged across the position angle of the arc sector in annuli of increasing radii and 0.5∘ width on the spherical surface, with the standard deviation giving the associated error. The resulting intensity profile was fitted using a Gaussian function, with the centroid and full width at half maximum (FWHM) giving the pulse position and width respectively. Each parameter has an associated error, quantifying the ability of the algorithm to detect the pulse. Although the source point position and orientation of the arc sector is determined by the user, the actual pulse detection is automated, allowing unbiased identification of the CBF. Once the intensity profiles for each image have been processed and fitted, the CBF is identified as a moving pulse, with any stationary bright features ignored.
3 Results
Pulse identification was found to be strongly influenced by passband rather than instrument, with the pulse observed in the 195 Å and 304 Å passbands from STEREO/EUVI (although only the 195 Å data was used here due to the low 304 Å cadence). In SDO/AIA, the pulse was tracked in four of seven passbands (193, 211, 304, and 335 Å) with the nature of the 94 Å and 131 Å passbands making identification difficult. Although a slight intensity decrease was visually identified in the 171 Å passband, this could not be tracked using the algorithm.
3.1 Kinematics
The pulse kinematics were determined by measuring the temporal variation in pulse centroid distance from the source point. The bootstrapping technique discussed by Long et al. (2011) was then used to fit a model of the form,
| (1) |
where is the initial distance of the pulse from the source point, is the initial velocity and is the constant acceleration.
The kinematics of the individual SDO passbands are shown in the top-left panel of Figure 2 to be comparable, although they do tend to separate with propagation. Similarly, the SDO 193 Å and STEREO 195 Å measurements (top-right panel of Figure 2) appear homologous, with a slight positional offset due to the different spacecraft positions.
The kinematics given in Table 1 show a lower initial velocity and much weaker acceleration in the 195 Å passband relative to the comparable 193 Å passband. The kinematic estimates from STEREO 195 Å are consistent with previous results derived using SOHO/EIT and STEREO/EUVI, while the higher initial velocity and acceleration from SDO 193 Å for the same event suggests a strong influence from the cadence of the observing instrument (cf. Long et al., 2008). The larger uncertainties associated with the kinematics analysis of the 304 Å passband may be explained by the nature of the passband and also by a data gap, which complicated detection of the pulse.
3.2 Pulse Broadening
The temporal variation in FWHM was examined for evidence of pulse broadening. The bottom-left panel in Figure 2 shows that the pulse width changes from 40 Mm to 270 Mm over a time period of 900 s. The data prior to 09:52 UT has been corrected to remove the effects of a stationary bright feature close behind the CBF. This feature initially exerts a strong influence on the Gaussian fit, but was negated by subtracting a constant offset value for each passband from the FWHM measurements. From 09:52 UT onward, the CBF is sufficiently far from this feature that the fit to the data is no longer affected. The effects of this bright feature can also be seen in the bottom-right panel in Figure 2, which shows the peak % intensity variation with distance. While the bright feature does initially influence the pulse width and peak intensity variation, a general increase and decrease is apparent for the pulse width and peak intensity respectively.
The dispersion was examined by treating the CBF as a linear superposition of sinusoidal waves within a Gaussian envelope, giving the equation,
| (2) |
where is the wavenumber, is the angular frequency, is the characteristic width and is the pulse group velocity (). The pulse extends in Fourier space from to ( where ), so that the velocity varies from to across the pulse. The pulse therefore broadens with propagation, with a spatial extent (FWHM) defined as,
| (3) |
where is the initial pulse width. This can be rewritten in terms of the change in group velocity as,
| (4) |
As the group velocity , the width of a dispersive pulse at any time is given by,
| (5) |
where is the rate of change of the group velocity of the pulse with respect to . Eqn. 5 can then be fitted to the FWHM measurements, allowing to be determined for each passband.
The expansion rate and the resulting value of from the bottom-left panel of Figure 2 are given in Table 1 for each passband. The general expansion rate in each case is positive within error, indicating statistically significant pulse broadening. This implies that CBFs are dispersive pulses, confirming the results of Warmuth et al. (2004b); Veronig et al. (2010) and Long et al. (2011).
3.3 Temperature Dependence
The kinematics of the CBF could be derived for individual passbands at different peak emission temperatures due to the very high cadence of SDO (see Table 1). A spread is apparent in both the initial velocity and acceleration of the pulse, from 380 to 460 km s-1 and to m s-2 respectively. This variation was studied by making a comparison with the peak emission temperatures () of the different AIA passbands (as given in Table 1 and discussed by O’Dwyer et al., 2010).
It was found that the CBF kinematics and for each passband are inversely related. As temperature tends to increase while density and magnetic field strength decrease with height in the quiet Sun, this implies that in cooler, more dense plasma the CBF has a higher velocity. This is characteristic of a compressive pulse and combined with the dispersion and deceleration indicates that the CBF is best described as a magnetohydrodynamic wave pulse. The randomly structured nature of the quiet corona suggests that any globally-propagating pulse must traverse magnetic field lines, indicating a fast-mode rather than slow-mode CBF interpretation.
The CBF morphology across different passbands shows some discrepancies that invite further investigation, particularly the simultaneous intensity decrease at 171 Å and increase in the cooler 304 Å passband. The 171 Å emission drop (visually identified here but not tracked) has been characterised as evidence of plasma heating from 171 Å into the 193, 211, and 335 Å passbands (Wills-Davey & Thompson, 1999; Liu et al., 2010). This heating implies that the CBF pulse is coronal, an observation consistent with the height measurements made by Kienreich et al. (2009) and Patsourakos et al. (2009), but complicated by the increase in 304 Å emission (dominated by two chromospheric He II lines at 303.781 and 303.786 Å). Although there is also a coronal Si XI emission line at 303.33 Å, O’Dwyer et al. (2010) have noted that this line does not make a notable contribution to AIA quiet Sun observations, suggesting that the observed intensity increase must be due to He II emission.
The formation mechanism of He II emission has been the subject of detailed investigation (see e.g., MacPherson & Jordan, 1999; Andretta et al., 2003; Jordan & Brosius, 2007) due to its complex nature, with results suggesting that it is formed by collisional excitation from thermal electrons in the quiet corona. The increased temperature gradient caused by passage of a compressive coronal pulse could enhance this effect, producing the observed 304 Å intensity increase. The CBF would therefore be coronal, as predicted by the observed drop in 171 Å intensity.
3.4 Coronal Seismology
The passband-dependent kinematics indicate that the pulse morphology is significantly influenced by the plasma through which it propagates. By examining how the plasma affects the kinematics for each passband, it is possible to directly quantify the characteristics of the quiet coronal plasma. For example, the fast-mode wave speed is defined as,
| (6) |
where the Alfvén speed and sound speed are and respectively. Here is the magnetic field strength, is the particle density, is the proton mass, is the adiabatic index (typically ), is Boltzmann’s constant and is the peak emission temperature (; the values used are given in Table 1). If the CBF pulse is treated as a fast-mode wave then the final pulse velocity (i.e., the velocity of the pulse when it can no longer be detected by the algorithm) must be the fast-mode velocity of the given passband, since the pulse can not propagate below this velocity. These values are given in Table 1 for each SDO passband studied.
By taking the peak emission temperature of each passband as the temperature, only the magnetic field strength and density are unknown in the above equations. Coronal magnetic field strength estimates typically involve extrapolating photospheric magnetic field measurements into the corona and are not very well constrained (particularly in the quiet Sun). In contrast, coronal densities can be estimated using density sensitive line ratios (Gallagher et al., 1999) and are well-constrained.
The above equations can be rearranged to give,
| (7) |
implying that the quiet coronal magnetic field strength may be estimated using the derived CBF kinematics. The final velocity values given in Table 1 were combined with a range of typical quiet coronal densities (2–6 cm-3; see Wills-Davey et al., 2007, for more details) to produce an estimated quiet coronal magnetic field strength range of 1–2 G. This is comparable to the value derived by West et al. (2011) from detailed STEREO/EUVI kinematic estimates and Hinode/EIS density measurements. The good agreement of the range estimated here with the work of West et al. (2011) indicates that our assumptions are correct and CBFs can be used to probe the physical characteristics of the plasma through which they propagate.
4 Discussion and Conclusions
Comparing EUVI and high cadence AIA observations of the 2010 August 14 CBF event allowed an examination of the accuracy of previous CBF kinematics estimates, which involved combining distance-time measurements from different passbands due to a paucity of data (e.g., Long et al., 2008; Patsourakos & Vourlidas, 2009; Kienreich et al., 2009; Veronig et al., 2010). While this was necessary to derive kinematics from the small data-sets available, our results indicate that this approach underestimated the general kinematics of the CBF. It may have also masked the pulse acceleration and did not detail the effect of the plasma on the pulse. The presence of deceleration in both EUVI and AIA data (despite the different cadence and spacecraft positions), also suggests that it is characteristic of the phenomenon.
The clear dispersion apparent in both EUVI and AIA data confirms the observations of Warmuth et al. (2004b); Veronig et al. (2010) and Long et al. (2011). These repeated measurements of significant pulse broadening strongly indicate that CBFs have a dispersive nature which, allied to the traditional point-and-click techniques for identifying them, may have contributed to the uncertainty surrounding their acceleration. When both the dispersion and deceleration are considered, CBFs may be best described using a wave interpretation. Although this behavior is not predicted by ideal MHD wave theory, it is consistent with the results of Murawski et al. (2001) and Nakariakov et al. (2005), and the randomly structured nature of the corona. The dispersion relation of the pulse was determined by treating it as a linear superposition of sinusoidal waves within a Gaussian envelope, allowing an insight into its physical nature.
The CBF pulse was observed to display kinematics that were dependent on the passband studied; a unique result that supports the wave interpretation of CBFs. In particular, the pulse exhibited a compressive nature, appearing to propagate at a higher velocity with stronger deceleration in cooler, denser plasma. This is the first observation of this property of CBFs, and is a result of the very high cadence capabilities of SDO/AIA. This kinematic variation also provides a simple diagnostic of the emitting plasma in each passband, allowing coronal seismology to be used to determine the physical parameters of the corona directly.
Even though CBF propagation has previously been proposed as a way of directly probing the structure of the solar corona, this has been complicated by their uncertain physical nature. The results presented here, in addition to recent work by Patsourakos et al. (2010); Kienreich et al. (2011) and Long et al. (2011) indicate that CBFs are fast-mode MHD waves, allowing them to be used to examine the environment through which they propagate. Alternative techniques can be used to determine typical densities and the temperature of the different passbands, allowing the magnetic field strength to be estimated using the CBF. The range of values derived here (1–2 G) are comparable to those estimated by West et al. (2011) (and typically assumed for the quiet corona, e.g., Wills-Davey et al., 2007), indicating that CBFs can be used to directly probe the plasma through which they propagate.
These results are most compatible with the wave interpretation of a CBF pulse. The observed dispersion implies that CBFs are not accurately described by the soliton model proposed by Wills-Davey et al. (2007), while the CBF height range (on-disk near the limb over an extended time period in both SDO and STEREO observations) is inconsistent with the progressively higher emission predicted by Delannée et al. (2008). The multi-temperature emission does not match the low foot-point signature predicted by Attrill et al. (2007) and there was no indication of the additional coronal Moreton wave predicted by Chen et al. (2002). Although the initial driver is uncertain, the CBF could be a product of the rapid over-expansion of the erupting CME bubble (cf. Patsourakos et al., 2010) before decoupling and propagating freely. The high cadence observations available from SDO will allow this issue to be resolved.
References
- Andretta et al. (2003) Andretta, V., Del Zanna, G., & Jordan, S. D. 2003, A&A, 400, 737
- Attrill et al. (2007) Attrill, G.D.R., Harra, L.K., van Driel-Gesztelyi, L. & Démoulin, P. 2007, ApJ, 656, L101
- Attrill et al. (2009) Attrill, G. D. R., Engell, A. J., Wills-Davey, M. J., Grigis, P., & Testa, P. 2009, ApJ, 704, 1296
- Chen et al. (2002) Chen, P. F., Wu, S. T., Shibata, K., & Fang, C.2002, ApJ, 572, L99
- Chen (2009) Chen, P. F. 2009, ApJ, 698, L112
- Chen et al. (2010) Chen, F., Ding, M. D., & Chen, P. F. 2010, ApJ, 720, 1254
- Delannée et al. (2008) Delannée, C., Török, T., Aulanier, G. & Hochedez, J.-F. 2008, Sol. Phys., 247, 123
- Gallagher et al. (1999) Gallagher, P. T., Mathioudakis, M., Keenan, F. P., Phillips, K. J. H., & Tsinganos, K. 1999, ApJ, 524, L133
- Gallagher & Long (2010) Gallagher, P. T., & Long, D. M. 2010, Space Sci. Rev., 127
- Gilbert et al. (2004) Gilbert, H. R., Holzer, T. E., Thompson, B. J., & Burkepile, J. T. 2004, ApJ, 607, 540
- Jordan & Brosius (2007) Jordan, S. D., & Brosius, J. W. 2007, The Physics of Chromospheric Plasmas, 368, 183
- Kienreich et al. (2009) Kienreich, I. W., Temmer, M. & Veronig, A. M., ApJ, 703, L118
- Kienreich et al. (2011) Kienreich, I. W., Veronig, A. M., Temmer, M., Muhr, N., Vršnak, B. & Nitta, N., ApJ, 727, L43
- Liu et al. (2010) Liu, W., Nitta, N. V., Schrijver, C. J., Title, A. M., & Tarbell, T. D. 2010, ApJ, 723, L53
- Long et al. (2008) Long, D. M., Gallagher, P. T., McAteer, R. T. J. & Bloomfield, D. S. 2008, ApJ, 680, L81
- Long et al. (2011) Long, D. M., Gallagher, P. T., McAteer, R. T. J., & Bloomfield, D. S. 2011, A&A, 531, A42
- Ma et al. (2009) Ma, S., et al. 2009, ApJ, 707, 503
- MacPherson & Jordan (1999) MacPherson, K. P., & Jordan, C. 1999, MNRAS, 308, 510
- Moses et al. (1997) Moses, D., Clette, F., Delaboudiniére, J. P., Artzner, G.E., Bougnet, M., Brounaudi, J. et al. 1997, Sol. Phys., 175, 571
- Murawski et al. (2001) Murawski, K., Nakariakov, V. M., & Pelinovsky, E. N. 2001, A&A, 366, 306
- Nakariakov et al. (2005) Nakariakov, V. M., Pascoe, D. J., & Arber, T. D. 2005, Space Sci. Rev., 121, 115
- O’Dwyer et al. (2010) O’Dwyer, B., Del Zanna, G., Mason, H. E., Weber, M. A., & Tripathi, D. 2010, A&A, 521, A21
- Patsourakos et al. (2009) Patsourakos, S., Vourlidas, A., Wang, Y. M., Stenborg, G. & Thernisien, A., Sol. Phys., 259, 49
- Patsourakos & Vourlidas (2009) Patsourakos, S., & Vourlidas, A. 2009, ApJ, 700, L182
- Patsourakos et al. (2010) Patsourakos, S., Vourlidas, A. & Kliem, B. 2010, arXiv:1008.1171v1
- Patsourakos et al. (2010) Patsourakos, S., Vourlidas, A., & Stenborg, G. 2010, ApJ, 724, L188
- Podladchikova & Berghmans (2005) Podladchikova, O., & Berghmans, D., Sol. Phys., 228, 265
- Schmidt & Ofman (2010) Schmidt, J. M., & Ofman, L. 2010, ApJ, 713, 1008
- Thompson et al. (1998) Thompson, B. J., Plunkett, S. P., Gurman, J. B., Newmark, J. S., St. Cyr, O. C., & Michels, D. J. 1998, Geophys. Res. Lett., 25, 2465
- Thompson et al. (1999) Thompson, B. J., et al. 1999, ApJ, 517, L151
- Thompson & Myers (2009) Thompson, B. J. & Myers, D. C. 2009, ApJS, 183, 225
- Veronig et al. (2010) Veronig, A. M., Muhr, N., Kienreich, I. W., Temmer, M., & Vršnak, B. 2010, ApJ, 716, L57
- Wang (2000) Wang, Y.-M. 2000, ApJ, 543, L89
- Wang et al. (2009) Wang, H., Shen, C., & Lin, J., ApJ, 700, 1716
- Warmuth et al. (2004b) Warmuth, A., Vršnak, B., Magdalenić, J., Hanslmeier, A. & Otruba, W. 2004, A&A, 418, 1117
- West et al. (2011) West, M. J., Zhukov, A. N., Dolla, L., & Rodriguez, L. 2011, ApJ, 730, 122
- Wills-Davey & Thompson (1999) Wills-Davey, M. J., & Thompson, B. J. 1999, Sol. Phys., 190, 467
- Wills-Davey (2006) Wills-Davey, M. J. 2006, ApJ, 645, 757
- Wills-Davey et al. (2007) Wills-Davey, M. J., DeForest, C. E., & Stenflo, J. O. 2007, ApJ, 664, 556
- Wills-Davey & Attrill (2010) Wills-Davey, M. J., & Attrill, G. D. R. 2009, Space Sci. Rev., 149, 325
- Zhukov & Auchère (2004) Zhukov, A.N. & Auchère F. 2004 A&A, 427, 705

| Spacecraft | Passband | aa here refers to the peak emission temperature of each passband. | Expansion Rate | ||||
|---|---|---|---|---|---|---|---|
| Å | MK | km s-1 | m s-2 | km s-1 | Mm2 s-1 | km s-1 | |
| STEREO-A | 195 | 1.5 | |||||
| SDO | AllbbDistance-time measurements for all passbands observed by AIA were combined for comparison. | ||||||
| 335 | 2.5 | ||||||
| 211 | 1.8 | ||||||
| 193 | 1.6 | ||||||
| 304 | 0.05 |