A Monte Carlo study of surface sputtering by dual and rotated ion beams
Abstract
Several, recently proposed methods of surface manufacturing based on ion beam sputtering, which involve dual beam setups, sequential application of ion beams from different directions, or sample rotation, are studied with the method of kinetic Monte Carlo simulation of ion beam erosion and surface diffusion. In this work, we only consider erosion dominated situations. The results are discussed by comparing them to a number of theoretical propositions and to experimental findings. Two ion-beams aligned opposite to each other produce stationary, symmetric ripples. Two ion beams crossing at right angle will produce square patterns only, if they are exactly balanced. In all other cases of crossed beams, ripple patterns are created, and their orientations are shown to be predictable from linear continuum theory. In sequential ion beam sputtering we find a very rapid destruction of structures created from the previous beam direction after a rotation step, which leads to a transient decrease of overall roughness. Superpositions of patterns from several rotation steps are difficult to obtain, as they exist only in very short time windows. In setups with a single beam directed towards a rotating sample, we find a non-monotonic dependence of roughness on rotation frequency, with a very pronounced minimum appearing at the frequency scale set by the relaxation of prestructures observed in sequential ion beam setups. Furthermore we find that the logarithm of the height of structures decreases proportional to the inverse frequency.
pacs:
68.55.-a,68.35.Ct,05.45.-a,79.20.Rf,81.16.RfI Introduction
In recent years ion-beam sputtering (IBS) as a method of nanoscale surface manufacturing Navez et al. (1962) has attracted much experimental work (for a recent review see Ref. Frost et al., 2008). Self-organized ripple patterns appear generically by oblique incidence single-beam IBS, and dot or hole patterns are obtainable by normal-incidence IBS or by oblique incidence IBS on rotating samples. To produce a larger variety of structures and to improve their quality, more complex setups with multiple ion beams, IBS on prestructured samples, and rotating samples have been used, but few of them have been investigated in detail. In particular, Carter Carter (2004, 2005, 2006) has proposed the use of dual ion beam sputtering (DIBS), Vogel and Linz Vogel and Linz (2007) proposed a four-beam setup and claimed that corresponding results may be obtained from a sequence of prestructuring and stepwise beam or sample rotation using a single ion beam (sequential ion beam sputtering or SIBS). Continuous rotation of the sample or the ion beam (referred to as RIBS, i.e. rotating IBS, in the following) has been proposed to suppress ripple formation Zalar (1985a, b) (for example in SIMS and AES, where ripple formation would reduce the depth profiling resolution), but also to enhance the quality of isotropic structures.Bradley (1996) These proposals were based on continuum theories of the self-organized pattern formation by IBS, which are further developments of the work of Sigmund Sigmund (1969) , Bradley and Harper Bradley and Harper (1988) and Makeev et al..Makeev et al. (2002) Recently, Joe, Kim et al.Joe et al. (2009) conducted a systematic experimental study of DIBS and SIBS on Au(001). A number of their findings are not in accordance with expectations derived from the conventional continuum framework. This motivated us to study DIBS, SIBS and RIBS setups with Monte Carlo (MC) simulation methods. Recent proposals Vogel and Linz (2007); noz Garcia et al. (2009) are based upon extensions of the standard continuum model (which is formulated as an anisotropic and noisy Kuramoto-Sivashinsky equation). These extensions have introduced new physical mechanisms, which change the scenario of pattern formation of the standard model, but none of these mechanisms has been confirmed and tested independently beyond doubt. In this situation, it may be helpful to see, what can be achieved from a simulation, which is a straightforward stochastic implementation of Sigmund’s energy deposition and sputtering formula, combined with independently tested models of surface diffusion in simple model systems, but without any further approximations.
In the next section, we briefly introduce our MC simulation method and the geometries of the considered setups. Subsequently, we present and discuss results we obtained for the topographies, the shape and orientation of the ripples, the structure function and the evolution of roughness in different setups. We compare our findings to theoretical proposals, experimental results and to the standard linear continuum model.
II Monte Carlo simulation
Throughout this work, we will focus on the erosion dominated regime, leaving more complex interplays between erosion and diffusion in multi-beam and rotating setups for further studies. Parameters of the simulations (given below) are chosen appropriately, such that in single ion beam setups, ripples perpendicular to the direction of the beam are produced on non-rotating samples and cellular structures occur on rotating samples.Yewande et al. (2006, 2007)
Fig. 1 depicts the geometries of setups we use in the simulations. A DIBS setup consists of two ion beams incident from directions described by polar angles and and azimuthal angles and (see Fig. 1(a)). As a simple special case, we will consider opposing beams, i.e. and . Crossed beams are studied for equal polar angles as well as for the general case of different polar and azimuthal angles.
(a)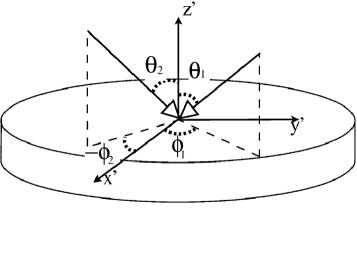 (b)
(b)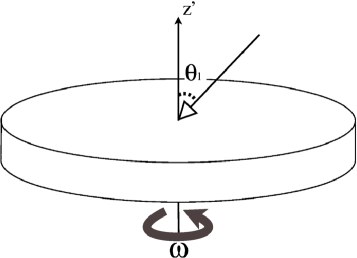 (c)
(c)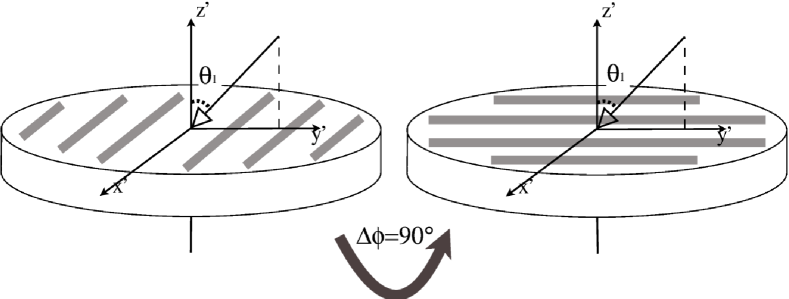
SIBS setups are shown in Fig. 1(c). In a first step ripples are produced by a single ion beam. Then we change the azimuthal angle of the ion beam direction by some and monitor the further evolution of surface structures.
Finally, Fig. 1(b) shows the RIBS setup, which is characterized by a constant angular velocity of the sample, which we realize by a fixed sample and a correspondingly rotation beam. The evolution of structures and surface roughness will be systematically studied as a function of .
A first version of our Monte Carlo model of erosion and surface diffusion has been introduced in Ref. Hartmann et al., 2002. Further developments of the model are discussed in Ref. Hartmann et al., 2009. Here, we use a solid-on-solid cubic lattice with an initially flat surface of size with . Its configuration is described by a single valued, time dependent, height function , which obeys periodic boundary conditions.
Ions start from a random position above the surface and move towards the surface in direction . Erosion occurs as a result of energy transfer via collision cascades induced by impinging ions. The ions penetrate the surface through a depth of . The average energy distribution of a cascade initialized by a single ion is approximated by a Gaussian distribution which has width of in directions of ion-beam and perpendicular to the ion-beam, respectively. As default values, we use , and lattice constants. Every lateral atom is a candidate for erosion, the probability of erosion being proportional to the amount of energy, which reaches the atom. The parameters are tuned so that the average yield is atoms per ion. The natural time scale in this type of MC simulations is proportional to ion fluence, therefore we use 1 ML ions, corresponding to 1 ion per atom at the flat surface as unit of time in this work. It is connected to laboratory time via the ion flux.
Surface diffusion is modeled as thermally activated hopping. In a diffusion sweep every surface atom has the chance to hop to a nearest neighboring site. The attempt frequency is calibrated to a temperature of and a substrate barrier of is chosen. This implies that after every incoming ions, one diffusion sweep over the surface is taken.Hartmann et al. (2009) The hops are accepted with the probability of . The additional energy barrier () consists of two terms, . Here is the net number of broken bonds after the hop. If this net number is negative, i.e. additional bonds have been created, is put equal to zero. We choose as nearest neighbor bond energy. is an Ehrlich-Schwoebel barrier term (ES), which is only nonzero, if an ad-atom approaches a step edge from an upper terrace. More details about the surface diffusion modeling can be found in Ref. Hartmann et al., 2009.
The rotation of sample during IBS is equivalent to a fixed sample and a rotating ion beam. Therefore rotation or any change of azimuthal angles in lab coordinates is simulated by keeping the surface fixed and rotating the ion beam correspondingly.
In a single beam setup, a typical run of the above described MC simulation, starts from a flat surface, after the first, short ripples appear, and after regular ripples of the size of the system have formed (see Fig. 2(a)). As fluence increases, the ripple pattern shows less defects (branching and deviation from expected direction). We also observe ripple motion, but will not report details about its characteristics in this work.Yewande et al. (2005)
III Results and Discussion
III.1 Opposed ion-beams
It has been proposed by Carter Carter (2005) that IBS with two diametrically opposed ion-beams (same and a difference of in ) can lead to a cancellation of instabilities induced by each beam. Instead, he predicted temporal oscillations of ripple amplitudes. Furthermore, ripple motion should be suppressed due to the restoration of reflection symmetry, which would be broken by a single beam.
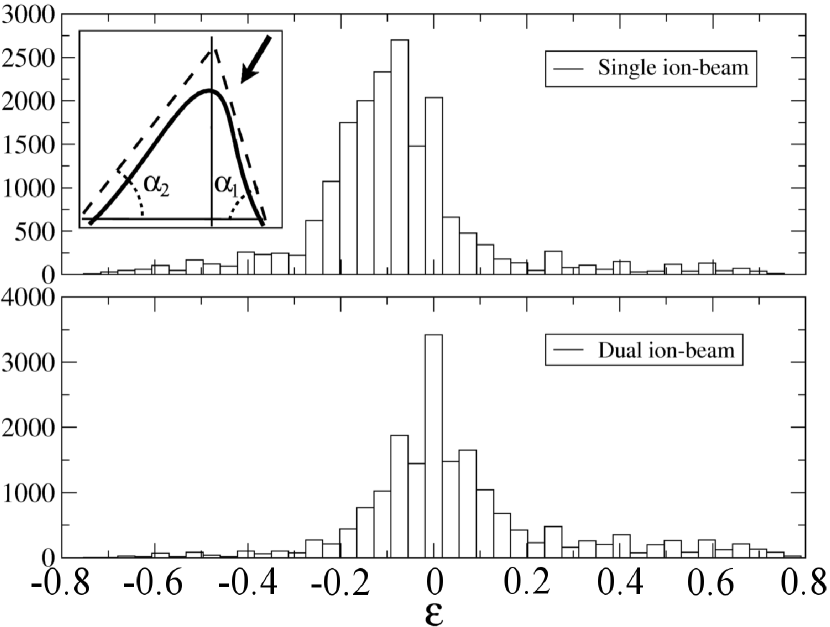
Fig. 2(b) shows results of topographies obtained from MC simulations of this setup. We never observe the predicted behavior, instead the growth of structures resembles that obtained in a single beam setup, as can be seen from comparing Figs. 2 (a) and (b). But ripples obtained from opposed beams appear longer and more straight than those from single beams and the patterns contain less defects. Furthermore, the shape of ripples changes significantly towards more symmetric slopes. In Fig. 3, we show a quantitative analysis of ripple slope angles and , which are defined in the inset of the upper panel. To measure the symmetry of the slopes, we consider the asymmetry parameter
| (1) |
Histograms of this quantity are shown in Fig. 3 for single beam and opposed beam setups. The average value of is for single beams (indicating that the steeper slope is facing the beam), and for opposed beams. We also checked, that the skewness of the -distribution is reduced by using opposed beams. Thus, this setup may have merits in producing ripple structures of higher quality and order.
(a)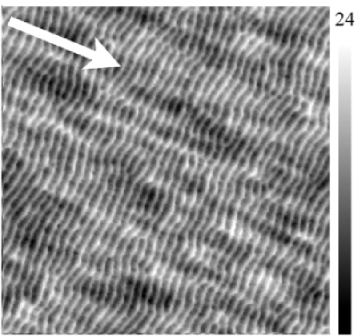 (b)
(b)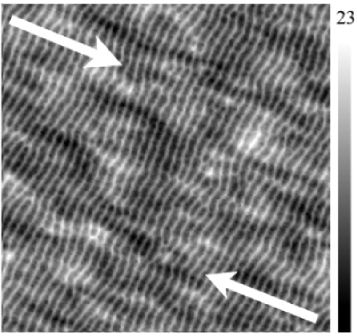
III.2 Crossed ion beams
Setups of multiple ion beams incident from different directions have been proposed by Carter in Refs .Carter, 2004 and Carter, 2005. Vogel and Linz developed a continuum theory for a setup with four beams , all with the same polar angles of incidence and crossing with . Their theory is based on a damped Kuramoto-Sivashinsky equation and takes into account terms up to fourth order in a gradient expansion of the erosion term. They predict square patterns, which can be stable in the long time regime under specific conditions.Vogel and Linz (2007) Joe et al. performed experiments with two ion-beams with and on Au(001). Joe et al. (2007, 2009) They find nanodot patterns with square symmetry (albeit with a rather low degree of order), if the fluxes of the two beams are precisely balanced. Otherwise, the structures develop into modulated ripples.
In Fig. 4 upper row, we show simulation results for perfectly balanced ion beams (beam parameters (1) in Table 1). The middle row of Fig. 4 shows results for ion beams with different intensities incident from the same polar angle ((2) and (3) in Table 1) and the lower row shows corresponding results for ion beams of identical intensities, but incident from different polar angles and with different beam parameters ((1) and (4) in Table 1). White arrows in Fig. 4 indicate the projection of the ion beams into the plane (thus they enclose ), and we have chosen the geometry such that the x-axis always is the bisector of this angle. For balanced beams and , we observe ripples with a wave vector parallel to the x-axis, for , the ripple wave vector is parallel to the y-axis, but the ripple pattern shows more defects. Exactly at , square patterns replace the ripples. For unbalanced beams, we observe ripples in oblique directions, which we will discuss below. The erosion rates parallel and perpendicular to the beam projection onto the plane, and , are given in Table 1. The middle and lower row of Fig. 4 are given to emphasize that we did not observe any differences in pattern formation due to different mechanisms of imbalance. All mechanisms we tried lead to the same patterns, if they imply the same erosion rates of linear theory, up to a common constant factor.
Note, however, that in all our simulations both rates and are negative — unlike the situation in Ref. Joe et al., 2009 — indicating that the crossed beams do not mutually suppress their generated ripples. Thus we have nothing to say here about the puzzling results of Ref. Joe et al., 2009, who find structures in DIBS setups, for which a straightforward application of continuum theory would predict smooth surfaces.
Let us analyze our findings within the simple framework of linear Bradley-Harper theory. Suppose beams 1 and 2 are characterized by erosion rates and . Averages of the rates over the two beams are denoted by and we introduce . According to linear theory, the growth of Fourier modes is controlled by the (real) growth rate , which is a quadratic form of the wave vector, i.e. with a matrix of erosion rates. The growth rate of the fastest growing mode and its direction are obtained by determining the largest eigenvalue of and the corresponding eigenvector. is easily calculated. Its matrix elements take on the form
| (2) | |||||
and . For balanced beams, the vanish and the erosion rate matrix becomes diagonal, indicating that ripples will only appear with wave vectors either parallel to the x-axis or parallel to the y-axis. At , the rates in both directions become degenerate and square patterns will emerge, if they are stabilized by the nonlinear terms. As , it is obvious from Eq. 2 that the regime can be mapped to by interchanging x and y. This explains the main features of the upper row of Fig. 4.
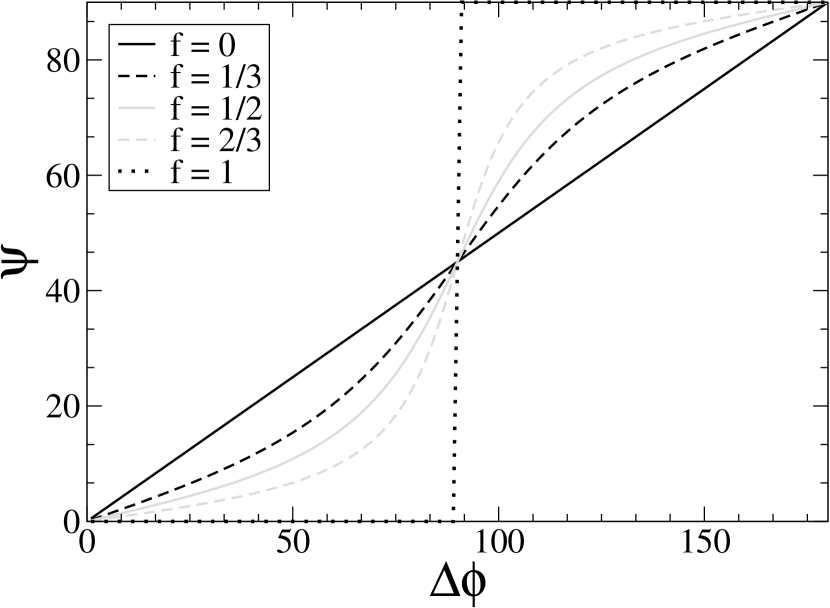
For unbalanced beams, the orientation of ripples will generally depend both on and the imbalances in growth rates , but for the situation is simpler. The cosine terms vanish, and the eigenvectors of the simpler matrix become independent of the rate imbalances. Thus, the linear theory predicts ripples with wavevectors inclined by or with respect to the x-axis, i.e. parallel to one of the beams (from the eigenvalues it follows that the wave vector is parallel to the dominant beam), irrespective of the amount or nature of the imbalance in growth rates, if . This result is in accordance with the experimental finding in Ref. Joe et al., 2009. The directions for other values of are easily obtained, if the imbalance is known. In Fig. 4, we have indicated these directions with dashed white lines and find an overall satisfactory agreement of simulation results with this prediction. Fig. 5 shows the predicted deviations of the orientation of ripple wavevectors from the x-axis, i.e. the bisector of the beam directions for different ratios of rates, .
| (1) | 9.3 | -4.4 | -0.86 | |
|---|---|---|---|---|
| (2) | 9.3 | -5.8 | -1.14 | |
| (3) | 9.3 | -2.9 | -0.57 | |
| (4) | 7.3 | -1.5 | -0.81 |
(a)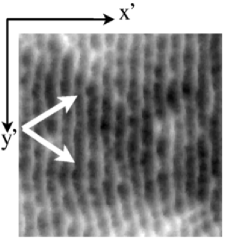 (b)
(b)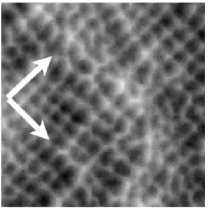 (c)
(c)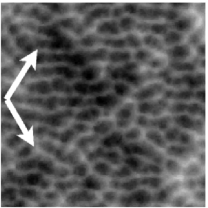
(d)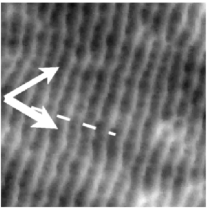 (e)
(e)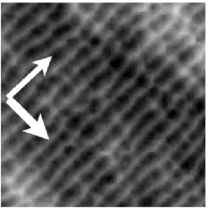 (f)
(f)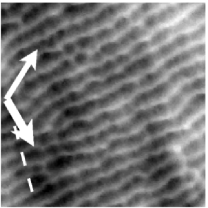
(g)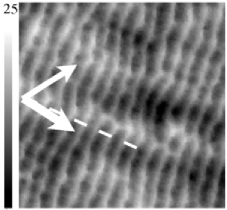 (h)
(h)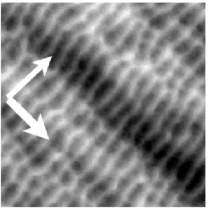 (i)
(i)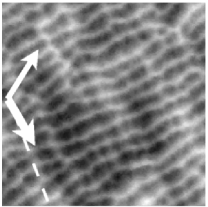
III.3 Sputtering of rippled surfaces
Since the possibilities of simultaneous sputtering by multiple beams are often limited in experiments, sequential sputtering by a single beam from different directions seems to be a more promising setup. Vogel and Linz proposed SIBS as a general substitute for multi-beam sputtering.Vogel and Linz (2007) Note that in SIBS setups, a precise balance between fluxes of multiple beams, which may be difficult to achieve in DIBS, can be adjusted by tuning the exposure time in each direction.
Joe et al. Joe et al. (2009) have recently performed experiments on Au(001) using an ion beam (incident from ), for which ripples with wave vectors perpendicular to the projection of the beam direction into the initial surface plane are formed. After rotating the target by (keeping fixed), the initially formed ripples are very rapidly destroyed and new ripples build up in the correspondingly rotated direction, but the authors could not get patterns corresponding to a superposition of two generations of ripples as expected from the predictions of continuum theory.
We have simulated SIBS with ion beams incident from and a rotation step of after monolayers of erosion. Initially, ripples appear with wave vectors parallel to the direction of the projected ion beam into the x-y plane (see Fig. 6(a)). After the rotation step, a correspondingly rotated ripple pattern builds up as shown in Fig. 6(c) . In a narrow time window, shortly after the rotation step (shown in Fig. 6(b), at ) a superposition of ripples of both orientations is observed. Fig. 6(d) shows the structure factor of the height profile, which depicts the degree of order.
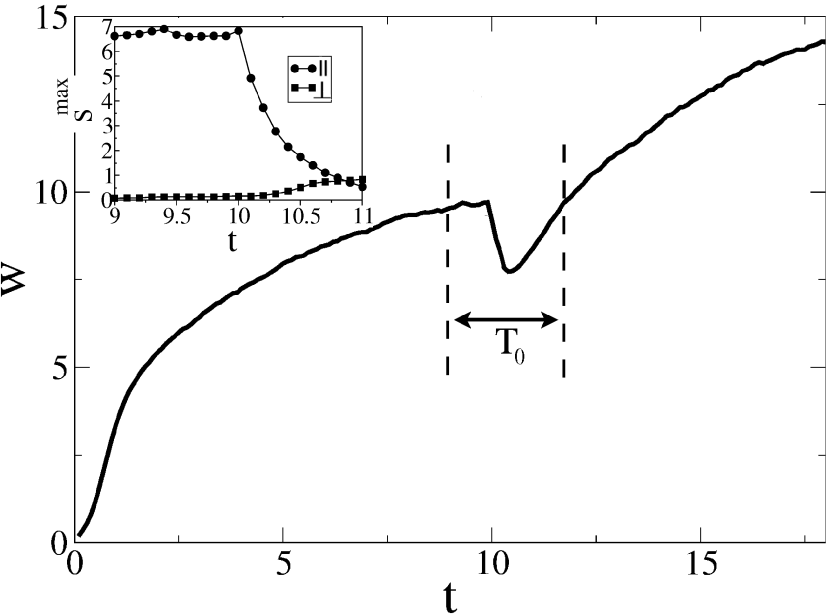
Beyond of erosion after the rotation step the time evolution of surface roughness (shown in Fig. 7) differs strongly from what one expects in linear continuum theory. There, the height of prestructured ripples, having already reached saturation, would neither grow further, nor will it decrease. Ripples generated by the new beam direction will grow exponentially and thereby catch up the height of the prestructure. The different scenario we observe in the simulations is shown in the inset of Fig. 7. After , during which the system follows the scenario predicted by Bradley-Harper theory, the prestructure collapses very rapidly and is flattened, leading to a transiently decreasing roughness. We define a structural relaxation time as the length of the interval from the rotation step through the transient decrease of roughness to the point, where roughness has retained its value immediately before the rotation step. Roughly this time interval contains all processes necessary to rotate the ripple pattern from the previous to the current rotation step. In our case . Although cannot be obtained from linear rate theory our observations need not be in contradiction with continuum theories, as the prestructure constitutes an initial condition beyond the range of validity of linear theory. Let us reemphasize that the roughness decreases transiently, despite the fact that both linear erosion rates and (see Table (1)) indicate an unstable growth of fluctuations in x and y direction. A superposed square pattern is observable, if the height of the growing new ripples and the shrinking old ones become comparable. For our parameters this takes place at after rotation in a narrow time window. In the experiments by Joe et al.Joe et al. (2009) values of growth rates are and . Since and , linear rate theory predicts that the old generation of ripples will decay immediately after a rotation step, which may cause an even faster collapse of the prestructure and make the time window of existence of a superposed structure unobservably small.
(a)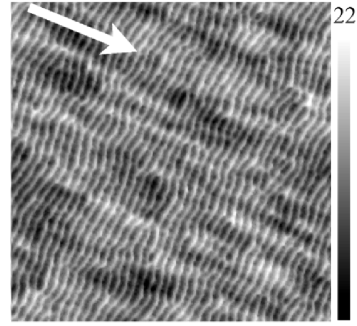 (b)
(b)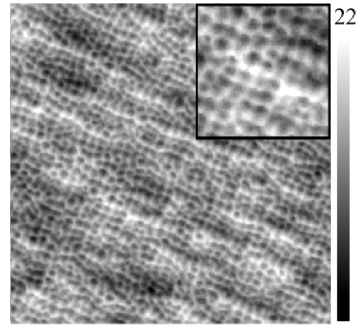
(c)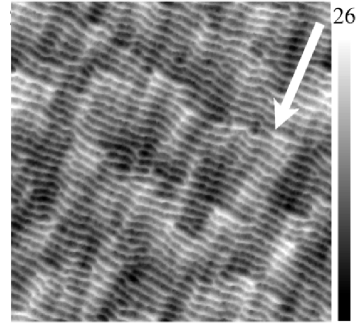 (d)
(d)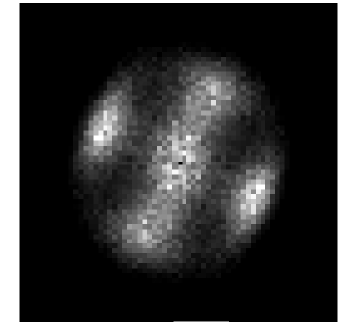
III.4 Sputtering of continuously rotating sample
Sample rotation during IBS is applied for various reasons. One motivation is to achieve suppression of pattern formation in SIMS and AES depth profiling.Zalar (1985a, b) There are numerous reports that RIBS can suppress surface roughening and enhance the resolution of depth profiling (see Ref. Carter, 1998 and its references). Although this method is frequently used, there are very few systematic studies of the effects of different parameters, in particular of the angular velocity of rotation.Tanemura et al. (1992) Previous discrete simulations could not successfully explain the observed strong suppression of roughening. Koponen et al. (1997) Recently, IBS has become a popular method for smooth etching of metallic surfaces.Reichel et al. (2007) Here too, sample rotation has been proposed as a practical measure Reichel et al. (2007) to prevent nano-scale roughening. A different motivation to use RIBS is the control of pattern formation. Frost et al. have found that off-normal IBS with sample rotation may lead to formation of hexagonal, close packed quantum dots.Frost et al. (2000); Frost and Rauschenbach (2003) This is attributed to a restoration of axial rotation symmetry with respect to the average surface normal, which is broken by off-normal incidence of a single ion beam at fixed azimuthal angle. Dot formation in rotated, off-normal IBS has been found in the framework of continuum theories Bradley (1996); Frost (2002); Castro et al. (2005), assuming a flux of incoming ions, which is distributed evenly over all azimuthal angles. This assumption corresponds to the limit of high rotation frequencies. Dots also appear in MC simulations performed in the high rotation frequency limit for a wide range of parameters.Yewande et al. (2007)
In the present work, we focus on the systematic dependence of height fluctuations on the rotation frequency, irrespective of the random or deterministic nature of these fluctuations. Therefore, we will study the roughness , averaged over the sample and an ensemble, as function of time and rotation frequency . Reported rotation frequencies cover a range from 0.1 to 15 rpm for different fluxes and different types of ions and materials. Frost and Rauschenbach (2003); Zalar (1985a, b); Konarski and Hautala (1995); Cui et al. (2005) There is a predictions of the scaling of height with , which, in Ref. Bradley and Cirlin, 1996, is given in the form
| (3) |
It is based on the original linear Bradley-Harper theory in rotating coordinate systems. Furthermore, Cui et al. reported that ripples do not form for angular frequencies greater than 0.1 rpm.Cui et al. (2005) (for a flux of ions cm-2 s-1 of 300 eV Ar+ on GaN substrate).
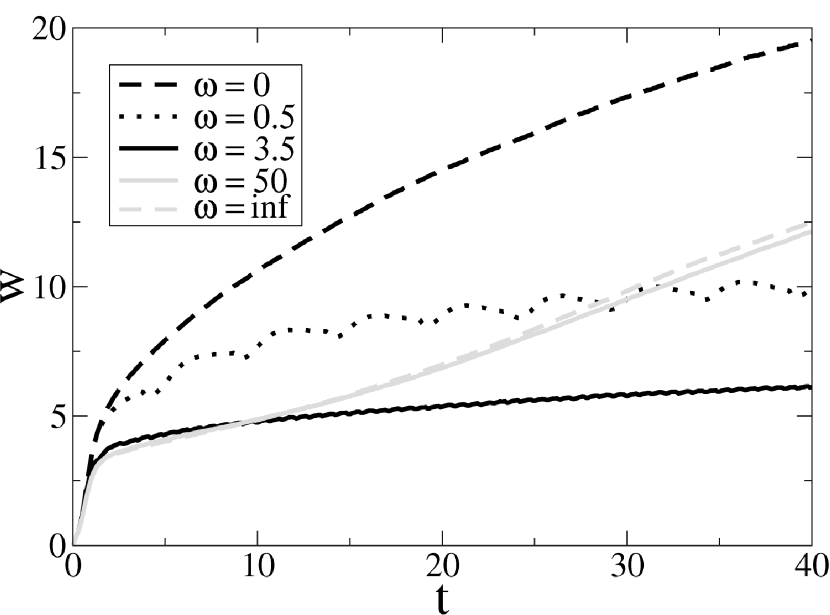
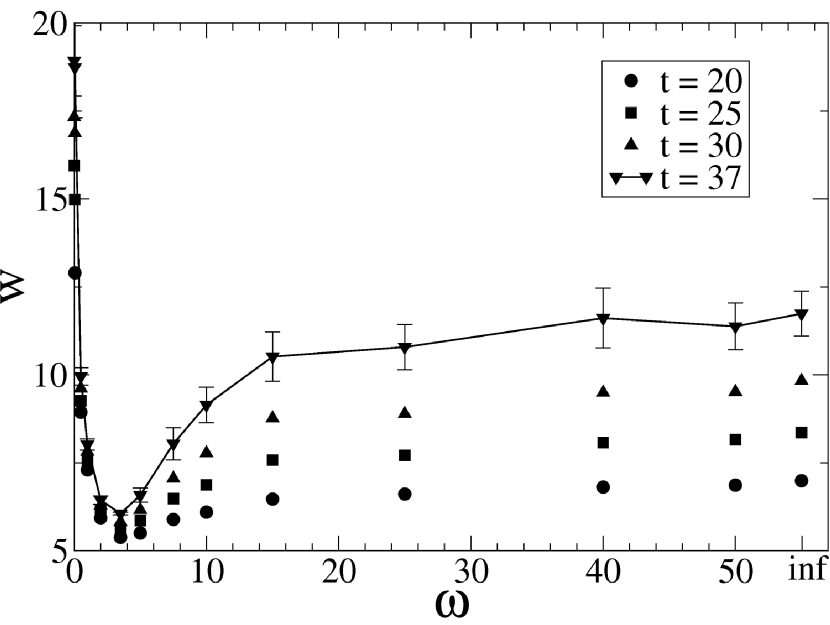
In section III.3, we have defined a characteristic response time of the IBS generated structures to sudden changes of the beam direction. We propose that this time scale is also of relevance for RIBS, as surface structures might follow rotation frequencies much smaller than adiabatically. On the other hand might correspond to the high frequency limit. We performed simulations with different rotation frequencies varying in the range , with per eroded monolayer taken from our SIBS simulations. For low frequencies, ripples form and rotate in synchrony with the beam direction. For high frequencies, ( is included as it corresponds to random azimuthal directions of incoming ions chosen from a flat distribution), cellular structures of growing size are observed. These findings are in agreement with predictions in Ref. Bradley, 1996. A mixture of short ripples and cellular structures appears at intermediate . Somewhat surprisingly, the roughness of the surface is not a monotonous function of rotation frequency. In Fig. 8 roughness is shown as a function of time for different . For low (including ) and high frequencies, it grows monotonically, approaching approximately equal growth rates beyond , independent of . For intermediate , the roughness shows oscillations (with frequencies ), and its growth rate is strongly suppressed. For growth rate reaches a minimum. In Fig. 9 the roughness, averaged over a period , is shown against , for times up to . For increasing , the minimum at becomes more and more pronounced. Thus our simulations predict an optimal rotation frequency, if preparations aim at smooth surfaces. This frequency also marks the frequency scale beyond which ripples do no longer appear. The very rapid crossover to non-ripple structures is in accordance with findings of Ref. Cui et al., 2005.
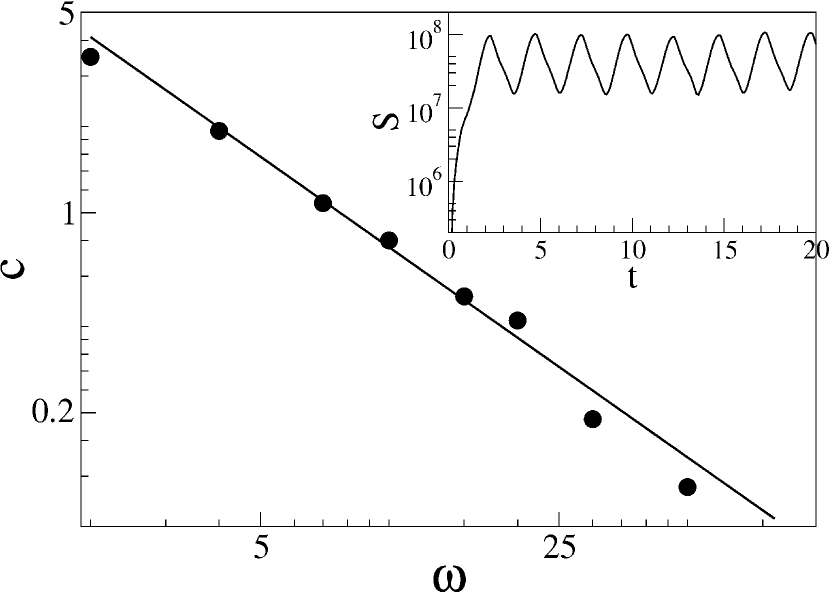
To compare our results with the prediction of Eq. 3 about the scaling of height with , we studied for a fixed value of wavevector . It grows rapidly and then oscillates with frequency around a saturation value with an -dependent amplitude , as shown in the inset of Fig. 10. The oscillatory behavior with frequency is also present in Eq. 3. The main part of the figure depicts the decrease of the oscillation amplitude with increasing in a double logarithmic plot. The fitted line has a slope of , which is very close to the behavior suggested by Eq. 3. Note, however, that this equation was derived from linear theory and has to be multiplied by an exponential growth factor, whereas our result applies to the non-linear saturation regime. Due to the rapid initial growth, the regime of validity of Eq. 3 remained unobservable.
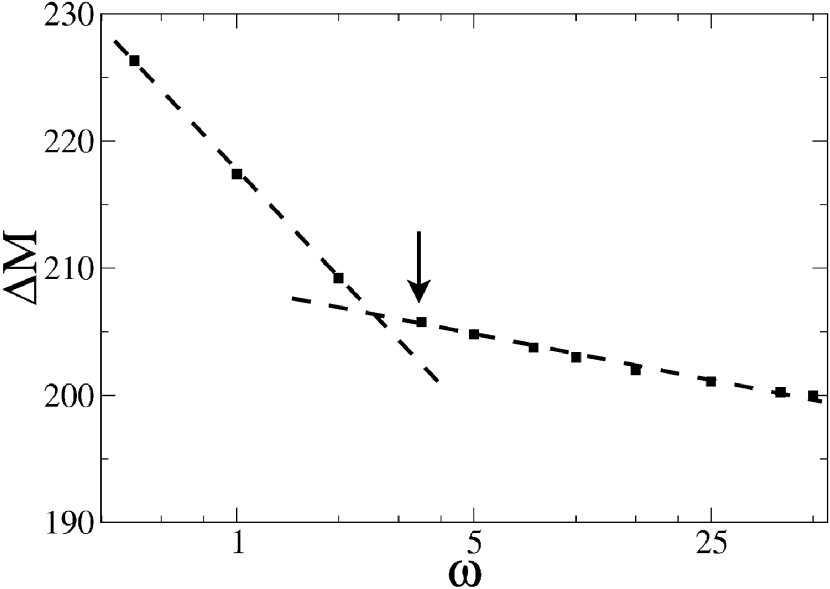
We also measured the total amount of eroded material, up to for different rotation frequencies. This integrated yield decreases with increasing and displays a clear distinction between a low- and a high-frequency regime in a semi-log plot, shown in Fig. 11. The interpolated crossover frequency between these regimes is very close to , the frequency, which minimizes the total roughness (see Fig. 9). This is in accordance with our findings (see Fig. 7) that more pronounced rippled prestructures (developing at low rotation frequencies at an angle ) decay more rapidly (at ) than the smaller and less regular height fluctuations, which appear at higher rotation frequencies.
IV Conclusion and Outlook
We studied dual ion beam sputtering (DIBS), sequential ion beam sputtering (SIBS) and rotating ion beam sputtering (RIBS) by a kinetic MC simulation technique, which combines erosion events due to single ions and surface diffusion. For a DIBS setup with two diametrically opposed beams, we did not confirm predictions by Carter Carter (2005), but rather found non-moving ripples with orientations as in a single ion beam setup. The ripples have a higher degree of order and more symmetrical slopes as compared to those created by single beam sputtering. For DIBS setups with crossed ion-beams, we find ripple patterns for crossing angles and square patterns for crossing of balanced beams at exactly right angle. The ripple orientations follow the predictions from linear Bradley Harper theory. Any kind of beam-imbalance leads to ripple patterns oriented according to the dominant beam. This is in accordance with the experimental observation in Ref. Joe et al., 2009. For SIBS setups, we found a vary rapid destruction of the ripple prestructure of the previous rotation step, which cannot be explained by linear Bradley-Harper theory. The flattening of the prestructure leads to a transient decrease in total roughness. Only within a very short time window, the growing new generation of ripples and the shrinking old ones lead to a superposed square pattern. Thus we could not confirm propositions to use SIBS as a universal substitute for complicated multi-beam setups. The rapid destruction of the prestructure is in accordance with findings of Ref. Joe et al., 2009. For RIBS setups we observed a non-monotonic dependence of roughness upon rotation frequency. At a frequency scale set by the structural relaxation time of prestructures, which can be observed in SIBS simulations, an increasingly pronounced minimum of roughness occurs with increasing time. We found that the structure factor at fixed wavevector rapidly approaches stationary oscillations around a saturation value with oscillation amplitudes inversely proportional to frequency. This behavior was also predicted from linear theory, but seems to have a much broader range of validity.
Acknowledgements.
We like to thank Roland Bennewitz, Hans Hofsäss and Kun Zhang for useful discussions.References
- Navez et al. (1962) M. Navez, C. Sella, and C. Chaperot, Compte. Rend. 254, 240 (1962).
- Frost et al. (2008) F. Frost, B. Ziberi, A. Schindler, and B. Rauschenbach, Appl. Phys. A 91, 551 (2008).
- Carter (2004) G. Carter, Vacuum 77, 97 (2004).
- Carter (2005) G. Carter, Vacuum 79, 106 (2005).
- Carter (2006) G. Carter, Vacuum 81, 138 (2006).
- Vogel and Linz (2007) S. Vogel and S. J. Linz, Phys. Rev. B 75, 085425 (2007).
- Zalar (1985a) A. Zalar, Thin Solid Films 124, 223 (1985a).
- Zalar (1985b) A. Zalar, Surf. Interface Anal. 9, 41 (1985b).
- Bradley (1996) R. M. Bradley, Phys. Rev. E 54, 6149 (1996).
- Sigmund (1969) P. Sigmund, Phys. Rev. 184, 383 (1969).
- Bradley and Harper (1988) R. M. Bradley and J. M. E. Harper, J. Vac. Sci. Technol. A 6, 2390 (1988).
- Makeev et al. (2002) M. A. Makeev, R. Cuerno, and A.-L. Barabási, Nucl. Instr. and Meth. B 197, 185 (2002).
- Joe et al. (2009) M. Joe, C. Choi, B. Kahng, J.-H. Kim, and J.-S. Kim, J. Phys.: Condens. Matter 21, 224011 (2009).
- noz Garcia et al. (2009) J. M. noz Garcia, R. Cuerno, and M. Castro, J. Phys.: Condens. Matter 21, 224020 (2009).
- Yewande et al. (2006) E. O. Yewande, R. Kree, and A. K. Hartmann, Phys. Rev. B 73, 115434 (2006).
- Yewande et al. (2007) E. O. Yewande, R. Kree, and A. K. Hartmann, Phys. Rev. B 75, 155325 (2007).
- Hartmann et al. (2002) A. K. Hartmann, R. Kree, U. Geyer, and M. Koelbel, Phys. Rev. B 65, 193403 (2002).
- Hartmann et al. (2009) A. K. Hartmann, R. Kree, and T. Yasseri, J. Phys.: Condens. Matter 21, 224015 (2009).
- Yewande et al. (2005) E. O. Yewande, R. Kree, and A. K. Hartmann, Phys. Rev. B 71, 195405 (2005).
- Joe et al. (2007) M. Joe, C. Choi, B. Kahng, and J.-S. Kim, Appl. Phys. Lett. 91, 233115 (2007).
- Carter (1998) G. Carter, Vacuum 49, 285 (1998).
- Tanemura et al. (1992) M. Tanemura, S. Aoyama, and F. Okuyama, Surf. Interface. Anal. 18, 475 (1992).
- Koponen et al. (1997) I. Koponen, O.-P. Sievanen, M. Hautala, and M. Hakovirta, J. Appl. Phys. 94, 262 (1997).
- Reichel et al. (2007) F. Reichel, L. P. H. Jeurgens, G. Richter, P. van Aken, and E. J. Mittemeijer, Acta Materialia 55, 6027 (2007).
- Frost et al. (2000) F. Frost, A. Schindler, and F. Bigl, Phys. Rev. Lett. 85, 4116 (2000).
- Frost and Rauschenbach (2003) F. Frost and B. Rauschenbach, Appl. Phys. A 77, 1 (2003).
- Frost (2002) F. Frost, Appl. Phys. A 74, 131 (2002).
- Castro et al. (2005) M. Castro, R. Cuerno, L. Vázquez, and R. Gago, Phys. Rev. Lett. 94, 016102 (2005).
- Konarski and Hautala (1995) P. Konarski and M. Hautala, Vacuum 47, 1111 (1995).
- Cui et al. (2005) B. Cui, P. I. Cohen, A. M. Dabiran, and R. Jorgenson, J. Appl. Phys. 98, 083504 (2005).
- Bradley and Cirlin (1996) R. M. Bradley and E.-H. Cirlin, Appl. Phys. Lett. 68, 3722 (1996).