Consistent threshold electro-production at , 0.10, and
Abstract
New, accurate data are presented on the near threshold reaction in the range of four-momentum transfers between =0.05 and 0.15 . The data were taken with the spectrometer setup of the A1 Collaboration at the Mainz Microtron MAMI. The complete center of mass solid angle was covered up to a center of mass energy of above threshold. These results supersede the previous analysis based on three separate experiments, and are compared with calculations in Heavy Baryon Chiral Perturbation Theory and with phenomenological models.
keywords:
Pion electro-production , Threshold production, Chiral Perturbation Theory1 Introduction
Threshold electromagnetic pion production is a fundamental process since the pion is a Nambu-Goldstone boson due to the spontaneously broken chiral symmetry of QCD [1]. Calculations at low energies which are good approximations to QCD are carried out by an effective field theory called Chiral Perturbation Theory (ChPT) [2, 3, 4], and are generally in good agreement with experiment. The systematic application of Heavy Baryon Chiral Perturbation Theory (HBChPT) [5, 6] has been generally successful in describing scattering and electromagnetic pion production from the nucleon [7].
In recent years there has been a considerable experimental effort to test this theoretical approach. The latest published and most accurate of a series of experiments of photo-pion production experiments which was performed at Mainz [8] was in good agreement with the HBChPT [9]111A more recent accurate measurement at Mainz has been performed and is in the final stages of data analysis [10]. These experimental tests can also be extended to four-momentum transfer via pion electro-production. This adds another small scale whose convergence properties are not presently known.
The first threshold neutral pion electro-production experiments were performed at NIKHEF [11, 12] and MAMI [13] at and the results were in reasonable agreement with the calculations [14]. A second measurement at at Mainz [15] indicated a surprisingly rapid variation which was not in agreement with the calculations [14]. However, this conclusion was problematic for three reasons. First, the observed variation was based on three independent experiments [8, 13, 15]. Second, the data analysis programs that were used have been subsequently revised. Finally, a subsequent, independent experiment performed at Mainz at was extended to higher energies above threshold ( at a center of mass pion production angle of ) [16]. This most recent experiment disagreed with the previous values [15] in the near threshold region, and was not in agreement with the calculations based on HBChPT [14]. It was also not in agreement with the phenomenological MAID model [17], but was in generally good agreement with the DMT model which uses a chiral Lagrangian [18, 19].
To resolve the experimental uncertainties of the previous experiments, a new measurement of the variation of the electroproduction cross section was performed in the near threshold region () for . These new results are the subject of this article and will be compared to model [17, 18, 19] and to HBChPT [14] calculations. We point out that since several of the low energy constants of HBChPT have been fitted to the older data with significant experimental errors, these calculations should not be considered as prediction and will have to be re-adjusted to take this into account. For this reason these calculations are not projected to .
2 Formalism
In the one photon exchange approximation, the electro-production cross section of pseudo-scalar mesons can be written as (see e.g. [20])
| (1) | |||||
with the virtual photon flux
| (2) |
and the transverse photon polarization
| (3) |
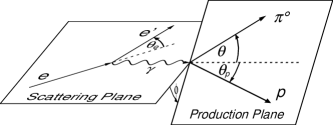
The energy of the initial and scattered electron in the laboratory frame is given by and , the photon equivalent energy is defined as . The photon four-momentum transfer is , with the photon laboratory energy and momentum and . Figure 1 shows the definition of the pion production angles and , which are given in the proton-photon center of mass system (CMS) in the following. In addition, the cross sections also depend on the center of mass energy (or ).
Without variation of the photon polarization , and cannot be separated and only the unseparated cross section
| (4) |
can be extracted.
3 Experiment
The experiment was performed at the spectrometer setup of the A1 collaboration at MAMI (see Ref. [21] for a detailed description of the setup). The MAMI accelerator delivered an unpolarized electron beam with an energy of 855 MeV and a beam current of up to 9 A to an oblong liquid Hydrogen target cell with a width of 1 cm and a length of 5 cm. The beam was rastered across the target cell to avoid local boiling of the liquid hydrogen. A luminosity of was achieved.
| Photon | Proton (A) | Electron (B) | |||
| 0.05 | 0.932 | 45.7∘ | 235.8 | 16.8∘ | 683.5 |
| 0.10 | 0.882 | 45.9∘ | 320.0 | 24.4∘ | 652.9 |
| 0.15 | 0.829 | 45.5∘ | 387.9 | 30.6∘ | 630.0 |
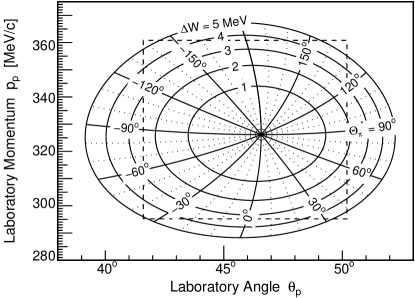
The scattered electron was detected by Spectrometer B with an angular acceptance of 5.6 msr and a momentum acceptance of . The recoil proton was detected by Spectrometer A with an angular acceptance of 21 msr and a momentum acceptance of . Three different setups were chosen corresponding to three values of the four-momentum transfer , table 1 summarizes the kinematic setups. Due to the relativistic boost of the center of mass system, nearly the complete solid angle fits within the acceptance of spectrometer A in a single setup. Figure 2 shows the acceptance in the laboratory system with lines of constant CMS energy and constant CMS angle for the intermediate value of the four-momentum transfer . As can be seen, complete acceptance can be reached up to nearly .
At the focal plane of the spectrometers, vertical drift chambers were used for the position and angular reconstruction of the particle trajectories. Two layers of scintillators were used for trigger purpose and coincidence time measurement. In addition, threshold gas Čerenkov detectors were used to verify that there are no sizable contributions of pions in the electron or proton arm. However, they were not used in the final analysis to reduce systematic errors due to the determination of the inhomogeneous efficiency of these detectors. Both spectrometers reach a momentum resolution (FWHM) of and an angular resolution of better than 0.2 mrad.
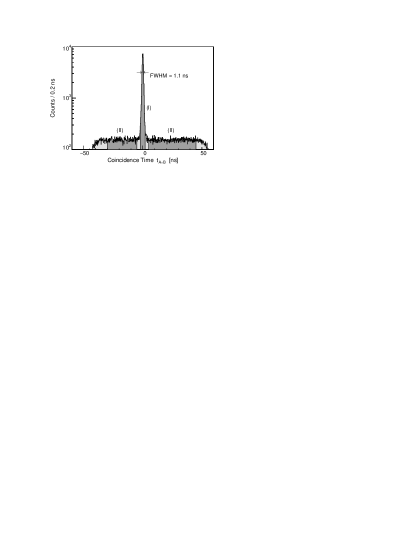
Figure 3 shows the distribution of the coincidence time between spectrometer A and B after correction for the path length of m in each spectrometer. A clear coincidence peak with a width of 1.1 ns FWHM is visible. In addition, a background of random coincidences of a few percent is visible. In the analysis, a cut of ns was used as true coincidences, while cuts on the side bands of and were used to determine the contribution of random coincidences.
The single pion production process was identified by the missing mass of the pion via the four-momentum balance
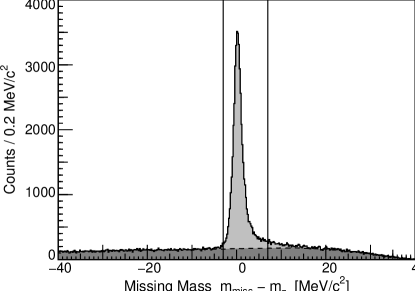
Figure 4 shows the missing mass distribution of one setup with all events below the timing peak (light shaded area) and the events of the side band, scaled by the width of the timing window (dark shaded area). After subtraction of the random coincidences, a background free missing mass peak remains. A cut was used for the identified production events.
The resulting background subtracted events were histogrammed with MeV energy bins and eight bins each in the CMS angles and . These bins were compared to a detailed simulation of the experiment, including the dead-time corrected luminosity and the cross section of the MAID model [17] as generator input. All resolution and line-shape effects, as well as standard radiative corrections [22] were included.
To take the small variation of the cross section within each bin into account, their relative variations were estimated using models. This minimized the effects of non-uniform distribution within the bins and the extracted cross sections can be accurately compared directly to theoretical calculations at the central value of each bin.
For each bin in and a fit of the form
was performed to extract and (see eqn. 1 for cross section structure). Since is small compared to the error bar, it cannot be extracted from the data and the MAID model value was used as a constraint for the fit.


4 Systematic Errors
Since consistency was the problem of the previously existing data sets, special care was taken to minimize and control the systematic errors.
The detection efficiency of a modern high resolution spectrometer is above 95%, thus the efficiency corrections are small and introduce only systematic errors below the percent level. The beam current was measured with a fluxgate magnetometer (Förster probe) in the acceleration path of the last microtron stage, i.e. as the current sum of 90 staggered turns. By this enhancement of the sensitivity, the current was measured on the 1% level. The effective target length introduced the largest error to the overall normalization of the cross section by roughly 3%. In addition to monitoring all these parameters, the normalization was calibrated for each setup by an additional measurement of the elastic scattering from the proton using a standard form factor parametrization [23]. These calibration measurements agreed within 2% with the calculations.
A major source of systematic errors for threshold measurements is introduced by the calibration of the momentum measurement of the electron detection. In the chosen setups, a calibration error of 0.1% can cause a cross section error of up to 14% in the lowest bin by shifting events below the production threshold. Therefore the momentum detection of the electron arm was calibrated in situ by a measurement of the electron momentum in the elastic peak. Since the momentum in the elastic peak is determined only by the scattering angle, the absolute momentum could be calibrated to keV central value. This corresponds to a systematic error of 5% on the normalization in the lowest bin. An uncertainty of the incident beam energy had not to be considered, since a deviation of this energy would affect the elastic line of the calibration measurement by the same amount, resulting in no additional uncertainty in the cross section determination and only a negligible error in the reconstruction of the four-momentum transfer.
The detection of the electron angle and the momentum and angle of the proton was calibrated by considering the recoil proton with a narrow cut on . As can be seen in Fig. 2, these events form a ring in the acceptance of spectrometer A (after correction for different electron scattering angles) and all misalignments would show up as a shift of this ring.
The estimated systematic errors add up to 10% for the lowest bin, 5% for , and for the two highest bins.

5 Results and Discussion
Figures 5, 6, and 7 show the cross section for the first four energy bins above the threshold. For comparison, three calculations are included. The dashed line shows the phenomenological isobar model MAID [17]. This model fits basically all existing photo- and electro-production data and is therefore dominated in the threshold region by the amount of existing photo-production data. The overall good agreement of the data with this model can be interpreted as consistency with the world data set. Even better agreement with the data is shown by the dynamical model DMT [19], which is compared to the MAID model expected to be superior in the threshold region since it is based on a chiral Lagrangian.

For completeness, the calculation in Heavy Baryon Chiral Dynamics of Ref. [14] is included. This curve has to be interpreted with care, since the calculation was fitted to the data of Refs. [13, 12], which show serious consistency problems. These consistency problems are illustrated in Fig. 9, which shows the total cross section of this measurement in combination with the photon point [8] and previous electroproduction data points at (Ref. [15]) and (Ref. [13], consistent with Ref. [12]). The latter was included in the fit of HBChPT and causes probably the unnatural slope of this calculation. This is the reason that the results of this calculation are not shown for in Fig. 9. A refit of the empirical low energy constants with this new data set is needed before any conclusions about its accuracy can be made.
Figure 8 shows for the intermediate value (figures of the other two settings and all data as table are available in the online version of this article). Within the error bar, all three calculations are consistent with the extracted interference cross section.
In summary, the data sets of Refs. [12, 13, 15] seem to have normalization problems beyond the size of the quoted systematic errors. A reanalysis of part of this data at did not reveal any obvious mistakes, however, the extensive additional calibration measurements of the new data set were not done at that time. As discussed above, e.g. a plausible small calibration error in the electron momentum can cause already large normalization errors in the resulting cross section, which was underestimated at that time. We recommend to use the new data for future fits of the total cross section and to use the old data sets only with a free normalization parameter. The old data sets included a full Rosenbluth separation and an extraction of and . The relative size of these cross sections might not be affected by an overall normalization problem. The data of Ref. [16] with emphasis on higher energies are consistent with the new measurement.
6 Summary
In this letter a new consistent data set on neutral pion electro-production in the threshold region is presented. The long standing problem of the normalization of the existing threshold data sets has been clarified. The new data are described best by the dynamical model DMT [19]. However, with a refit of the low energy constants in HBChPT [14], this theory will probably also be able to describe the data, although the range of validity remains still an open question.
This work was supported by the German Research Foundation with the Collaborative Research Center 443 and by the Humboldt Foundation.
References
- Donoghue et al. [1992] J. F. Donoghue, E. Golowich, B. R. Holstein, Camb. Monogr. Part. Phys. Nucl. Phys. Cosmol. 2 (1992) 1–540.
- Weinberg [1979] S. Weinberg, Physica A96 (1979) 327–340.
- Gasser and Leutwyler [1984] J. Gasser, H. Leutwyler, Ann. Phys. 158 (1984) 142–210.
- Gasser and Leutwyler [1983] J. Gasser, H. Leutwyler, Phys. Lett. B125 (1983) 325–329.
- Bernard and Meißner [2007] V. Bernard, U.-G. Meißner, Ann. Rev. Nucl. Part. Sci. 57 (2007) 33–66.
- Bernard [2008] V. Bernard, Prog. Part. Nucl. Phys. 60 (2008) 82–160.
- Bernstein et al. [2009] A. M. Bernstein, M. W. Ahmed, S. Stave, Y. K. Wu, H. R. Weller, Ann. Rev. Nucl. Part. Sci. 59 (2009) 115–144.
- Schmidt et al. [2001] A. Schmidt, et al., Phys. Rev. Lett. 87 (2001) 232501.
- Bernard et al. [1996] V. Bernard, N. Kaiser, U.-G. Meißner, Z. Phys. C70 (1996) 483–497.
- Hornidge and Bernstein [2011] D. Hornidge, A. M. Bernstein (2011). arXiv:1108.6029v1 [nucl-ex].
- Welch et al. [1992] T. P. Welch, et al., Phys. Rev. Lett. 69 (1992) 2761–2764.
- van den Brink et al. [1997] H. B. van den Brink, et al., Nucl. Phys. A612 (1997) 391–417.
- Distler et al. [1998] M. O. Distler, et al., Phys. Rev. Lett. 80 (1998) 2294–2297.
- Bernard et al. [1996] V. Bernard, N. Kaiser, U.-G. Meißner, Nucl. Phys. A607 (1996) 379–401. Erratum A633 (1998) 695-697.
- Merkel et al. [2002] H. Merkel, et al., Phys. Rev. Lett. 88 (2002) 012301.
- Weis et al. [2008] M. Weis, et al., Eur. Phys. J. A38 (2008) 27–33.
- Drechsel et al. [1999] D. Drechsel, O. Hanstein, S. S. Kamalov, L. Tiator, Nucl. Phys. A645 (1999) 145–174.
- Kamalov and Nan Yang [1999] S. S. Kamalov, S. Nan Yang, Phys. Rev. Lett. 83 (1999) 4494–4497.
- Kamalov et al. [2001] S. S. Kamalov, S. Nan Yang, D. Drechsel, O. Hanstein, L. Tiator, Phys. Rev. C64 (2001) 032201.
- Drechsel and Tiator [1992] D. Drechsel, L. Tiator, J. Phys. G18 (1992) 449–497.
- Blomqvist et al. [1998] K. I. Blomqvist, et al., Nucl. Instrum. Meth. A403 (1998) 263–301.
- Mo and Tsai [1969] L. W. Mo, Y.-S. Tsai, Rev. Mod. Phys. 41 (1969) 205–235.
- Mergell et al. [1996] P. Mergell, U.-G. Meißner, D. Drechsel, Nucl. Phys. A596 (1996) 367–396.